


 texto en
  Inglés (pdf)
 Articulo en XML
 Enviar articulo por email
 Permalink
INTRODUCTION
Depressive disorders, together with heart disease, constitute the group of diseases with the highest prevalence and growth in the world’s population, thus becoming a public health problem1. Estimates refer to more than 300 million people living with this psychological distress condition, with an increase of more than 18% between 2005 and 20152),(3. In 2020, the World Health Organization estimates that depression will reach the second place in the list of “Disability Adjusted Life Years - DALYs” ranking, regardless of age and gender4.
Medical students are usually affected by depression, which can have negative consequences on their academic performance and professional future4. The clinical symptoms of depression are diverse and can be permeated by depressed mood, sadness, loss of interest or pleasure, significant weight loss or gain, insomnia (initial, maintenance or terminal) or hypersomnia, agitation or psychomotor retardation, fatigue or loss of energy, feelings of uselessness or inappropriate guilt, indecision or decreased capacity to think or concentrate and recurring thoughts of death5.
A considerable number of higher education students have some type of psychiatric disorder during their training6. Studies carried out in Dubai and Estonia show a prevalence of depression in medical students of around 28.6% and 30.6%, respectively7),(8. In Brazil, studies in university centers in São Paulo and Goiás showed that 38.2% and 26.8% of medical students had depressive symptoms, respectively9),(10.
Medical students usually do not seek medical help for their problems, constituting one of the main barriers to psychiatric care in this group9. Analyses have shown that, despite the high emotional loads that this group endures, less than 20% seek to take care of their Mental Health during their training9),(11. As a consequence, there is a high prevalence of suicide, depression, drug use, marital disorders and professional disorders4),(9),(11)-(16.
Some variables can justify depressive symptoms in medical students, such as: large number of disciplines, many hours of study, responsibility dealing with lives, broad contact with several diseases and prognoses that are not always positive and uncertainty regarding their entering the job market 17. Moreover, stressful factors - such as pressure to learn, a lot of new information, lack of time for social activities - can also contribute to this situation18.
One of the factors that can be evidenced in the pathophysiology of depression is the increase in the levels of cortisol, a steroid hormone produced by the adrenal glands in response to stress and regulated by the adrenocorticotropic hormone (ACTH), which is synthesized in the anterior portion of the pituitary gland19. The association of this hormone with the disease is due to changes in the hypothalamic-pituitary-adrenal (HPA) axis and the increase in the production and secretion of the Corticotropin-Releasing Hormone (CRH), a hypothalamic hormone that regulates ACTH secretion by the pituitary20-24. From this perspective, studies indicate hypercortisolemia in patients with depression and that this factor may be related to its onset 21),(23)-(25.
The high levels of cortisol result in hippocampal lesions and alter glucocorticoid receptor function, with a decrease in the negative feedback exerted by the hormone, which leads to a deregulation of the HPA axis21),(23. Moreover, such lesions in the hippocampal region involve the memory and learning processes, which are affected during the development of the disease22),(24),(26.
As for the low level of the serotonin neurotransmitter found in patients with depression, studies state that its production is also compromised in cases of hypercortisolemia, since its precursor is displaced to other metabolic pathways, in addition to the fact that this condition results in a decrease in hippocampal receptors for this neurotransmitter21),(24.
There is a tendency for depressive symptoms to increase as the course progresses, mainly due to the pressure of medical training, competition to enter the job market and the change in daily habits12),(27)-(29, which suggests the importance of adequate mental health monitoring of individuals with such symptoms10),(17),(27.
Considering the stigma created by psychiatric diseases, as well as the lack of support from the social circle itself, people with depressive symptoms are resistant to seek medical help to attain a healthier and more productive life3. Therefore, the importance of research on mental disorders is evidenced, especially for the early detection of depression in groups that live under constant stressors, such as medical students, for instance, as well as for the understanding of the pathophysiological bases in the context of the involved biopsychosocial aspects.
Therefore, the present study aimed to determine the prevalence of depression in medical students at a university center in Maceió and its correlation with serum cortisol levels, lifestyle and socioeconomic profile.
MATERIALS AND METHODS
This was a quantitative, analytical, cross-sectional study that used a questionnaire-based approach and measurement of morning serum cortisol levels. The population consisted of 320 students between the second and eighth semesters of the medical course at a University Center located in the city of Maceió, state of Alagoas, Brazil. As it is a new course at the institution, there were still no classes attending medical internship (from the ninth to the twelfth semesters). Students attending the first semester of undergraduate school were excluded from the research to avoid confusion bias, due to the possible influence of stressors related to the recent university’s admission exam, in addition to having to adapt to the new study routine.
The study was approved by the Institutional Research Ethics Committee, under number CAAE 69217517.9.0000.0039, of which recorded documents contained the research information and the instruments used, with knowledge of and authorization by the course coordination.
Data collection was carried out between April and May 2018, in which participants were selected by probabilistic sampling, in a stratified random sample, totaling 122 students who accepted to participate in the study and signed the free informed consent form (ICF), of both genders, over 18 years old, without diagnosed hormonal dysfunctions and not using hormonal medications, such as hormonal supplementation or corticosteroids, since these affect the pituitary-hypothalamus-adrenal system and could compromise the results of the serum cortisol levels.
Data collection was carried out using questionnaires containing objective questions. Issues related to socioeconomic data, lifestyle and psychosocial aspects were addressed. The instruments used were: the Beck Depression Inventory (BDI), consisting of 21 groups of statements that assess the rates of depressive symptoms30; and the questionnaire to assess life habits and socioeconomic levels, consisting of 30 objective questions that address variables that may be directly associated to depression in students, such as gender; age group; time spent in extra-class study; times spent in in-class study; practice of physical activities; monitoring by health professionals; religion; leisure time; family time, among others31.
After data collection, the results of the depressive symptoms were categorized as recommended by the Beck Depression Inventory; therefore, there are four categories of symptom classification subdivided by scores: 0-13 (none or minimum); 14-19 (mild); 20-28 (moderate); 29-63 (severe)30.
The measurement of morning serum cortisol levels, which is an important stress marker and may be related to depressive symptoms, the object of this research, was performed by a specialized team from a laboratory diagnostic center, who came to the institution and, after the collection, transported and analyzed the samples using the chemiluminescence method.
After data collection, statistical analyses were performed in order to compare the quantitative and qualitative variables - serum cortisol levels; gender; age group; time spent in extra-class study; weekly course load; practice of physical activities; monitoring by health professionals; religion; leisure time; family time. The data were organized in tables and graphs after the statistical analysis.
In the inferential statistics, the presence or absence of depressive symptoms in the interviewed students was assessed using the univariate analysis of variance (one-way ANOVA), after verifying the normality and homoscedasticity of the data using the Shapiro and Levene tests, respectively32. Significant differences in the absolute frequency between the identified categories of depressive symptoms (minimal, mild, moderate and severe) were investigated using Tukey post-hoc test.
Possible influences of the life habits of the study participants (e.g., religion, hours of sleep, hours of study and consumption of alcoholic beverages) on the obtained scores of depressive symptoms and cortisol levels were analyzed using the Kruskal-Wallis test. Specifically, the categories of answers obtained for each question were considered as nominal variables33, allowing comparisons to be made between different subsets of data. In terms of inferring the meaning of the obtained results, the participants who chose not to answer a certain question were excluded from the analyses. In addition, the association between the Beck Depression Inventory scores and the students’ morning serum cortisol levels was tested using simple linear regression.
All statistical analyses were performed using the free software PAST statistics34, adopting a significance level of 5% (p <0.05).
RESULTS
One hundred twenty-two Beck Depression Inventories (IDB) delivered by the research volunteers were counted. According to the cutoff points, the results were subdivided by scores of depressive symptoms into the following: 0-13 (none); 14-19 (mild); 20-28 (moderate); 29-63 or more (severe), with the distribution according to gender and classification of depressive symptoms shown in Table 1.
Table 1 Distribution by gender and score obtained at the Beck Depression Inventory in medical students from a private institution in Maceió, 2018
| Classification of depressive symptoms | Male | Female | Total | |||
|---|---|---|---|---|---|---|
| n | % | n | % | N | % | |
| 0 to 13 - None | 28 | 63.7 | 46 | 59.0 | 74 | 60.6 |
| 14 to 19 - Mild | 5 | 11.4 | 23 | 29.5 | 28 | 23.0 |
| 20 to 28 - Moderate | 4 | 9.0 | 5 | 6.4 | 9 | 7.4 |
| 29 to 63 - Severe | 2 | 4.5 | 1 | 1.3 | 3 | 2.5 |
| DWA* | 5 | 11.4 | 3 | 3.8 | 8 | 6.5 |
| TOTAL | 44 | 100 | 78 | 100 | 122 | 100 |
p>0.05 (p: 0.30). *DWA = Didn’t want to answer Source: Research, 2018.
The values obtained with the Beck scale for the interviewed students ranged between 0 and 34, with an average value of 11.21 ± 6.89. Research participants were characterized by the absence (65%) or the presence of depressive symptoms of mild (24.5%), moderate (7.9%) and severe intensity (2.6%) (ANOVA, F=11, 27, p <0.05, Figure 1).
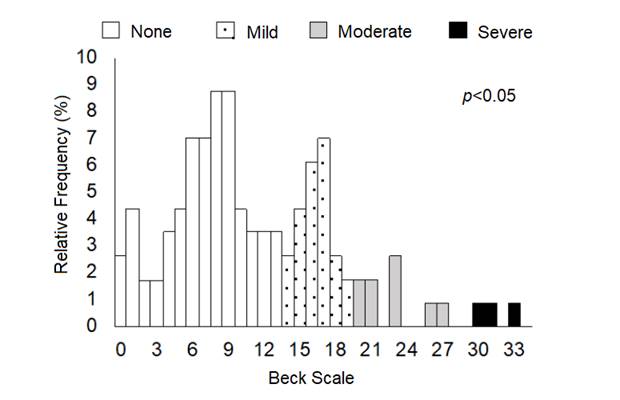
Source: Research, 2018.
Figure 1 Relative frequency (in %) of the values obtained in the Beck scale applied to medical students from a private institution in Maceió, Alagoas.
The distribution of serum cortisol values of medical students participating in the research is shown in Table 2, with a mean value of 12.72 µg/dL, with a standard deviation (SD) of 3.96, a maximum value of 29.7 µg / dL and a minimum value of 0.9 µg / dL.
Table 2 Distribution of serum cortisol values of medical students from a private institution in Maceió, 2018
| Classification of serum cortisol values | Total | |
|---|---|---|
| n | % | |
| < 6,7 µg/dL. - Below the RV* | 11 | 9.0 |
| 6,7 a 22,6 µg/dL. - Within the RV* | 104 | 85.3 |
| > 22,6 µg/dL. - Above the RV* | 7 | 5.7 |
| TOTAL | 122 | 100 |
*RV = Reference value by the chemiluminescence method (6.7 e 22.6 µg/dL) Source: Research, 2018
The mean cortisol level of students who had some depressive symptom according to the BDI was as follows: severe symptoms: 9.77 µg/dL, (SD = 7.06); moderate symptoms: 12.96 µg / dL (SD = 4.51); mild depressive symptoms: 12.75 µg/dL (SD = 5.3). Those who had minimal or nonexistent depression had a mean serum cortisol of 12.89 µg dL, (SD = 5.54).
The absolute and relative percentage of the sociodemographic characteristics analyzed in the study are shown in Table 3, related to the total of 114 research participants who delivered the appropriately filled out socio-economic questionnaire forms. Of these, 13 participants (11%) reported they had been previously diagnosed with a mental disorder, 98 (86%) had not been diagnosed and 3 (3%) did not want to respond. Regarding being monitored by a health professional, only 36 (32%) said that they were. Of these, only 27 (24%) were monitored by doctors.
Table 3 Absolute (n) and relative percentage (%) frequencies of sociodemographic characteristics of medical students from a private institution in Maceió, 2018
| Sociodemographic characteristics | |||||||||||
|---|---|---|---|---|---|---|---|---|---|---|---|
| n | %* | n | %* | n | %* | n | %* | ||||
| Gender | Ethnicity | Age group | Level of schooling | ||||||||
| Male | 39 | 34 | White | 60 | 52 | 18 to 23 years | 78 | 69 | Higher education | 17 | 15 |
| Female | 75 | 66 | Black | 3 | 3 | 24 to 29 years | 27 | 24 | Incomplete Higher education | 97 | 85 |
| Yellow | 3 | 3 | 30 to 35 years | 4 | 3 | ||||||
| Brown | 47 | 41 | 36 to 41 years | 5 | 4 | ||||||
| Indigenous | 0 | 0 | |||||||||
| DWA ** | 1 | 1 | |||||||||
| Professional activities | Duration of professional activity | Personal income | Number of people contributing to income | ||||||||
| Dentistry | 2 | 2 | No activity at the moment | 100 | 88 | No income of their own | 56 | 49 | 1 person | 25 | 22 |
| Pharmacy | 2 | 2 | < 5 years | 5 | 4 | Up to 1 minimum wage | 5 | 4 | 2 people | 76 | 67 |
| Others | 10 | 9 | 6 to 15 years | 8 | 7 | 1 to 6 minimum wages | 15 | 13 | 3 people | 6 | 5 |
| No professional activities | 99 | 86 | 16 to 25 years | 1 | 1 | 7 to 12 minimum wages | 1 | 1 | 4 or more people | 6 | 5 |
| DWA** | 1 | 1 | > 12 minimum wages | 13 | 12 | DWA** | 1 | 1 | |||
| DWA** | 24 | 21 | |||||||||
| Housing conditions | Number of people in the house | Monitoring by health professional | Student Financing Program | ||||||||
| Owns home | 75 | 66 | One | 16 | 14 | No | 78 | 68 | Yes | 32 | 28 |
| Rented house | 21 | 18 | Two | 22 | 19 | Yes | 36 | 32 | No | 81 | 71 |
| Student residence | 1 | 1 | Three | 28 | 24 | DWA** | 1 | 1 | |||
| Family home | 16 | 14 | Four | 24 | 21 | ||||||
| DWA** | 1 | 1 | Five or more | 20 | 18 | ||||||
| DWA** | 4 | 4 | |||||||||
| Religion | |||||||||||
| Catholic | 67 | 58 | |||||||||
| Evangelist | 13 | 11 | |||||||||
| Spiritualist | 14 | 12 | |||||||||
| Jewish | 0 | 0 | |||||||||
| Muslim | 0 | 0 | |||||||||
| Seicho-no-Ie | 0 | 0 | |||||||||
| No religion | 16 | 14 | |||||||||
| Another | 2 | 1 | |||||||||
| DWA** | 2 | 1 | |||||||||
* Rounded values / ** DWA = Didn’t want to answer Source: Research, 2018.
As for the hours per week performing professional activity in an area outside Medicine, 21 (18%) said they worked less than 30 hours a week, 3 (2%) worked between 30 and 44 hours and 1 (1%) worked more than 44 hours. Regarding instructions on mental health, 59 (52%) stated that they had already been instructed, 43 (38%) said they had never been instructed and 12 (10%) did not inform.
Regarding how frequently they see their relatives, 95 (83%) reported seeing their relatives at least once a week, while 18 (16%) spent more than a week without seeing them. One (1%) reported never seeing their relatives. As for the level of satisfaction with the course on a scale of 0 to 5, with 0 being “totally dissatisfied” and 5 “fully satisfied”, only 1 (1%) volunteer scored 1 on the scale, 8 (7%) scored 2, 38 ( 33%) scored 3, 48 (42%) scored 4 and 19 (17%) considered themselves fully satisfied with the course, scoring 5 on the scale.
Table 4 shows the absolute and relative frequencies of the main lifestyle habits of medical students participating in the research.
Table 4 Absolute (n) and relative percentage (%) frequencies of the life habits of medical students from a private institution in Maceió, 2018
| Life habits | |||||||||||
|---|---|---|---|---|---|---|---|---|---|---|---|
| N | %* | n | %* | n | %* | n | %* | ||||
| Current semester | Time spent in in-class study | Time spent in extra-class study | Breaks during the study period | ||||||||
| Second | 14 | 12 | < 30h | 11 | 10 | < 30h | 94 | 83 | Yes | 106 | 93 |
| Third | 29 | 26 | 30 to 44h | 89 | 78 | 30 to 44h | 17 | 14 | No | 8 | 7 |
| Fourth | 20 | 18 | > 44h | 9 | 8 | > 44h | 0 | 0 | |||
| Fifth | 14 | 12 | DWA** | 5 | 4 | NDR** | 3 | 3 | |||
| Sixth | 24 | 21 | |||||||||
| Seventh | 1 | 1 | |||||||||
| Eighth | 12 | 10 | |||||||||
| Personal life impaired by the workload | Hours of sleep a day | Weekly physical activity | Alcohol consumption | ||||||||
| Yes | 94 | 83 | < 6h | 51 | 45 | Once | 7 | 6 | Yes | 60 | 53 |
| No | 20 | 17 | 6 a 8h | 63 | 55 | Twice | 22 | 19 | No | 49 | 43 |
| 3 to 5 times | 49 | 43 | DWA** | 4 | 4 | ||||||
| > 5 times | 2 | 2 | |||||||||
| Does not practice | 33 | 29 | |||||||||
| Smoking | Illicit drug use | ||||||||||
| Yes | 0 | 0 | No | 109 | 95 | ||||||
| No | 114 | 100 | Marijuana / Hashish | 1 | 1 | ||||||
| Others | 1 | 1 | |||||||||
| DWA** | 3 | 3 | |||||||||
* Rounded numbers / ** DWA = Didn’t want to answer Source: Research, 2018.
Among the analyzed explanatory variables, only religion had a significant influence on depressive symptoms (Table 5), with a prevalence of higher scores among students who did not have a religion (Figure 2). Regarding the association between depressive symptoms and morning serum cortisol levels, no correlation was observed between the variables (p> 0.05, Figure 3). The same was true for the other life habit variables analyzed, which did not show significant correlation with the cortisol levels of the research participants (Table 6).
Table 5 Statistical results of the influence of variables related to the lifestyle habits of medical students from a private institution in Maceió on depressive symptoms assessed by the Beck scale
| Variable | H (chi2) | P |
|---|---|---|
| Gender | 1.031 | 0.30 |
| Age range | 2.032 | 0.56 |
| Religion | 4.266 | 0.03* |
| Sleep duration (hours) | 1.572 | 0.20 |
| In-class studies (hours) | 0.478 | 0.78 |
| Extra-class studies (hours) | 2.943 | 0.08 |
| Physical activity (days) | 0.792 | 0.37 |
| Alcohol consumption | 0.131 | 0.71 |
* p <0.05 shows statistical significance Source: Research, 2018.
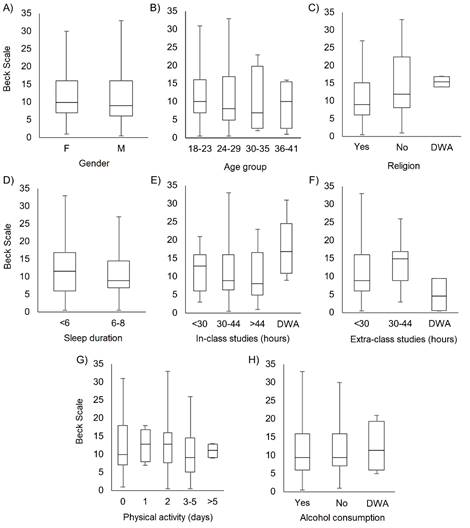
Source: Research, 2018.
Figure 2 Distribution of the values obtained in the Beck scale in relation to the life habits of medical students from a private institution in Maceió, Alagoas.
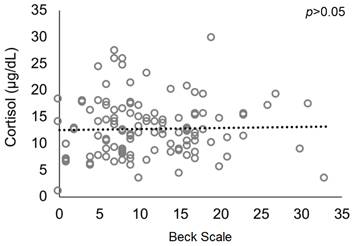
Source: Research, 2018.
Figure 3 Association between depressive symptoms (as shown by the Beck scale) and cortisol levels of medical students from a private institution in Maceió, Alagoas.
Table 6 Statistical results of the influence of the variables related to life habits on morning serum cortisol levels of medical students from a private institution in Maceió
| Variable | H (chi2) | p |
|---|---|---|
| Gender | 3.136 | 0.07 |
| Age range | 5.082 | 0.16 |
| Religion | 1.146 | 0.56 |
| Sleep duration (hours) | 0.012 | 0.90 |
| In-class studies (hours) | 3.009 | 0.39 |
| Extra-class studies (hours) | 1.503 | 0.45 |
| Physical activity (days) | 0.815 | 0.36 |
| Alcohol consumption | 1.135 | 0.56 |
Source: Research, 2018.
DISCUSSION
Serum cortisol levels and depressive symptoms
The present cross-sectional study analyzed the association between serum cortisol levels and the presence of depressive symptoms in medical students. The prevalence of depressive symptoms in medical students found in the sample was 32.9%, ranging from mild to severe. This prevalence is comparable to those found in studies carried out in Dubai and Estonia - 28.6% and 30.6%, respectively7),(8, as well as those observed in other Brazilian states, such as São Paulo (38.2%) and Goiás ( 26.8%)9),(10.
Despite the considerable prevalence of depressive symptoms in the assessed population, the serum cortisol values, in general, were within the normal range. It can be emphasized that blood collection was carried out in the middle of the school year, which may favor lower levels of cortisol when compared to periods with greater stressors, such as test periods or end of the semester.
Still, paradoxically to what the studies on the pathophysiology of depression have suggested20),(24),(25),(35),(36) and reinforcing the controversy on the subject, the statistical analysis did not show an association between the variables cortisol levels and the presence of depressive symptoms in the analyzed population.
As a neuroendocrine response, depressive symptoms are exacerbated in the presence of a stressful event but remain exacerbated for a longer time when compared to cortisol levels18. In this sense, normal values in the collected samples do not exclude the possibility of the previous presence of hypercortisolemia in these individuals with depressive symptoms, since this measurement was sporadic and there was no monitoring of the serum cortisol levels throughout the school semester.
Other hypotheses to be considered to explain the results found herein may be related, for instance, to the non-standardization of the laboratory analysis in the different, previously published studies, whether in relation to the type and number of samples and method; to the inability of the method to detect mild cortisol changes in individuals with depressive symptoms; or even the absence of a cut-off point established for depressive symptoms.
As a possibility to increase the sensitivity of cortisol measurement with the suspicion of depressive symptoms, in addition to the use of longitudinal studies, the literature suggests other measurement forms, such as salivary, urinary, measurement from hair strands, and the previous suppression of hypothalamic-pituitary-adrenal axis with dexamethasone so the result could show greater reliability18),(35),(36.
The absence of a statistical correlation between the variables can also be attributed to the multifactorial origin of depressive disorders. The genotype, personality and environmental aspects can explain different types of responses to the same stressful events, so that the HPA axis is just one of the systems that contribute to the etiology of depression. In this context, the dysfunction of the HPA axis could be seen as a fundamental biological cause of major depression or, on the other hand, be a secondary phenomenon that appears in later stages24.
As cortisol is a hormone directly related to stress, the present study can be compared with the results found by Lima et al. (2016), who obtained a prevalence of 60.9% of stress symptoms in medical students from the first to the eighth semesters at a public university in the state of Paraná, through the application of the Lipp’s Stress Symptom Inventory for Adults37. Other studies that used the same methodology showed similar results: 49.7% at a public university in Ceará38 and 65.2% at a public university in Rio de Janeiro39. Thus, even with normal cortisol levels, stress cannot be excluded as a risk factor for depression in this specific population.
Socioeconomic aspects and depressive symptoms
Regarding the social aspects involved in the development of depressive symptoms, rates 1.5 to 3-fold higher can be seen in females. Still, they are more commonly found in people without intimate emotional ties, such as separated or divorced individuals. The male gender usually details the complaints or transfers them to other elements, such as alcohol. However, the phenomenology, the course of the disease and response to treatment are similar between the genders5),(40.
The highest number of cases occurs between the 3rd and 6th decades of life, being three times more common in young people aged 18 to 29 years than in individuals over 60 years old5),(40. Among the economic factors considered, there is a higher prevalence of depressive symptoms in people from less favored social classes and those living in rural areas40. Despite this, in the present study, no other socioeconomic variable, except religion, was statistically significant.
Regarding religiousness, according to the World Health Organization, spiritual well-being is one of the dimensions of the health status, a fact that makes considering spirituality as one of the determinants of quality of life41. Since quality of life is seen as an integrated level of satisfaction and well-being, the hypothesis that religion influences the prevention of depressive symptoms is a valid one, as the present study was able to reveal a statistically significant association (p: 0.03) of how the belief in some religion is related to the prevention of the development of depressive symptoms, suggesting an inverse association between religiousness and psychiatric disorders.
Literature reports spirituality as a healthy attitude towards disease, since they consider it a way for the resignification of the meaning of life, favoring the painful acceptance and constituting a type of help that transcends itself. This transcendental experience of the psyche is similar to that stimulated with psychological therapy41, that is, it psychodynamically influences and helps the individual to deal with anxiety, fear, frustrations, anger, discouragement, among others42.
Religion also acts as a dimension that influences quality of life, a fact observed in qualitative studies that verify that people who have faith feel stronger when facing difficulties, believing in the cure of their condition. Another factor that may be related to the protective effect of religion against the development of depressive symptoms is the formation of protective behaviors, for instance, socialization and non-use of drugs, resulting in lower rates of chronic diseases and stresses42.
CONCLUSION
This study highlights the high prevalence of depression among medical students, as well as the multifactorial nature of the disease. The absence of statistical correlation between depressive symptoms and serum cortisol levels reported in the present study, to the detriment of the statistical correlation with socioeconomic variables, show that an alteration in the hypothalamic-pituitary-adrenal axis is not the only etiology associated with the development of depression. In turn, religious practice showed to be statistically significant in regard to the lowest rate of depressive symptoms, revealing itself as a probable protective factor against its development. Therefore, given the presented context, the creation and improvement of psychological support programs in Higher Education Institutions - especially in Medical Schools - are imperative, as mental health is still neglected and leads to serious consequences, both in personal life and in the future professional practice.

