


 texto en
  Inglés (pdf)
 Articulo en XML
 Enviar articulo por email
 Permalink
INTRODUCTION
Early childhood and early childhood education have gained prominence in the literature of several fields of knowledge over the past decades. In particular, educational aspects of early childhood began to receive greater attention around the 1990s, which was reflected in public policies on the subject. As a result, several studies began to emphasize the importance of sound policy on early childhood, especially regarding disadvantaged or vulnerable children (CUNHA; HECKMAN, 2007; HECKMAN, 2000, 2006). Early childhood is known to be a critical stage for the development of fundamental cognitive and socio-emotional skills, whose effects are lasting and important throughout life.1 There is evidence that early childhood- oriented policies for vulnerable groups have positive effects on various indicators of well-being, such as decreased levels of poverty, inequality and urban violence (LOCHNER, 2011).
In Brazil, this change in perception of early childhood education also occurred, mainly after the 1988 Constitution (BRASIL, 1988). Before that, early childhood education was considered a stage prior to formal education. The Constitution established education up to the age of 5 years as a social right (art. 7th, item 25) and a responsibility of the state (art. 208, item 4). The sequence of legal changes in the following years is evidence of that gradual change in perception. In 1996, early childhood education (creche and pré-escola)2 was integrated into basic education (with the same status as primary and secondary education). Brazil’s federative system had already made preschool a responsibility of municipalities (with technical and financial cooperation from federal and state governments), but daycare was included in the constitutional text when the term “preschool” was replaced by “early childhood education” in 2006 (BRASIL, 2006). Over the period, qualification requirements were established for teaching in early childhood education. Furthermore, preschool became legally mandatory in 2009 (BRASIL, 2009) and the mandatory enrollment of children aged 4 and 5 years was included in the National Education Guidelines and Framework Law in 2013 (BRASIL, 2013). Based on the National Education Plan (PNE), in 2014, a daycare provision target was set at 50% of children between 0 and 3 years of age (BRASIL, 2014). A few years later, the National Common Curricular Base (BNCC) was established, including early childhood education, in 2017.
Despite this evolution, the provision of early childhood education, which is free in the country, is still a challenge for many municipalities. Although a middle-income country, Brazil is known for its high levels of poverty and inequality, despite declines in the 2000s.3 In addition, education quality indicators for later education levels are worrisome, despite some improvements in recent decades.4 Therefore, well-designed policy on early childhood is critical, since this is a period in which interventions are highly effective at low costs.5
For the reasons above, daycare and preschool attendance is an important component of a successful development policy (NÚCLEO DE CIÊNCIA PELA INFÂNCIA - NCPI, 2014). Specifically in relation to daycare, social transformations have also increased the importance of the stage, which covers children aged between 0 and 3 years. Women’s participation in the workforce, which was 41.7% in Brazil in 1990 and reached 55.1% in 2019, is even higher among young women, reaching three quarters of this age group (73.6% for women aged 25 to 34 years in 2019) (INTERNATIONAL LABOUR ORGANIZATION - ILO, 2021). Another social change was the significant increase in single-parent households: according to the 2018 Continuous National Household Sample Survey (Continuous PNAD), 7.6% of Brazilian children aged between 0 and 3 years lived with only one adult aged 18 or over, a proportion that corresponded to 6.5% according to PNAD 2001. Therefore, there was a 16% increase in children living in single-parent homes over this period. These social changes have possibly increased daycare demand.
There is a consensus in the literature that preschool, globally considered, has positive and significant effects in terms of cognitive development, learning, education level and income. With regard to daycare, the effects are heterogeneous, and the quality of daycare centers is a fundamental factor. Most of the literature works with data from developed countries, mainly the United States, where several studies have already detected an achievement gap between children of different socioeconomic and racial groups before entering preschool (BEREITER; ENGELMANN, 1966; DEUTSCH; KATZ; JENSEN, 1968; FRYER; LEVITT, 2004; RUMBERGER; ANGUIANO, 2004). Fernald, Marchman and Weisleder (2013) showed that, already at 18 months of age, there are significant differences between children of different socioeconomic strata in terms of language proficiency. The financial costs of these differentials are estimated at US$ two trillion in the US (AUGUSTE; HANCOCK; LABOISSIERE, 2009). Such findings suggest that daycare could play an important role in reducing those differentials. Among economists, James Heckman and associates have insisted, in numerous studies, that early childhood policy is less costly than remedying performance differentials in later childhood or adolescence (CUNHA; HECKMAN, 2007; HECKMAN, 2000).
According to some studies, children who attend good quality daycare centers perform better in school in the following years (BELSKY et al., 2007; VANDELL et al., 2010). On the other hand, more hours in daycare were associated with behavioral problems in early primary education and adolescence in the US (BURCHINAL; VANDELL; BELSKY, 2013). While some studies report that the positive impacts of daycare tend to disappear over time, those positive effects are greater for children of disadvantaged families (LOEB et al., 2007; MAGNUSON; RUHM; WALDFOGEL, 2007). Alternatively, smaller-scale programs implemented in the US, such as the well-known Chicago Child-Parent Center, Perry Pre-School Program and Abecedarian, show more lasting positive results, but are difficult to implement on a large scale.
The national literature findings are similar to those in international literature. In Brazil, Curi and Menezes-Filho (2009) observed that daycare is associated with completion of high school and university education. Correa, Comim and Tai (2014) indicate that children of low socioeconomic status benefit more from attending daycare, although these effects are smaller when parental involvement is low. Pinto, Santos and Guimarães (2017) found evidence that daycare attendance raises scores in proficiency tests, though by a small magnitude (results for preschool are higher). The possibility of greater learning throughout basic education, caused by daycare attendance, translates into productivity gains and, consequently, higher wages throughout adult life. In other words, evidence, both national and international, indicates that early childhood education can be very beneficial for children of vulnerable families. In addition, daycare provision helps disadvantaged families in yet another aspect: it allows for increased family participation in the labor market, thereby reducing poverty - which benefits both children and their parents or caregivers.
Given the challenges to creating early childhood policy in Brazil, this study proposes a Daycare Need Index (INC) for Brazilian municipalities, whose objective is to guide the distribution of daycare vacancies for children aged between 0 and 3 years living in urban areas across the country. The index covers projections for the period from 2018 to 2020, but its methodology allows updating for later years. In addition, this indicator is constructed according to priority criteria for daycare provision, so that public resources are used more efficiently and fairly. Spatial inequality is known to be a significant problem in Brazil, which means that that certain areas have a greater need for daycare centers than others. According to a series of criteria, the present work seeks to estimate the number of daycare vacancies needed in different areas across the country. Those criteria, which will be defined and justified further on, include children living in urban areas, from poor families, single-parent families and families in which the mother or primary caregiver is economically active, or would be so if they had access to daycare provision.
The research methodology was partially based on a previous study focused on the state of Rio Grande do Sul (RS) (BERNARDINI; KANG; WINK JUNIOR, 2016). The previous work on RS was motivated by the passage of the PNE 2014-2024, which led the state government to create a working group to study the matter in Rio Grande do Sul.6 Among the PNE’s goals was to expand daycare provision so as to reach 50% of children aged from 0 to 3 years by 2024. Such target reflects the serious daycare shortage at the time and the growing importance given to early childhood education in the field of public policy. In this article, we extend the methodology to the national level.7
As mentioned earlier, we present here an indicator of need which is based on ex-ante criteria. Despite the 50% target set by the PNE, we are not using that number as a limit in this work, though the INC may be used to assess the adequacy of this target. Nor are we estimating a pure measure of daycare demand. Of the three population groups considered for the index, the two priority groups (poor children and children in single-parent families) were normatively chosen on the basis of vulnerability criteria. As for the third group, we prioritized aspects of daycare demand in families who fall under the following categories: poor; single-parented; and with a mother or primary caregiver who is or would be economically active. The findings herein, therefore, derive from these methodological options. Such choices are based on the beneficial effects of daycare for children of lower socioeconomic status and on social change in terms of labor market and family structure. Although daycare quality is not directly addressed here, this study is an important step towards understanding where day care is most needed.
This paper comprises three sections in addition to this introduction. Data sources and the methodology for building the index are described next. Then, the main results are presented, and the gaps between current attendance rates and the estimated need for daycare in each municipality are analyzed. Lastly, final considerations are presented. The database containing the estimated INC and total of children aged 0 to 3 years in the municipalities and in each federative unit (UF)8 (2018-2020), in addition to the total of children aged 0 to 3 years enrolled in daycare, also in the municipalities and by UF (2018), can be obtained upon request to the authors.
DATA AND METHODOLOGY
Based on data from the Brazilian Institute of Geography and Statistics (IBGE) for 2018 and 2019, as well as on state-level projections by age group for 2020, estimates were made of the population aged between 0 and 3 years, by municipality, from 2018 to 2020. Then, using information from the 2010 Demographic Census and the PNAD, both from IBGE, for the period 2009-2018, the total population in urban areas in this age group was identified. The children selected from this group were from:
poor families;
single-parent families;
non-poor, non-single-parent families whose mothers*9 are economically active or would be so if they had access to daycare provision.
In other words, the total of children aged 0 to 3 years, living in urban areas, per municipality from 2018 to 2020 was identified. Out of these, a group was formed with the children of poor families. Out of the non-poor, the number of children in single-parent families was calculated. We consider that all children who meet these first two criteria need daycare. Then, out of the children from non-poor, non-single-parent families, i.e., the remainder, we estimated the number whose mothers are economically active (or would be so if they had access to daycare provision). From this number, only a part is selected, according to the estimated demand of families for daycare. The total of children selected using these criteria constitutes the target group. Figure 1 exemplifies the method graphically. The following sections justify the criteria and detail the calculation methodology.
Criteria
In the following paragraphs, we justify the criteria for the index composition. Some of these arguments were presented in a previous work (BERNARDINI; KANG; WINK JUNIOR, 2016). First, the index includes only a portion of the children living in urban areas, and the prioritization criteria are related to poverty, single parenthood and the participation of mothers* in the workforce.
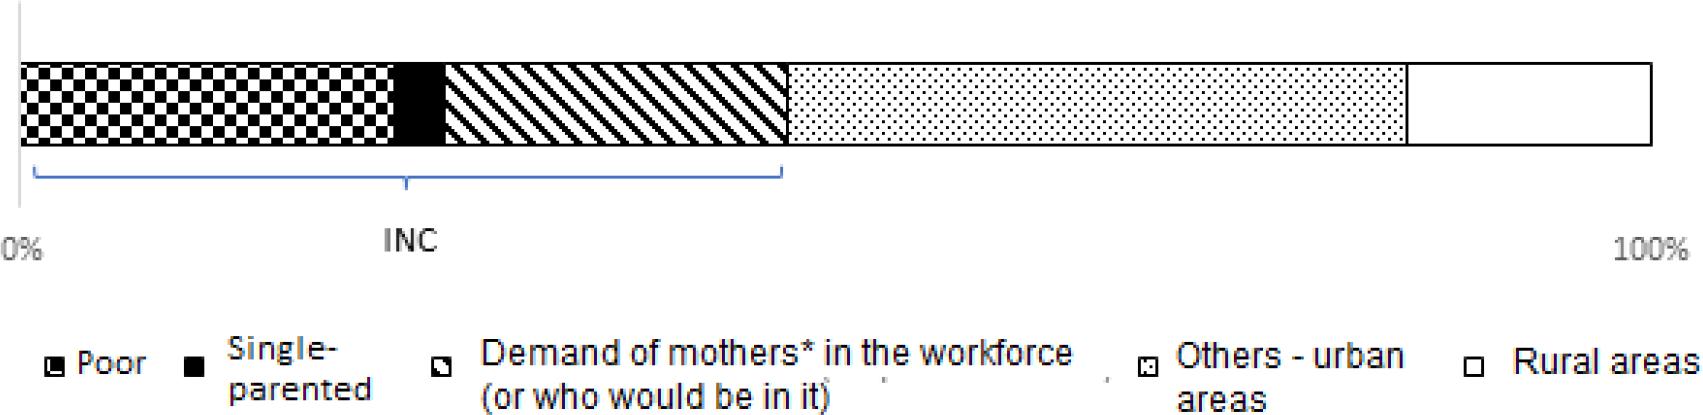
Source: The authors.
Note: The proportions indicated by the bars refer to the percentage over all children aged 0 to 3 years (fictitious proportions for exemplification only). One hundred percent corresponds to all children in this age group. The INC comprises only a fraction of the children living in urban areas. The reasons are explained in the text.
FIGURE 1 Composition of the Daycare Need Index (methodology)
Families living in urban areas
While every child has the right to attend daycare, the INC does not cover children living in rural areas for the reasons listed in Bernardini, Kang and Wink Junior (2016). The prioritization criteria do not exclude daycare provision for children living in rural areas, whose right must be guaranteed, but instead define a minimum level of need based on urban areas.10
Poor families
Children from poor families are the most vulnerable. In general, these children are exposed to insecure environments in material, nutritional and emotional terms. In a study on early childhood programs for vulnerable children, Heckman and Masterov (2007) associate “low levels of financial resources” to adverse environments for child development.
There are several ways to define poverty, but because this work intends to inform public policy, we chose to use the Brazilian government’s official criterion - although there are valid discussions on what would be the best criterion for such a definition.11 Poor families were identified according to the standards of the Brasil Sem Miséria program. According to the Decree no. 7,492, of June 2, 2011 (BRASIL, 2011) which created the program, the extreme poverty line was set at BRL 70.00 (monthly per capita family income). As for the poverty line, its value is twice that of the extreme poverty line, i.e., BRL 140.00.12 These values were then updated according to the IBGE’s National Consumer Price Index (INPC).13
Single-parent families
Having included poor children in the group who needs daycare most, we move on to the second criterion - single-parent families. For the purposes of this paper, children from single-parent families were those who lived in households where there was only one person aged 18 years or older. As poor single-parent families have already been included according to the first criterion, it is necessary to estimate the number of non-poor single-parent families. In this case, if there are no daycare vacancies for them, the children may be left without care if their only caregiver needs to work. Vulnerability is related to single-parent families as it increases the likelihood of deterioration of the family environment (HECKMAN; MASTEROV, 2007).
Families with economically active mothers*
There are families who, though neither poor nor single-parented, require daycare because the mother or primary caregiver is actively engaged in the labor market. There are also those families in which the mother or primary caregiver is not engaged in the labor market precisely because there is no daycare available. These groups were also included in the present study.
It is worth highlighting some observations on this point, many of which have been explained in a previous work (BERNARDINI; KANG; WINK JUNIOR, 2016). First, this criterion is not limited to children whose mothers* are economically active, since it also includes those who would be economically active if there were accessible daycare centers for their children. Because of its counterfactual nature, this piece of information needs to be quantitatively estimated. In order to solve this problem, the proportion of mothers of children aged between 4 and 6 years who are economically active was estimated using the same procedure as that for economically active mothers of children aged between 0 and 3 years. Because preschool establishments (for children aged 4-6) are more numerous than daycare centers, significant differences in number between them indicate a lack of the latter; if these indicators are similar, we assume that there are no serious provision problems. This is an approximation, since no attendance is expected for children in their first months of life, particularly during the period of maternity leave. For this reason, there may be a slight overestimation under this criterion, but we believe that it is still a reasonable approximation to address the counterfactual problem.
Methodology steps
The methodology for calculating the Daycare Need Index by municipality involved the steps presented below.
Estimating the proportion of children aged between 0 and 3 years
First, we used the total population by municipality according to data from the IBGE’s population estimates (as validated by the Federal Court of Accounts) for 2018 and 2019, as well as IBGE state projections (updated in 2018).14 For the total population per municipality in 2020, we used a forecast according to the AiBi method, based on data for 2018 and 2019.15
Independently, we calculated the proportion of children aged between 0 and 4 years through the well-known Duchesne method (1987).16 Finally, the demographic indicators necessary for applying this method, such as fertility rates and survival ratios, were those published along with the above-mentioned state population projections.
Because we are interested in the population aged 0 to 3, we applied Sprague (1880) coefficients to the above results by age group in order to obtain the population by simple age. By applying the percentages by age group, obtained through the Duchesne and Sprague methods, to the municipal population totals, we arrive at the population aged 0 to 3 by municipality.
Estimating the proportion of children aged 0 to 3 years living in urban areas, with families under these subgroups: poor; non-poor and single-parented; non-poor and non-single-parented, whose mothers are economically active; and non-poor and non-single-parented, whose mothers are not economically active
For the total number of children living in urban areas and for the first three subgroups, estimates for 2018 to 2020 were obtained as follows. First, we collected municipal data from the 2010 Population Census. The evolution of municipal data is carried out with data for the state to which the municipality belongs, according to some editions of PNAD. The methodology is built in such manner because the characteristics of municipalities are only observable in population censuses, while the PNAD provides sample information for later years, but only at the state level. The last subgroup (children in non-poor and non-single-parent families whose mothers are not economically active) is obtained by residual. The goal is to estimate a growth trajectory of state data, in order to estimate the proportion of children living in urban areas and according to the four subgroups for the period 2018-2020.
There are several ways to fit a growth function from state data. In order to facilitate the implementation of public policy over time, it is important to ensure stability to the predicted data. For this reason, a time-dependent logarithmic function was chosen. Two reference points were used: based on state data from the PNAD 2009 and 2011 surveys, an interpolation was carried out, thus reaching state estimates for 2010; and based on data from the Continuous PNAD 2018, state data for 2018 were obtained. The growth trajectory is calculated from these two points by fitting a logarithmic function:
The y2010+t indicator concerns population estimates for children aged 0 to 3 years living in urban areas and also for the first three subgroups by state. Since y2010 and y2018 are known, we obtained parameters α and β. From this we obtained y2019 and y2020 by state. This growth trajectory is applied to the municipal results, thus reaching the municipal indicators for 2018, 2019 and 2020.
It is worth highlighting some observations:
First, in the cases of municipalities which reach values above 100% according to this methodology, we truncate the variable at 100%. This type of situation occurred 232 times in the estimates of urban populations for 2018 (about 4% of municipalities). Truncating the variable at a particular value is not a problem, since these municipalities certainly do not have, or practically do not have a population living in rural areas. It is not surprising that this number of Brazilian municipalities have zero rural population. For the estimates of poor urban populations, there were only three situations of truncation in 2018, and four in 2019 and 2020. These cases only show that these are municipalities with a high incidence of poverty.
In addition, in the case of economically active mothers*, this is actually the variable that identifies the primary caregiver in the 2010 Population Census - who may be a mother, father or another adult who takes care of the child. However, we actually used the economically active mother from the PNAD 2009 and 2011 surveys and from the Continuous PNAD 2018. Therefore, despite using census data on caregivers, the growth trajectory was obtained with information about mothers.
Estimating the Daycare Need Index by municipality for the period 2018-2020
With the population groups of interest defined as the age group from 0 to 3 years old, the index is formed as follows:
Where: INCi is the Daycare Need Index for the municipality; poori is the proportion of children living in urban areas, with poor families; singi corresponds to the proportion of children living in urban areas, with non-poor, single-parent families; eami refers to the proportion of children living in urban areas, with non-poor, non-single-parent families, whose mother or primary caregiver is economically active; and neami is the proportion of children living in urban areas, with non-poor, non-single-parent families, whose mother or primary caregiver is not engaged in the labor market.
In the case of poor and non-poor, single-parented children, it was considered that all children in such conditions must be included in the index. The coefficient µn is applied to eami and neami, while φn is applied to neami. These coefficients are obtained through information for each state n. Since we do not consider that all children in these conditions require daycare, µn ≤ 1 and φn ≤ 1.
Proportion of mothers* who are (or would be) economically active and who require daycare (µ)
To define the value of coefficients µn and φn, some criteria were used. In the case of mothers (or primary caregivers) who are (or would be) economically active, not all of them seek daycare for their children aged 0-3 years. Some seek family members or babysitters as an alternative, even where daycare centers are within reach and within their financial means. On the other hand, financial constraints can prevent children from receiving care, even among non-poor families.
In order to estimate the proportion of children in these conditions who need daycare, we chose to assess daycare attendance for children in the highest income quintile. We consider that these children face no restriction to attending daycare if their families so desire. Graph 1 presents daycare attendance data by income percentiles that are multiples of five (i.e., we observe data for the 5%, 10%, 15% percentiles, and so on). It is noted that attendance rates exceed the 50% mark and are relatively stable in the last four observations, i.e., the portion of the population whose income is above the 80% percentile. This suggests that this portion of children does not suffer from significant restrictions.
We then applied the percentage of children in the highest income quintile who are served by daycare centers (µ) to the total of mothers who are economically active (or would be so if there was daycare available). This procedure leads us to an estimate of the demand for daycare by mothers who are in the labor market under higher budget groups.
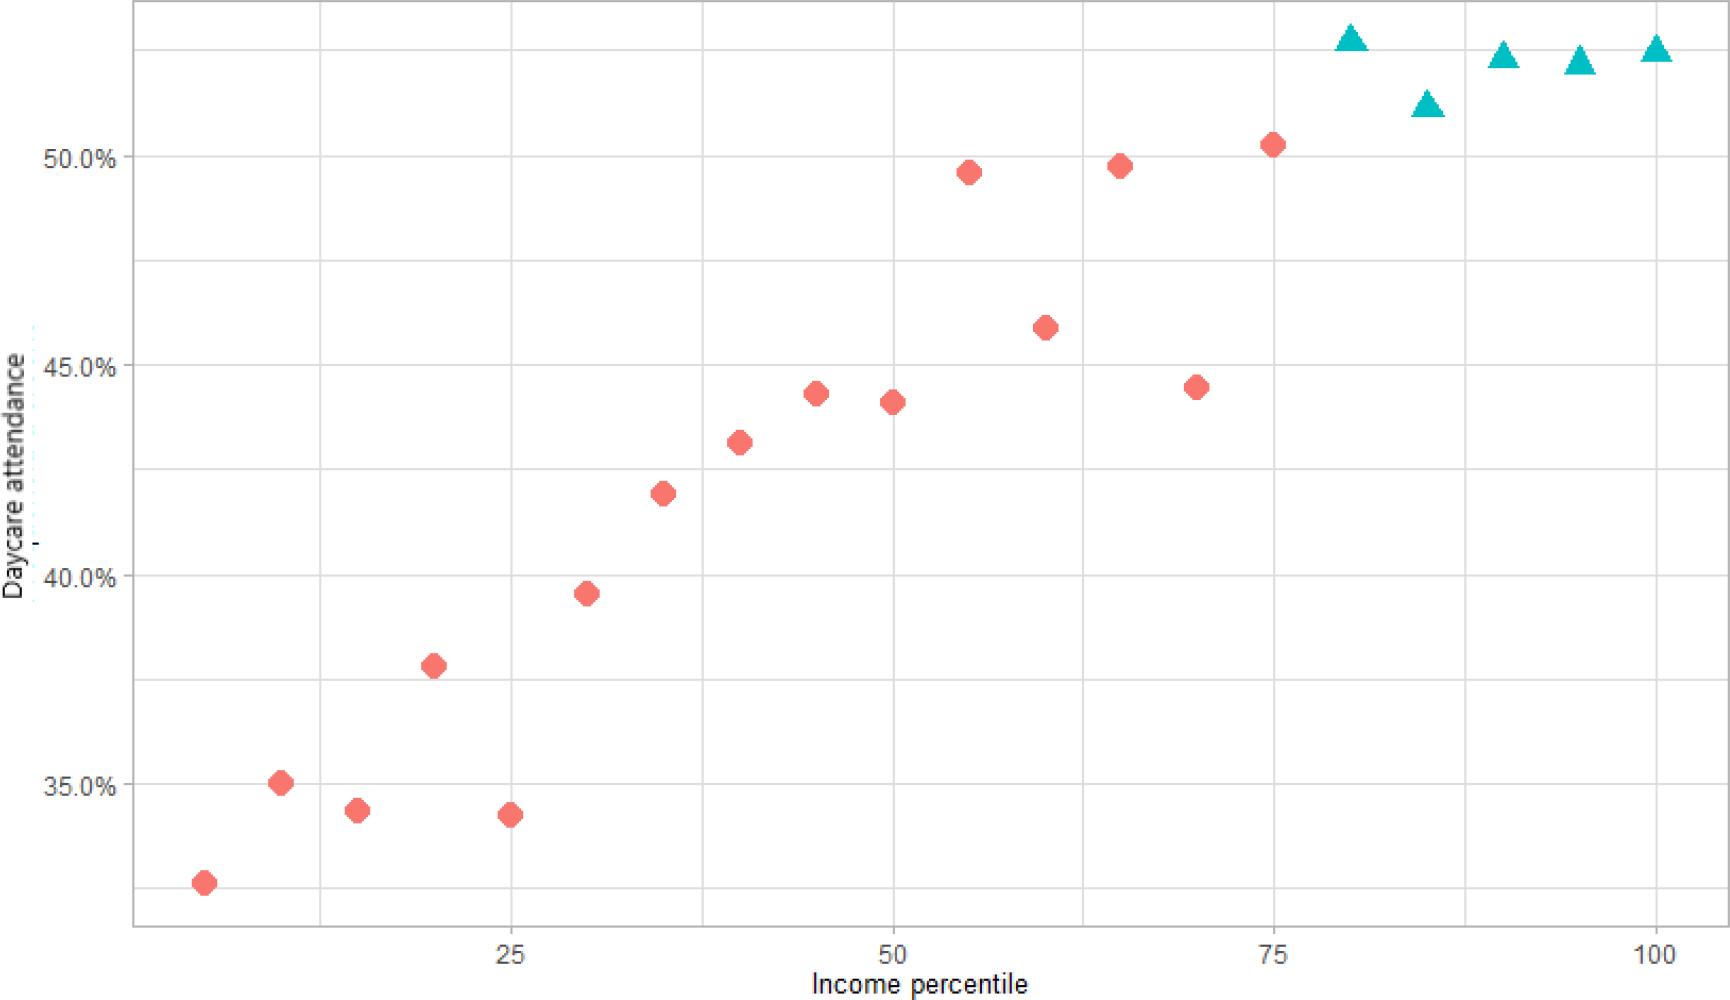
Source: IBGE. Continuous PNAD. Available at: https://www.ibge.gov.br/estatisticas/sociais/trabalho/9171-pesquisa-nacional-por-amostra-de-domicilios-continua-mensal.html?=&t=destaques. Access on: Oct., 2022.
GRAPH 1 Daycare attendance according to income percentile (multiples of five), Brazil, 2018
Proportion of mothers* who would be economically active if there was daycare available (φ)
Among the mothers who are not economically active, there are those who are not in the labor market only because they have no access to daycare. The goal here is to estimate the proportion of children aged between 0 and 3 years whose mothers or primary caregivers are in this situation. To do so, we used as an approximation the proportion of children in another age group (4 to 6 years old) who live in urban areas, with non-poor, non-single-parent families, and whose mothers* are economically active. Then, we rescaled that proportion to fit the demographic structure of the 0-3 age group (living in urban areas, non-poor, non-single-parented). Thus, if there is a greater proportion of economically active mothers* of children aged 4- 6 years than in the 0-3 age group, there is an indication that the lack of daycare is driving the mother or potential caregiver out of the workforce. When that does not occur, it is a sign that there is not a serious daycare provision problem.
RESULTS AND ANALYSIS
This chapter analyzes the results obtained through the methodology above. We start by presenting the INC results for 2018, 2019 and 2020. In the following subsection, we analyze the differentials between INC 2018 and daycare attendance rates according to the 2018 School Census.
Daycare Need Index, 2018-2020
The number of children requiring daycare in a state is simply the sum of the number of children requiring daycare in its municipalities. The same reasoning applies to the calculation of the national need index. It is not expected that 100% of children aged 0-3 are enrolled in daycare for these reasons: babies in their first months of life are still in the care of their mothers on maternity leave; and traveling with small children who live in remote rural areas may not be feasible.
Table 1 presents some aggregated data at the national level and by geographic region. The Daycare Need Index for Brazil indicates that 46.0% of children aged between 0 and 3 years required daycare in 2018. The numbers for 2019 and 2020 are similar: 46.4% and 46.7%, respectively.
TABLE 1 Components of the Daycare Need Index in terms of percentage of the population aged 0-3 years, by geographic region, Brazil, 2018-2020
| Region | 2018 | 2019 | 2020 | |||||||||||
|---|---|---|---|---|---|---|---|---|---|---|---|---|---|---|
| Poor | Sing | eam** | INC | Poor | Sing | eam** | INC | Poor | Sing | eam** | INC | |||
| (a) | (b) | (c) | (a+b+c) | (a) | (b) | (c) | (a+b+c) | (a) | (b) | (c) | (a+b+c) | |||
| North | 31.6 | 1.1 | 9.3 | 42.0 | 31.8 | 1.1 | 9.4 | 42.2 | 31.9 | 1.0 | 9.6 | 42.5 | ||
| Northeast | 29.6 | 2.0 | 12.6 | 44.2 | 29.7 | 2.0 | 12.8 | 44.5 | 29.8 | 1.9 | 13.0 | 44.7 | ||
| Southeast | 22.1 | 3.0 | 25.0 | 50.1 | 22.4 | 3.0 | 25.2 | 50.6 | 22.7 | 3.0 | 25.3 | 51.0 | ||
| South | 11.0 | 4.0 | 31.1 | 46.1 | 11.1 | 4.0 | 31.4 | 46.5 | 11.1 | 4.0 | 31.7 | 46.8 | ||
| Central-West | 12.5 | 4.1 | 21.2 | 37.8 | 12.4 | 4.1 | 21.7 | 38.2 | 12.3 | 4.1 | 22.1 | 38.5 | ||
| BRAZIL | 23.0 | 2.7 | 20.3 | 46.0 | 23.1 | 2.7 | 20.5 | 46.4 | 23.3 | 2.7 | 20.7 | 46.7 | ||
Source: Data from the study.
Note: Poor = poor children, Sing = children of single-parent families, EAM** = daycare demand of children whose mothers* are economically active and of children whose mothers* would be economically active if there was accessible daycare, INC = Daycare Need Index.
In the North and Northeast regions, the Daycare Need Index is mostly determined by the proportion of poor children. The situation is different in the richest regions. In the Southeast and South, the greatest portion of this index corresponds to the demand for daycare by families with economically active mothers*.17
We analyzed the information for 2018 in greater detail as that year allows for comparisons with enrollment data from the most recent edition of the School Census (the comparisons will be made in the next section). The analysis of data by UF shows that there is diversity in the index’s composition, the highest values being observed for the states of São Paulo (53.7%), Rio de Janeiro (52.1%) and Amazonas (52.0%), while the smallest values refer to Rondônia (29.5%), Piauí (30.5%) and Mato Grosso (30.7%). Table 2 presents data by INC component and UF.18
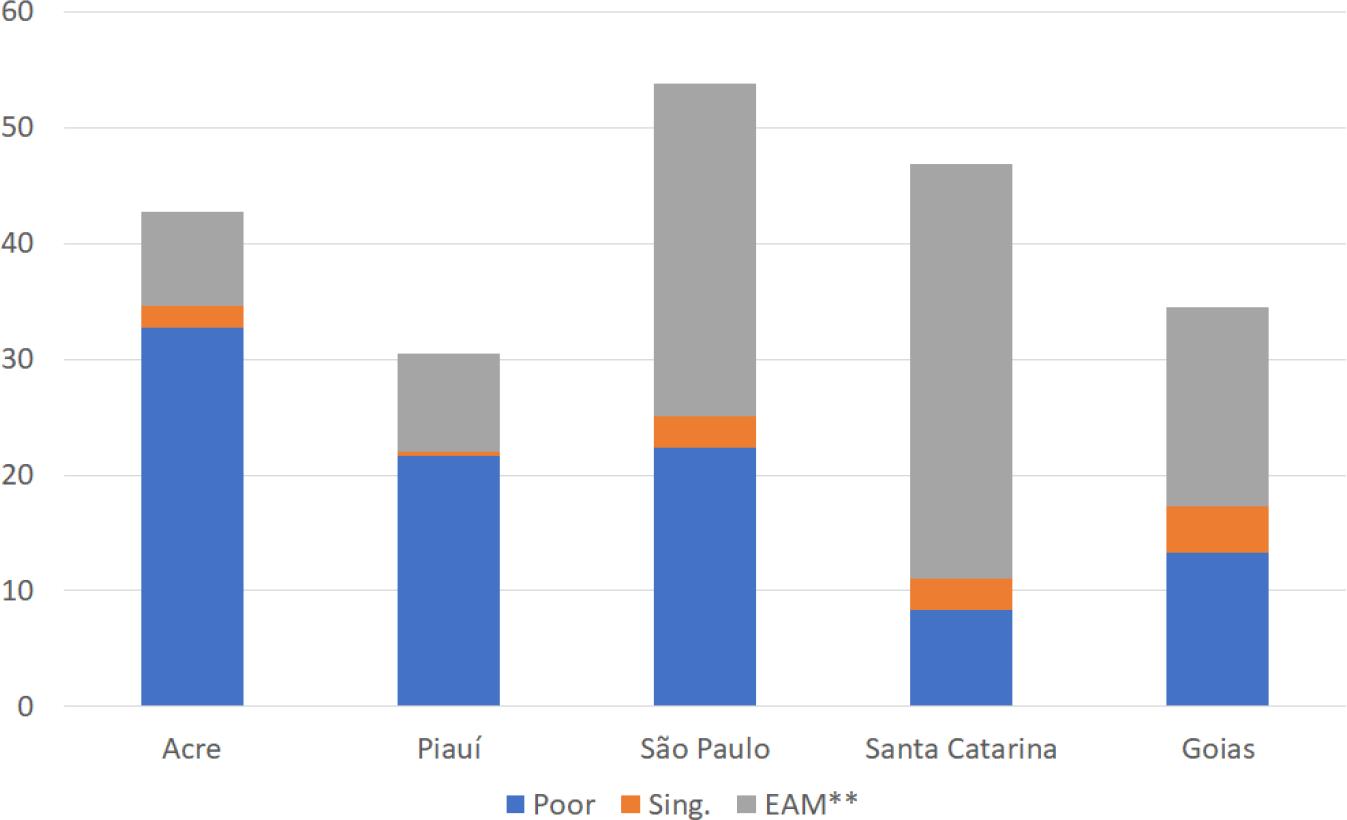
In Graph 2, we selected one state from each geographic region. In Acre, the INC is composed for the most part of poor families. In Piauí, the proportion of poor people is also significant, but the overall value is relatively low as it is the most rural state in the country. São Paulo has the country’s highest INC, but mainly because the group of children whose mothers* are (or would be) economically active is noticeably larger. Santa Catarina, in the South, has low poverty rates, which explains the small proportion of poor children in its index. The state of Goiás has a low index value and an intermediate composition.
We also analyzed Brazilian municipalities with more than 1 million inhabitants in 2018. Among them, Salvador has the highest INC (63.3% in 2018), followed by the municipalities of Maceió (59.0%), São Paulo (58.3 %), Recife (57.0%) and Manaus (56.9%). It is interesting to analyze comparatively the profiles of these municipalities according to INC 2018. While they all reached high levels in INC 2018, Graph 2 shows that there are clear differences between these municipalities with regard to index composition. In Maceió and Manaus, for example, much of the index is explained by the high child poverty rates in these municipalities. However, the results for São Paulo show a high index value, which is mostly related to the large number of economically active mothers* requiring daycare (or who would require it if daycare was available). The numbers do not change substantially for 2019 and 2020.
TABLE 2 Components of the Daycare Need Index in terms of percentage of the population aged 0-3 years, by geographic region and state, Brazil, 2018
| Region and state |
Poor | Sing | eam** | INC | Region and state |
Poor | Sing | eam** | INC |
|---|---|---|---|---|---|---|---|---|---|
| (a) | (b) | (c) | (a+b+c) | (a) | (b) | (c) | (a+b+c) | ||
| NORTH | 31.6 | 1.1 | 9.3 | 42.0 | Sergipe | 33.4 | 1.5 | 10.1 | 45.0 |
| Acre | 32.7 | 2.0 | 8.1 | 42.8 | CENTRAL-WEST | 12.5 | 4.1 | 21.2 | 37.8 |
| Amapá | 41.0 | 2.0 | 8.1 | 51.1 | Distrito Federal | 12.6 | 7.8 | 27.9 | 48.4 |
| Amazonas | 43.6 | 0.6 | 7.8 | 52.0 | Goiás | 13.3 | 4.0 | 17.2 | 34.5 |
| Pará | 27.5 | 0.9 | 8.4 | 36.7 | Mato Grosso do Sul | 14.2 | 4.4 | 26.2 | 44.9 |
| Roraima | 28.1 | 2.4 | 16.8 | 47.3 | Mato Grosso | 9.6 | 1.5 | 19.7 | 30.7 |
| Rondônia | 16.8 | 1.5 | 11.3 | 29.5 | SOUTHEAST | 22.1 | 3.0 | 25.0 | 50.1 |
| Tocantins | 27.4 | 2.2 | 15.1 | 44.7 | Espírito Santo | 22.5 | 2.4 | 23.6 | 48.5 |
| Northeast | 29.6 | 2.0 | 12.6 | 44.2 | Minas Gerais | 16.0 | 3.2 | 21.4 | 40.6 |
| Alagoas | 38.8 | 1.3 | 9.0 | 49.1 | Rio de Janeiro | 28.4 | 4.0 | 19.7 | 52.1 |
| Bahia | 32.3 | 2.8 | 14.7 | 49.8 | São Paulo | 22.3 | 2.7 | 28.7 | 53.7 |
| Ceará | 26.4 | 2.7 | 14.0 | 43.1 | SOUTH | 11.0 | 4.0 | 31.1 | 46.1 |
| Maranhão | 28.9 | 1.1 | 9.3 | 39.3 | Rio Grande do Sul | 11.3 | 3.6 | 32.6 | 47.5 |
| Rio Grande do Norte | 21.1 | 1.4 | 13.4 | 35.9 | Paraná | 12.4 | 5.0 | 26.9 | 44.3 |
| Paraíba | 27.3 | 0.9 | 12.7 | 40.8 | Santa Catarina | 8.4 | 2.7 | 35.8 | 46.9 |
| Pernambuco | 31.7 | 2.6 | 13.8 | 48.1 | BRAZIL | 23.0 | 2.7 | 20.3 | 46.0 |
| Piauí | 21.7 | 0.4 | 8.5 | 30.5 |
Source: Data from the study.
Note: Poor = poor children, Sing = children of single-parent families, EAM** = daycare demand of children whose mothers* are economically active and of children whose mothers* would be economically active if there was accessible daycare, INC = Daycare Need Index.
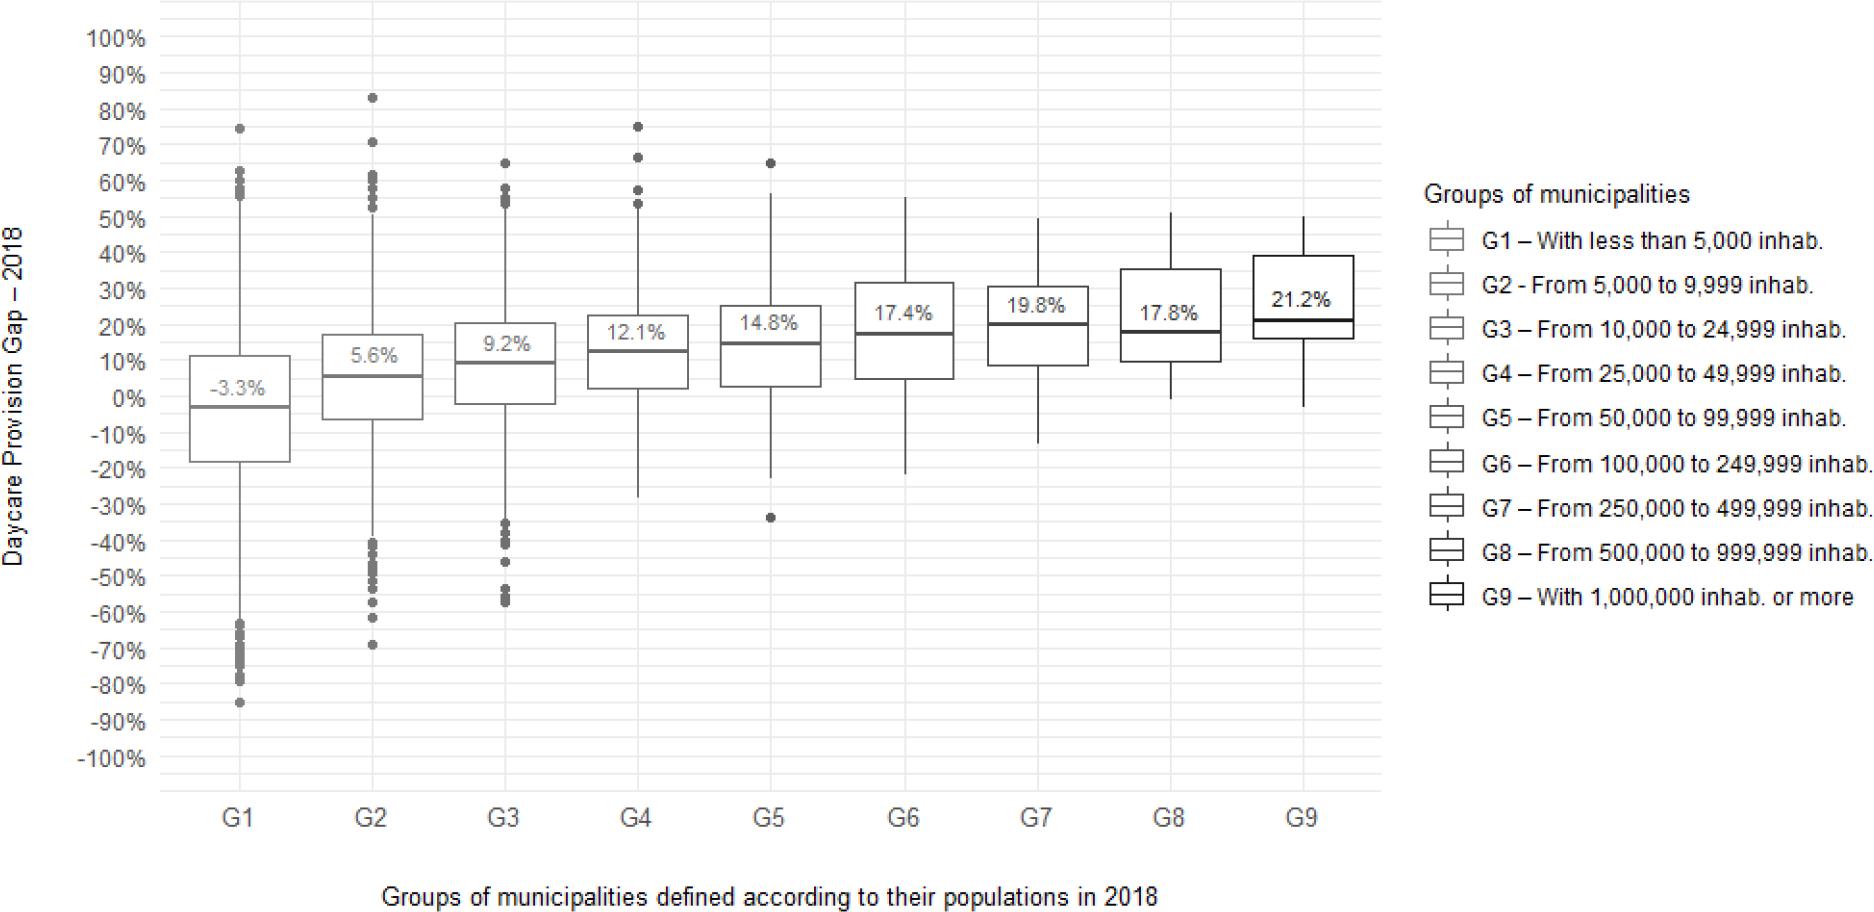
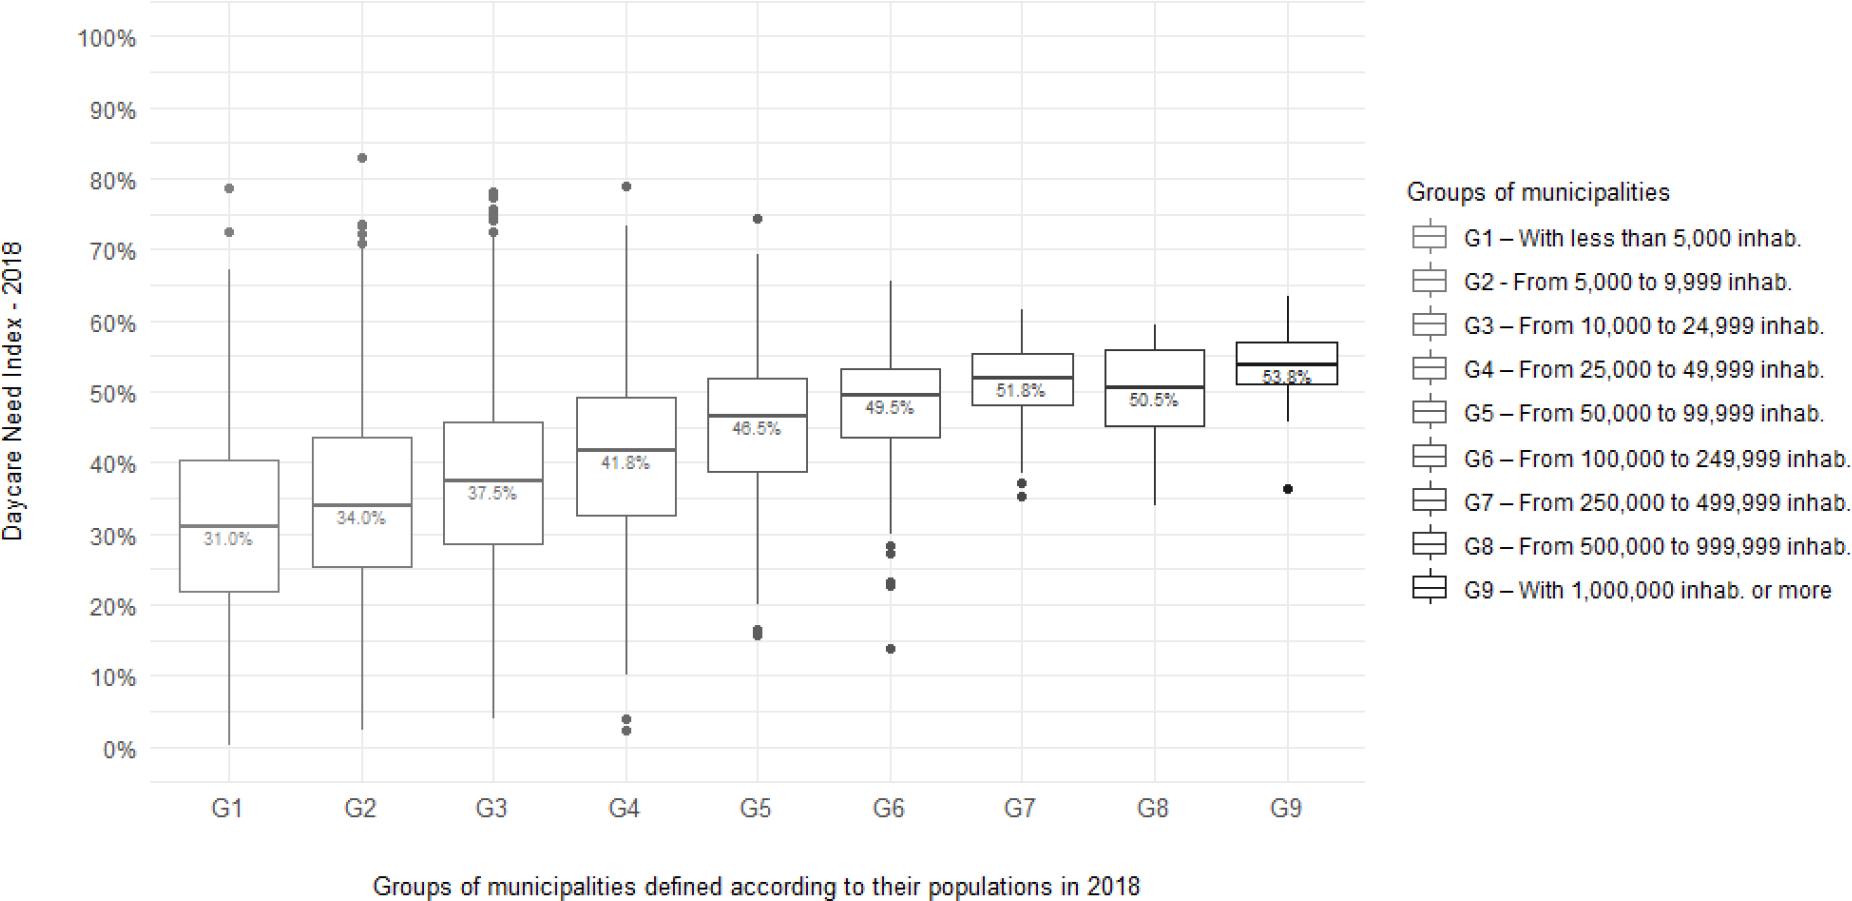
Figure 2 presents information on the need for daycare by group of municipalities defined according to population data. The information is presented in box plots, which provide information on the distribution of each group. The numbers presented as labels are the medians.19 The municipalities were divided into nine groups, starting with the group of municipalities with less than 5,000 inhabitants until the last group, formed by municipalities with more than 1 million inhabitants. It is noted that in general the median INC grows as the population increases. In smaller municipalities (with less than 5,000 inhabitants), the median INC is 31.0%, while in municipalities with 1 million inhabitants or more, the median INC is 53.8% in 2018.
Source: Data from the study.
Note: Poor = poor children, Sing = children of single-parent families, EAM** = daycare demand of children whose mothers* are economically active and of children whose mothers* would be economically active if there was accessible daycare.
GRAPH 2 Composition of the Daycare Need Index in terms of percentage of the population aged 0-3 years for selected states in each geographic region, 2018
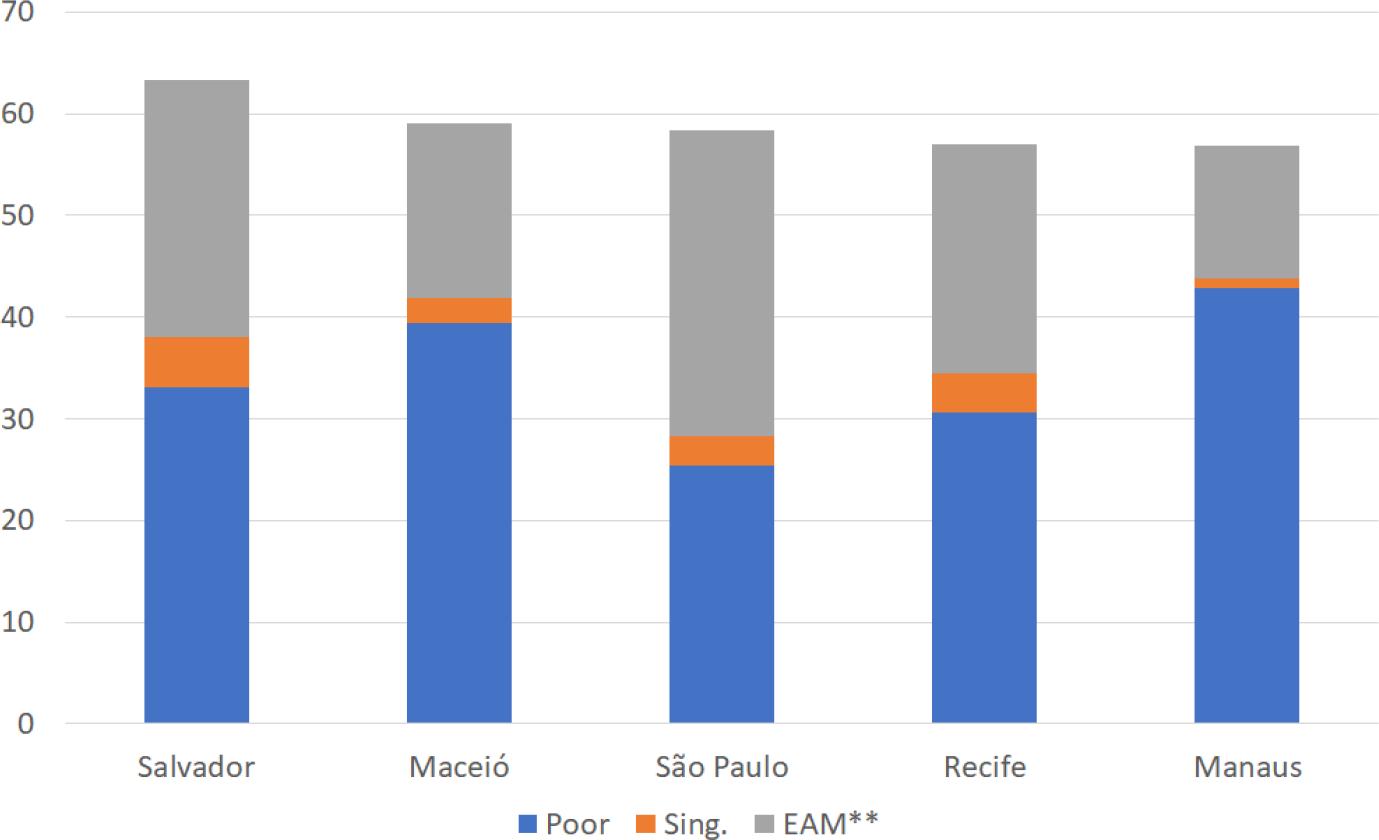
Source: Data from the study.
Note: Poor = poor children, Sing = children of single-parent families, EAM** = daycare demand of children whose mothers* are economically active and of children whose mothers* would be economically active if there was accessible daycare.
GRAPH 3 Composition of the Daycare Need Index in terms of percentage of the population aged 0-3 years for the five municipalities with the greatest index values among those with more than 1 million inhabitants, 2018
Source: Data from the study.
FIGURE 2 Box plot of the Daycare Need Index for Brazilian municipalities in 2018, by group of municipalities defined according to their population in 2018
Source: Data from the study and Continuous PNAD.
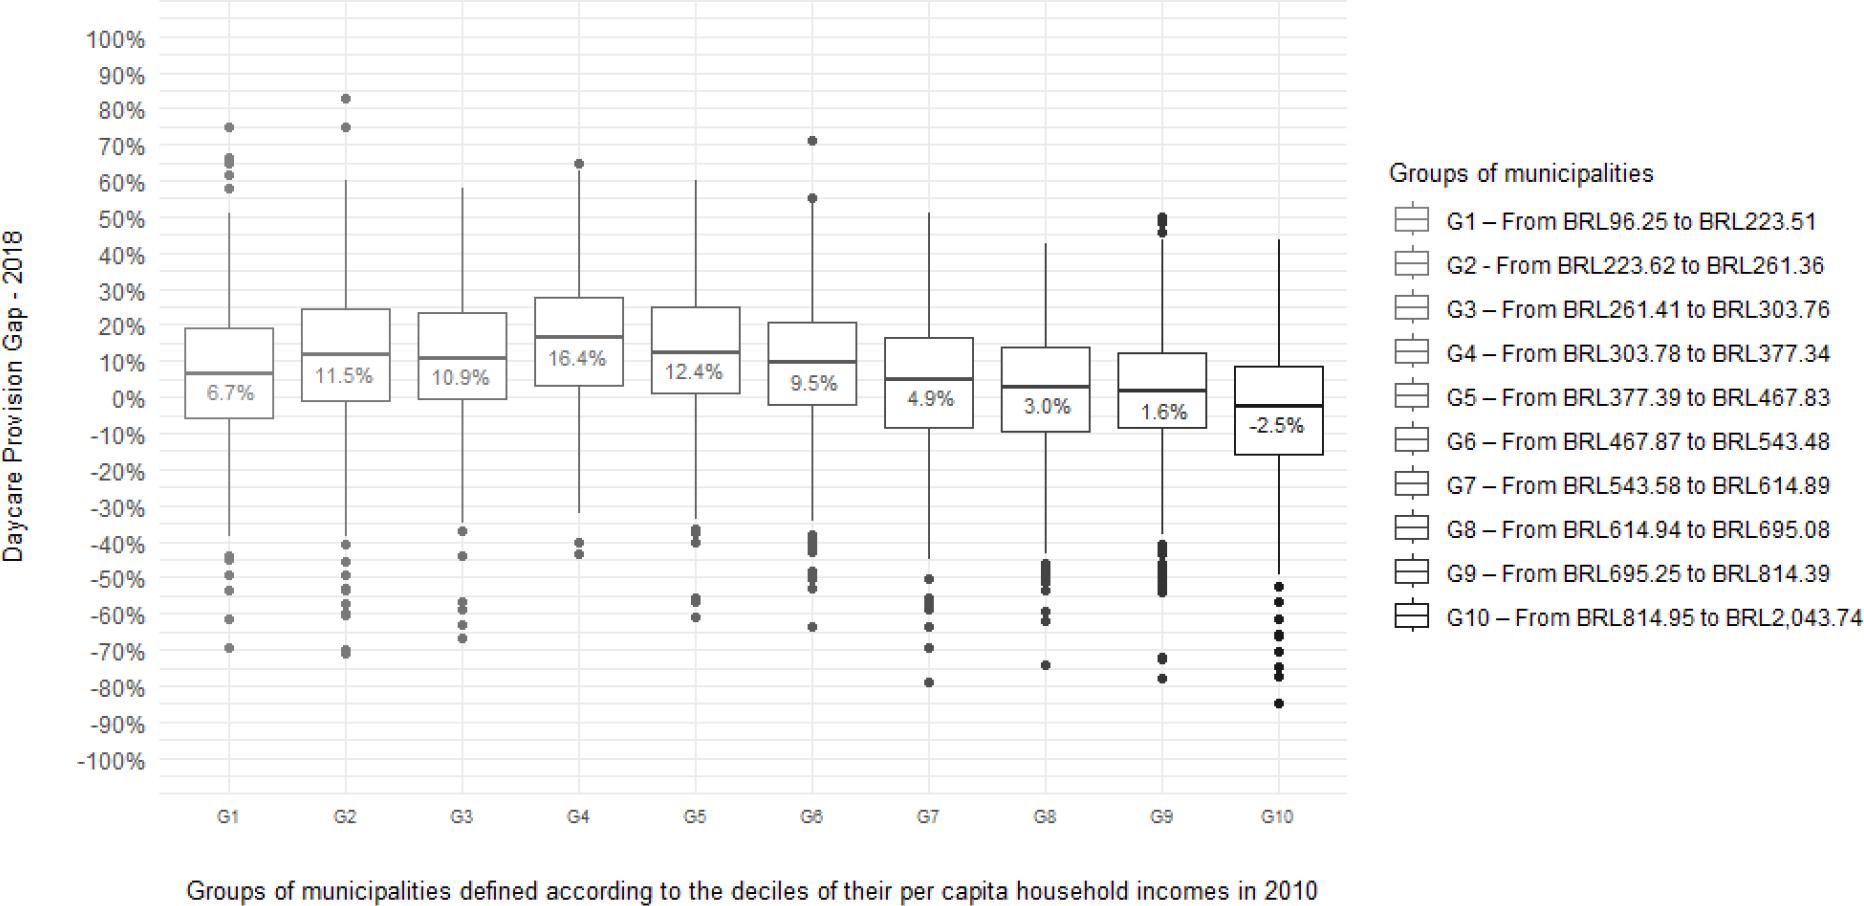
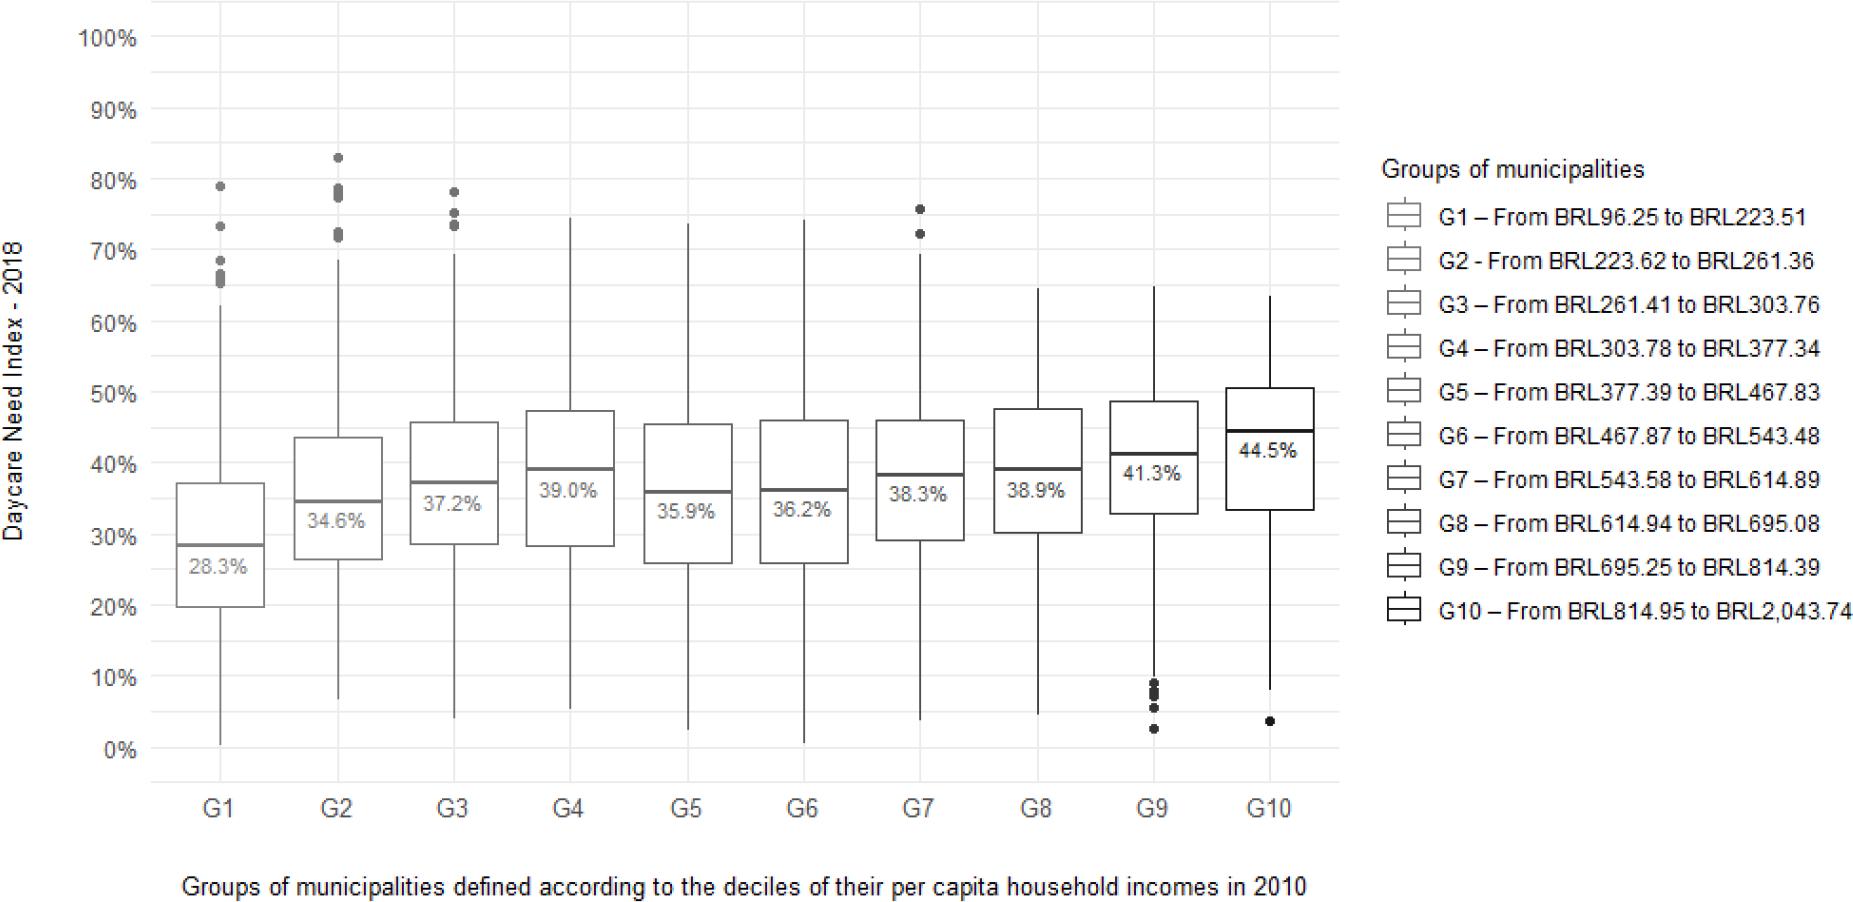
FIGURE 3 Box plot of the Daycare Need Index for Brazilian municipalities in 2018, by group of municipalities defined according to the deciles of their per capita household income in 2010
Source: Data from the study and IDHM.
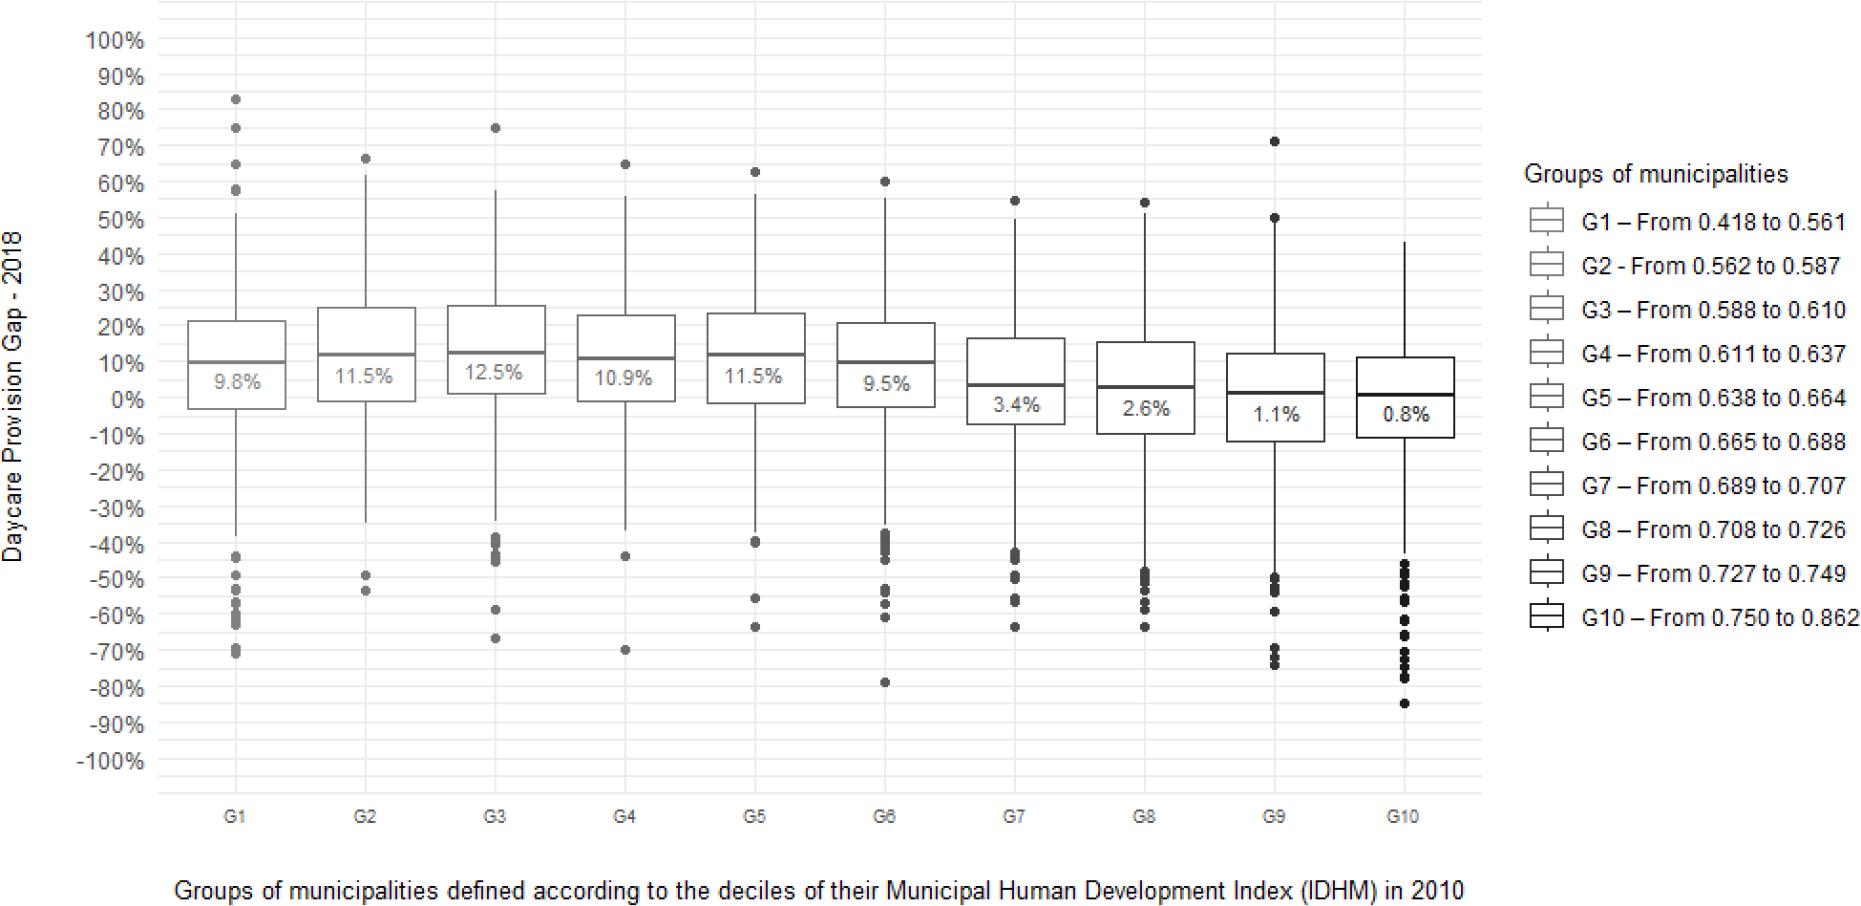
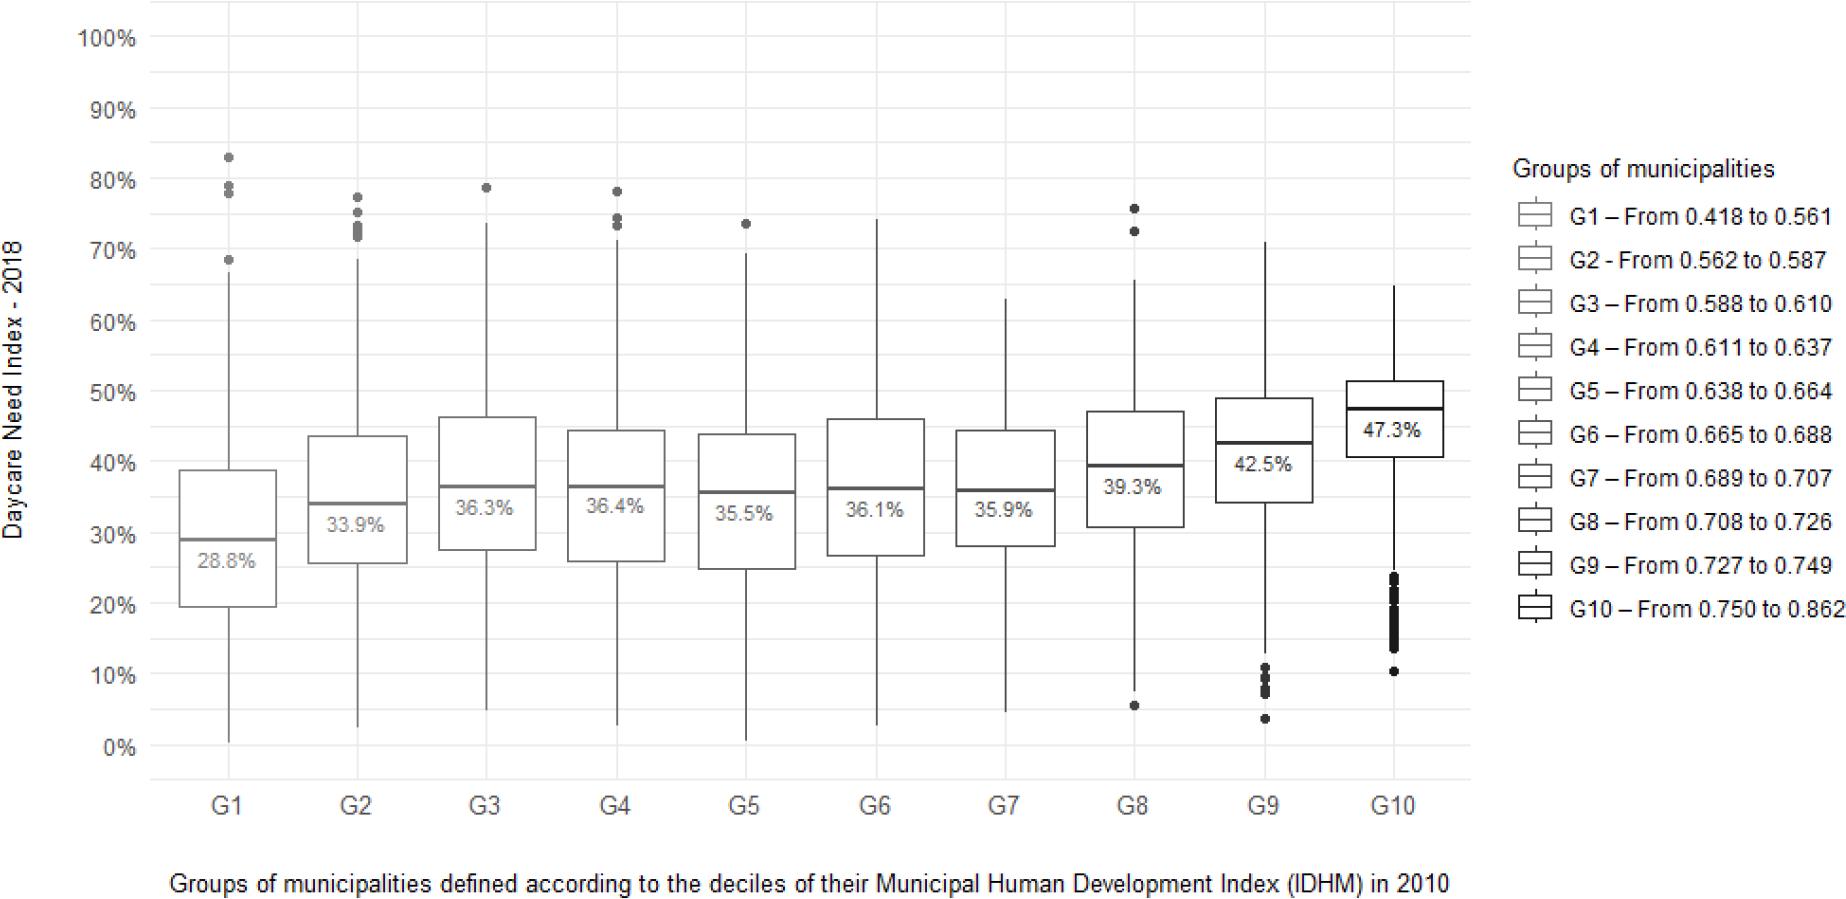
FIGURE 4 Box plot of the Daycare Need Index for Brazilian municipalities in 2018, by group of municipalities defined according to the deciles of their Municipal Human Development Index (IDHM) in 2010
A similar analysis was performed, dividing municipalities into groups according to other variables. Figure 3 relates INC 2018 to groups of municipalities according to their level of per capita household income in 2010. Although the pattern is not so clear for the intermediate groups of income per person, here too the richer municipalities (groups G9 and G10) have higher index values than the others. The opposite occurs with the municipalities in the two poorest groups (G1 and G2). A third criterion shows the relationship between INC 2018 and groups of municipalities according to their 2010 Municipal Human Development Index (IDHM). This information is presented in Figure 4. It is worth noting that the MHDI is a compound index that contains income, longevity and education indicators. The pattern shown in Figure 4 is not very different from that observed in Figure 3, which is not surprising given the correlation between per capita income and IDHM.20
Although the index also takes child poverty into account, Figures 2, 3 and 4 show that, in general, larger and more developed municipalities have a greater need for daycare. This is probably because women’s participation in the workforce tends to be greater in municipalities with a greater population, per capita income and IDHM.
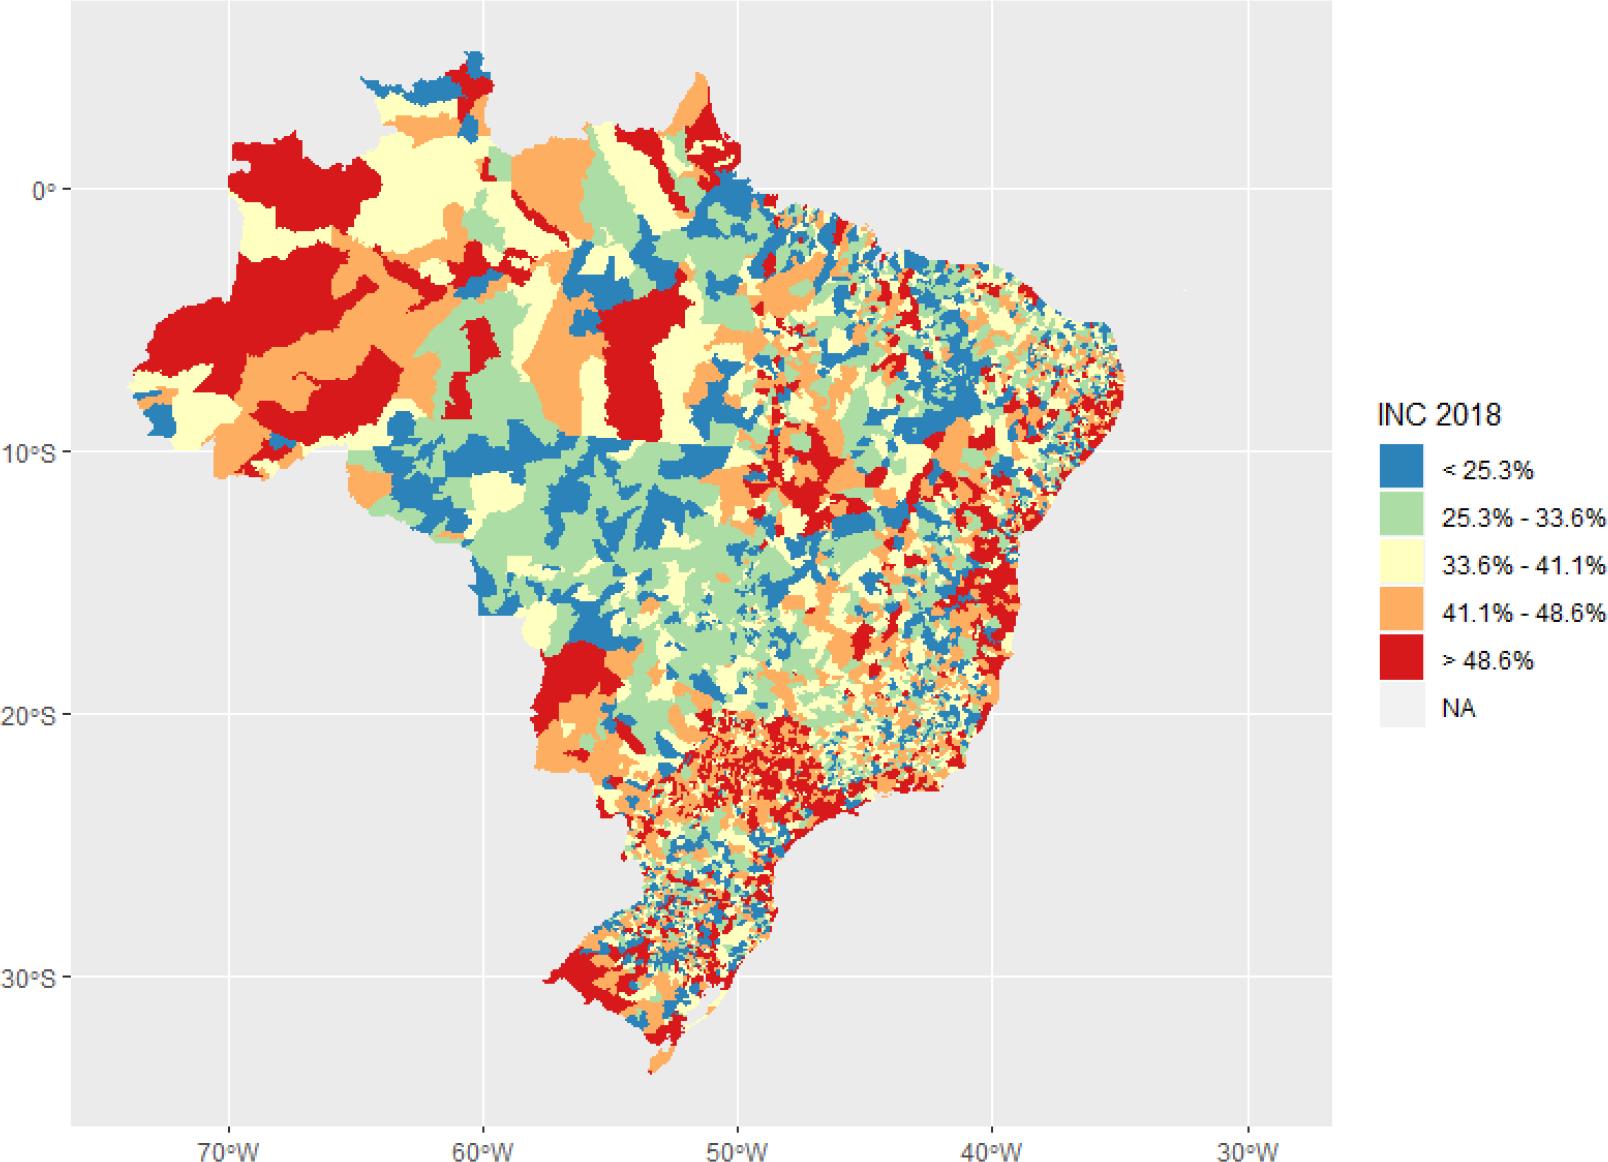
Figure 5 shows the INC 2018 results for all municipalities in the country. From an initial analysis, not much can be said about geographic patterns. INC levels vary significantly within states. This is because both high-poverty municipalities and urban municipalities with a large number of mothers* in the workforce tend to have a high INC, as already seen in the results by UF. In addition, municipalities with a significant rural population, albeit poor, have low INC values. This explains the lack of a clear geographic pattern on the map shown in Figure 5.
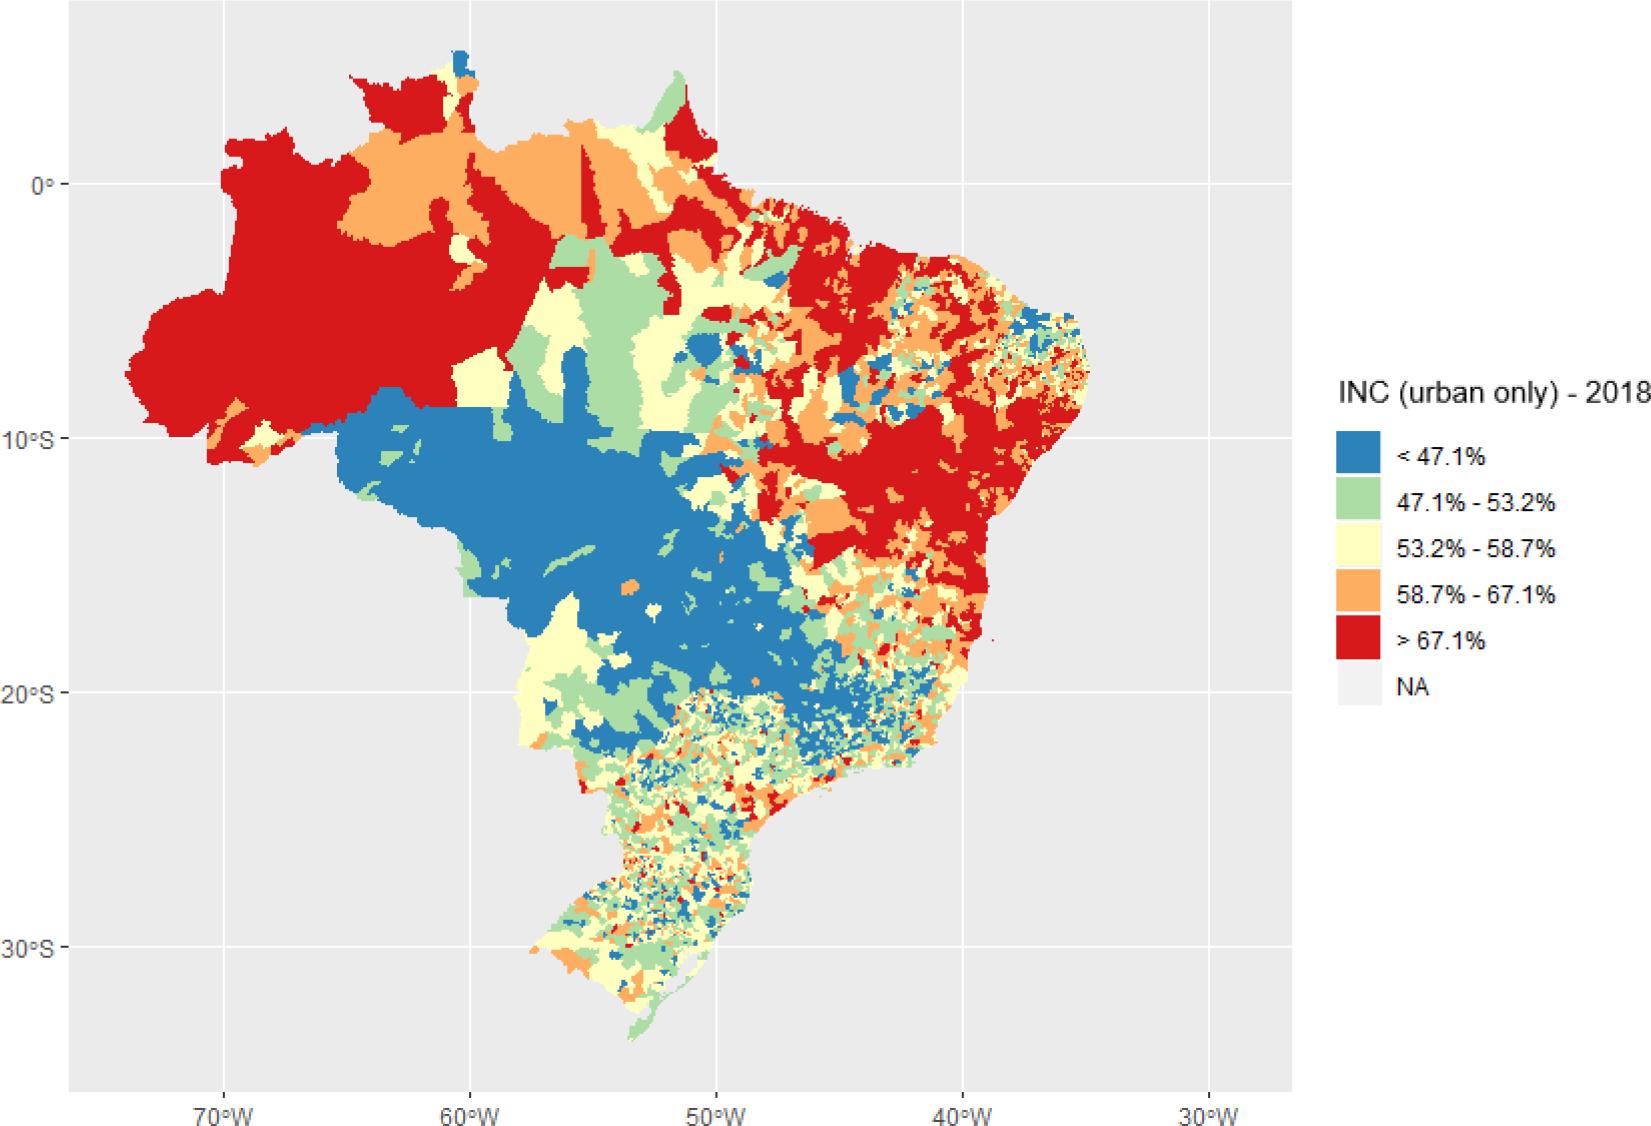
An alternative possibility of analysis is to calculate an INC considering only the population of children living in urban areas in the denominator. This increases the value of the index for all municipalities, but the larger the rural population in a municipality, the more significant the increase in its index value. Figure 6 presents the map with this information, which results in a more evident pattern. In general, the lowest index values are in the Central-West region and crossing into the Southeast, while the highest ones are in the North and Northeast regions.
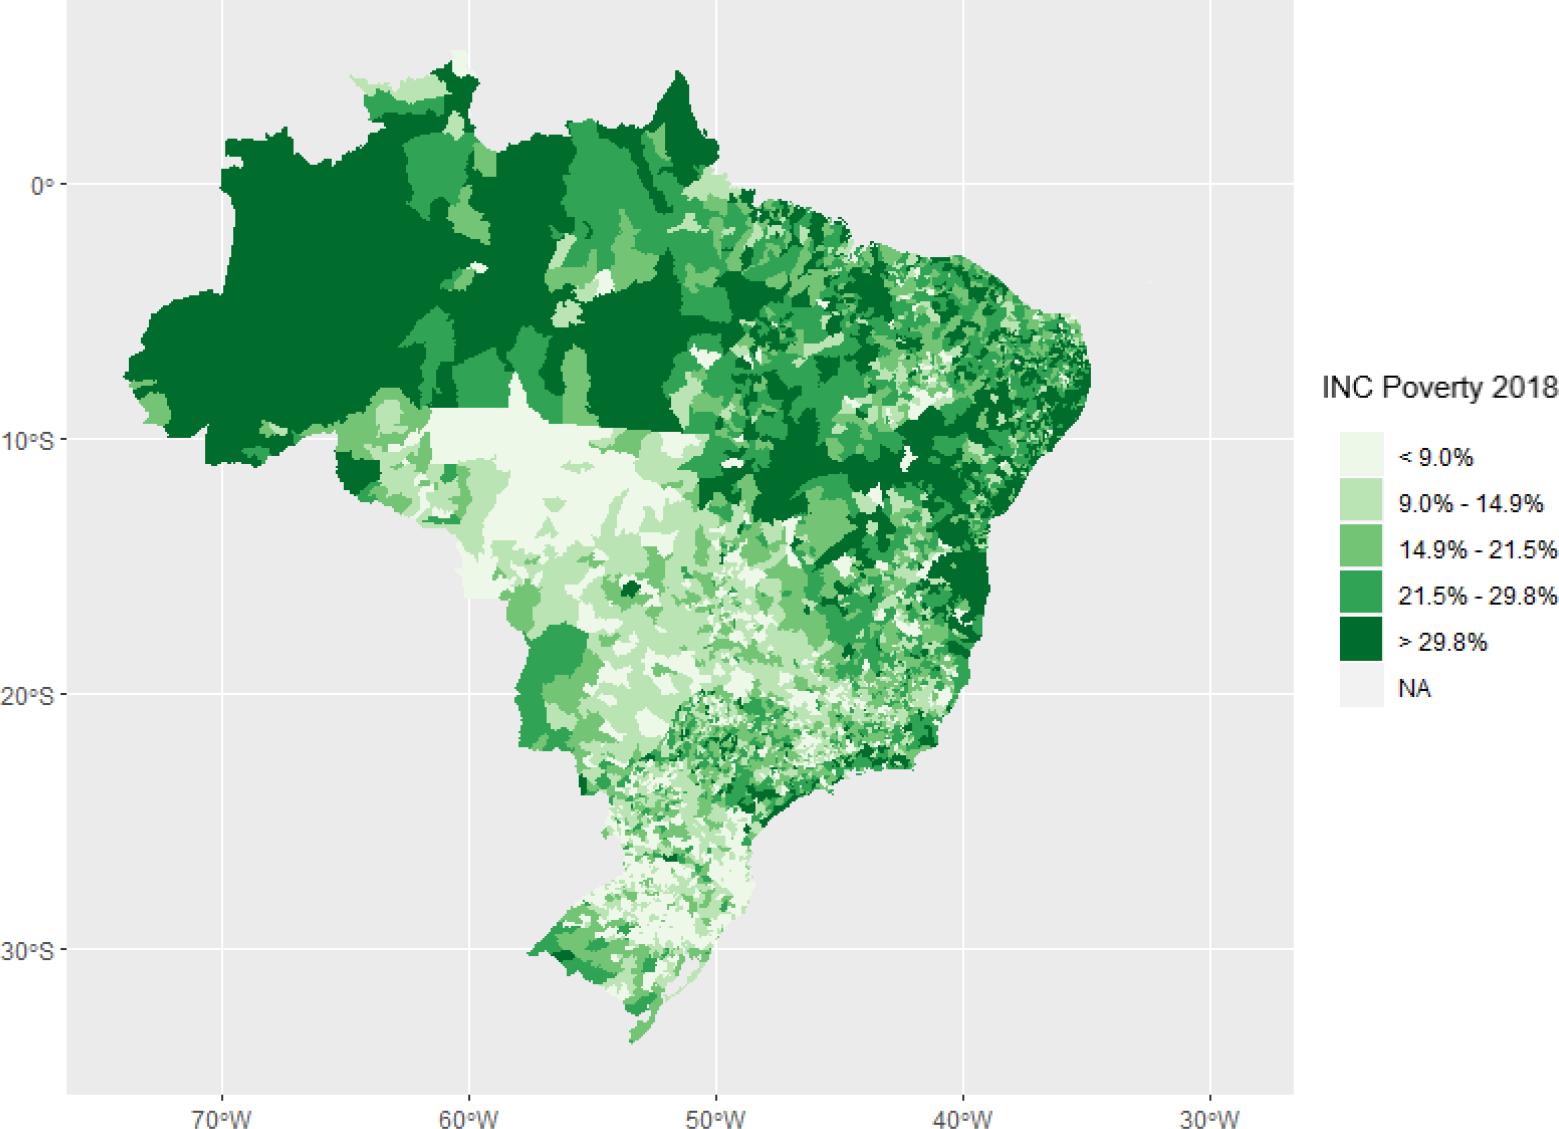
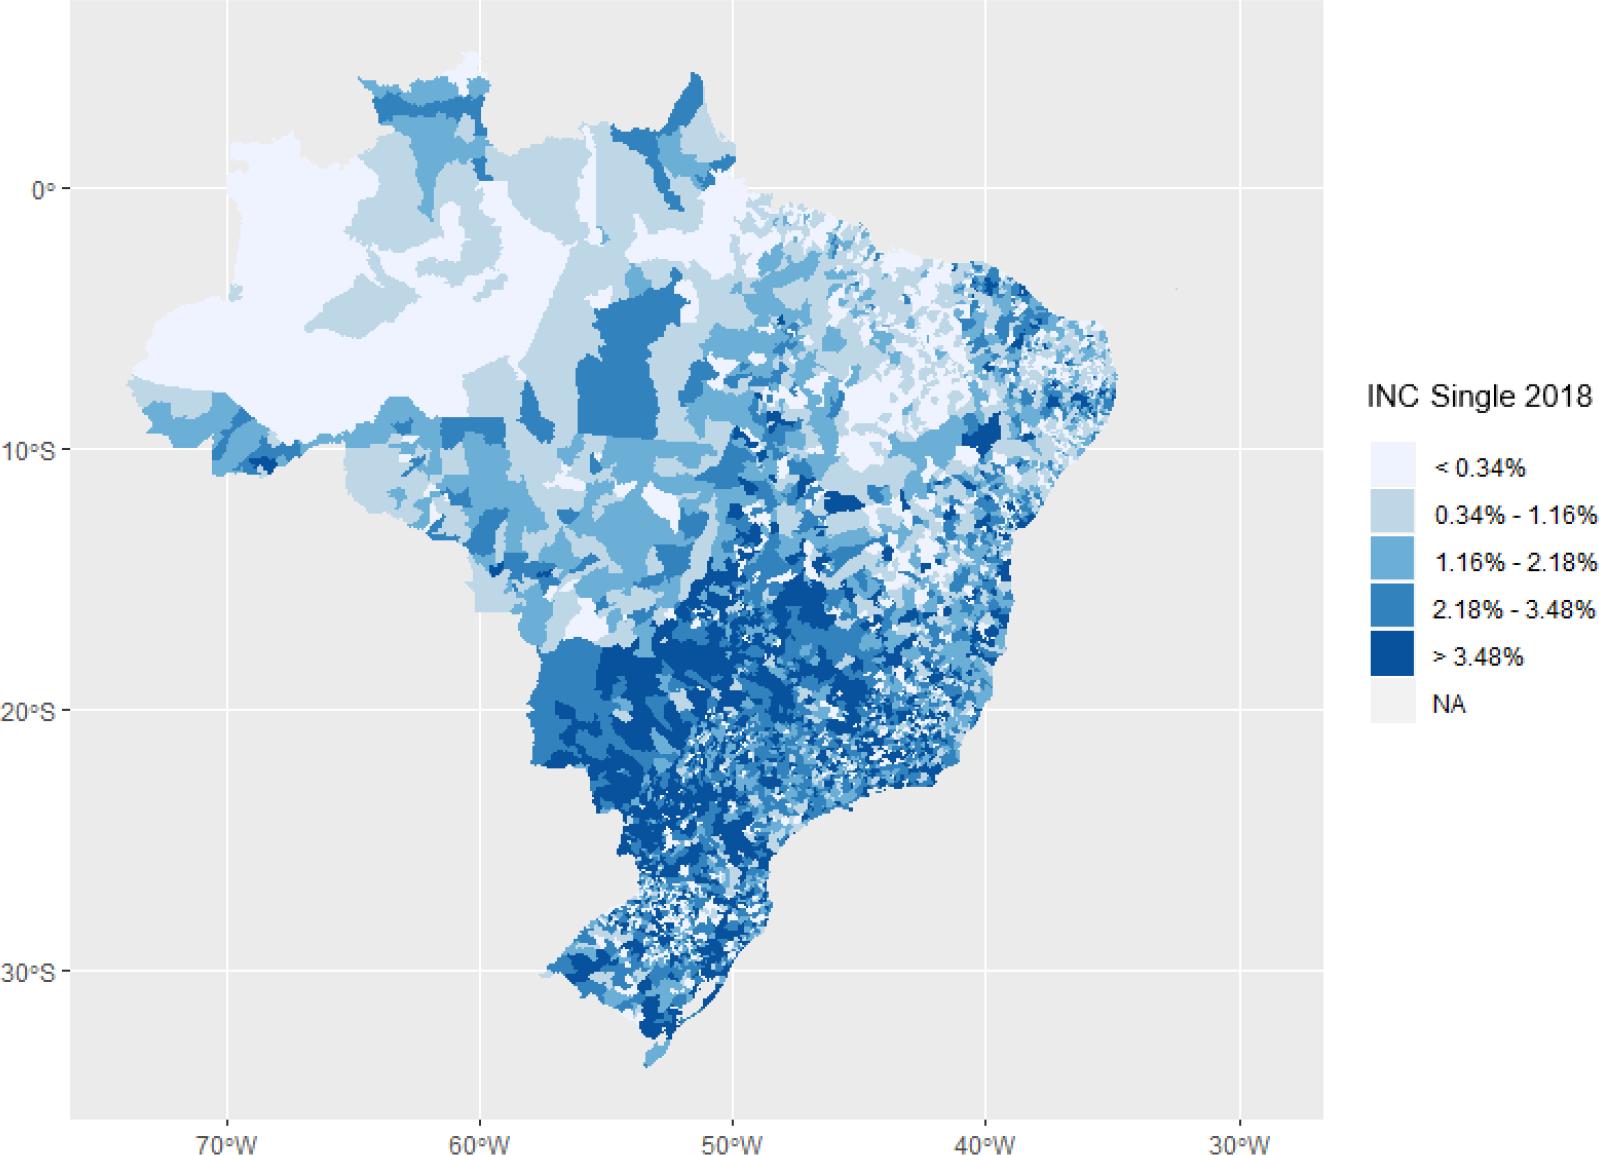
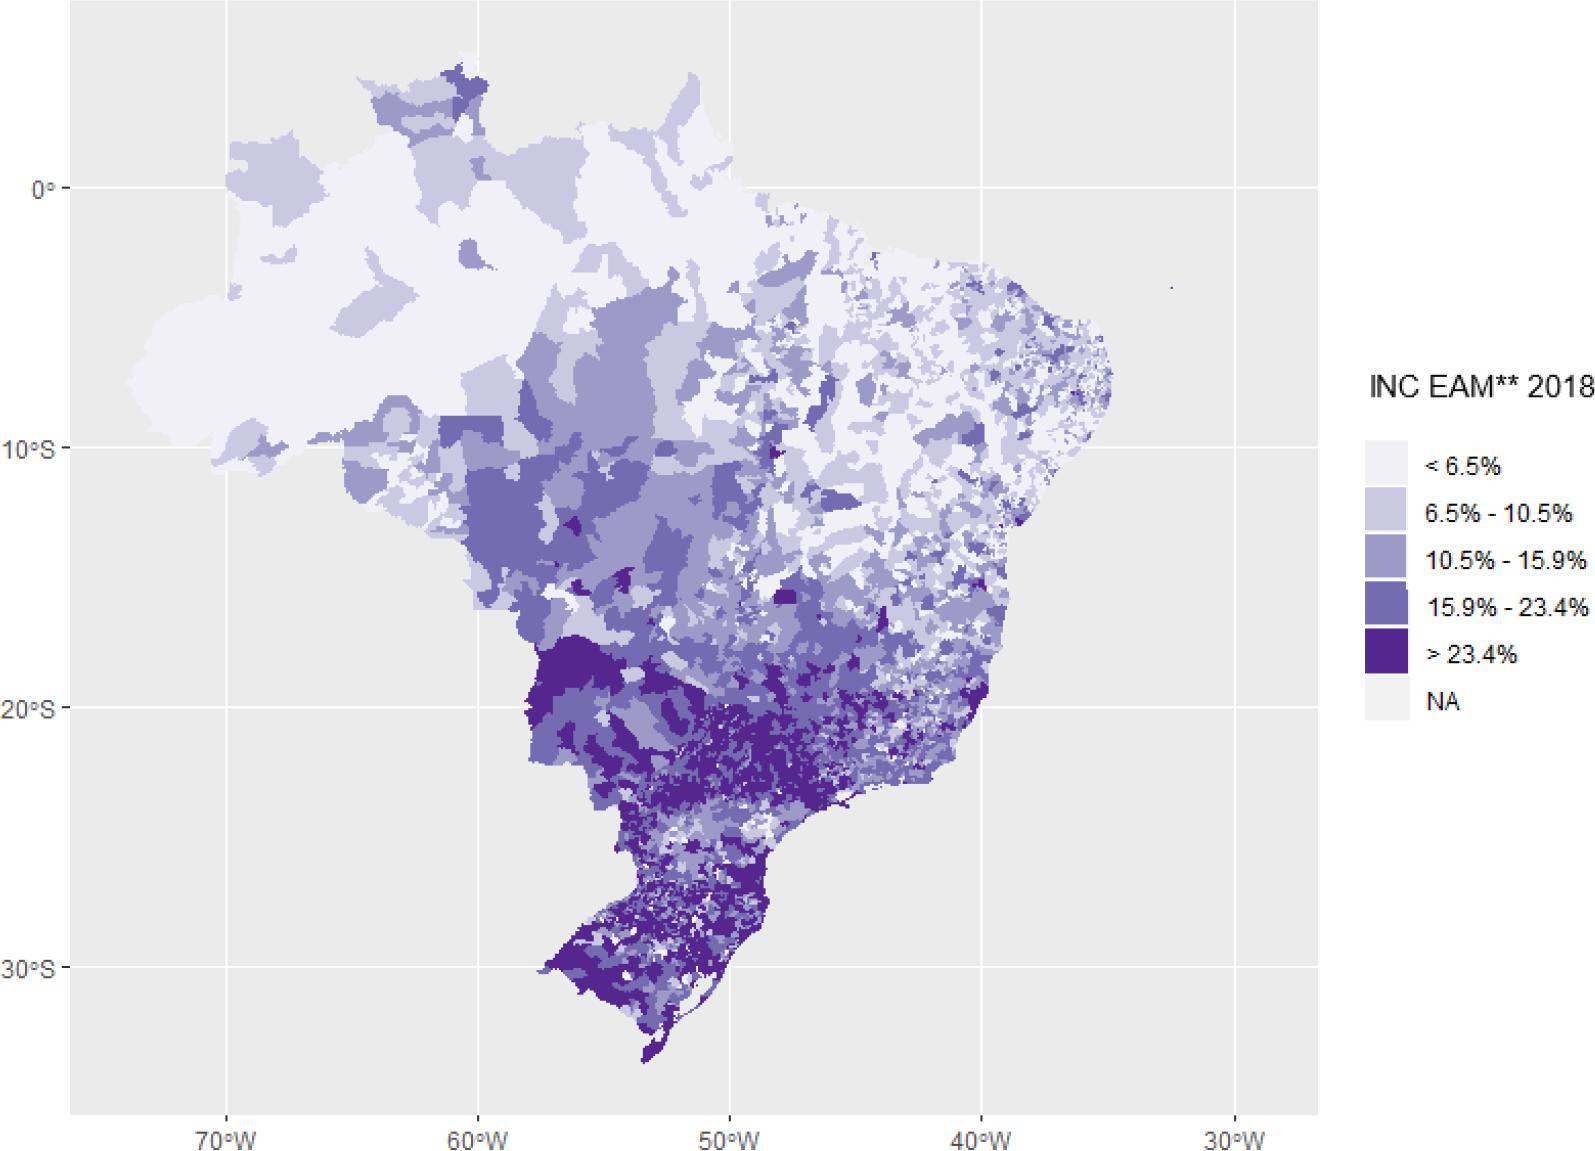
Finally, figures 7, 8 and 9 present maps separating the INC components. In Figure 7, the map shows only the poverty component of INC 2018. Undoubtedly, municipalities in the North and Northeast regions have higher poverty indicators. Figures 8 and 9, however, exhibit an opposite pattern. Figure 8 shows the component referring to children of non-poor, single-parent families, while Figure 9 contains information about children whose mothers* are economically active or would be so if daycare was available. In these two aspects, the states in the Central-West and Southeast have higher indicators, since both single parenthood and greater participation of women in the workforce are associated with higher income and urbanization levels. These maps also help to explain the lack of a clearer geographic pattern in the full INC map (Figure 5).
Source: Data from the study.
FIGURE 6 Daycare need as a proportion of urban populations only, municipalities, Brazil, 2018
Source: Data from the study.
FIGURE 7 The poverty component in the Daycare Need Index by municipality, Brazil, 2018
Source: Data from the study.
FIGURE 8 The single-parent-families component in the Daycare Need Index by municipality, Brazil, 2018
Differentials between INC and daycare provision rate in 2018
With enrollment data from the 2018 School Census and population estimates, daycare enrollment rates can be estimated and compared with INC 2018. In the year in question, 30.2% of children aged between 0 and 3 years were enrolled in daycare in Brazil. These provision rates range from 6.1% in Amapá to 46.6% in Santa Catarina. It should be considered that the school census enrollment data were organized according to the address of daycare centers. This seems not to be a serious limitation, particularly when it comes to children aged 0 to 3 years. While there are obviously exceptions, it is not expected that families travel long distances to their leave children in daycare centers located in neighboring municipalities.
As said earlier, the Daycare Need Index for Brazil indicates that 46.0% of children aged between 0 and 3 years needed daycare in the country in 2018. This means that the gap between the daycare provision rate and the INC was 15.9 percentage points.
Table 3 presents data by federative unit regarding daycare provision rate, INC, and the gap between INC and provision rate. The data were arranged in descending order according to the gap. The greatest INC-provision rate differentials are in states of the North region: Amapá (45.0%), Amazonas (42.7%) and Roraima (32.5%). In turn, the smallest differentials were recorded in the states of Mato Grosso (-0.1%), Santa Catarina (0.3%) and Piauí (4.2%).
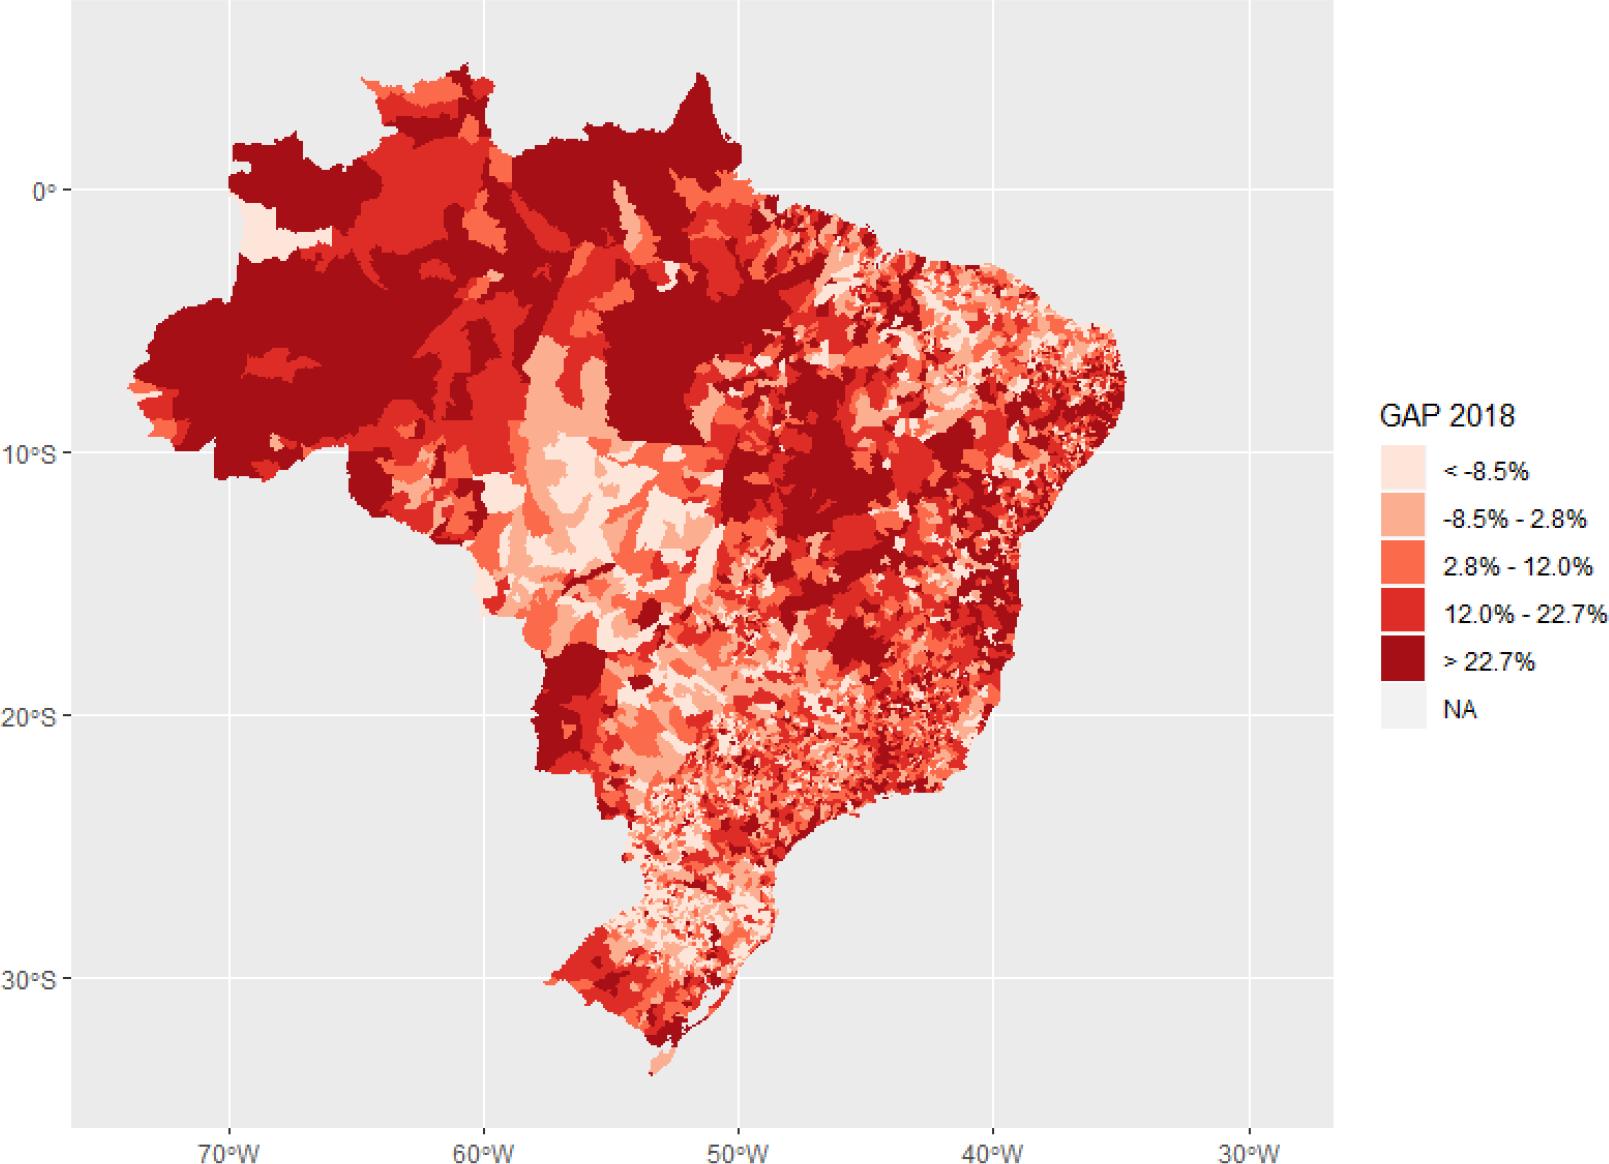
There are clearer geographic patterns which emerge from the map of INC-provision rate gaps. Figure 10 shows that there are noticeably greater gaps in municipalities of the North region. However, the low population density and the territorial extension of municipalities in this region should be taken into account. In any case, the gaps are larger in general in the northernmost municipalities vis-à-vis those located further south in the country. Some other geographic areas stand out, such as the coast from the Southeast to the Northeast, some inland points in the Northeast, and some poorer areas in Rio Grande do Sul and Mato Grosso do Sul. Regardless of these patterns, Figure 10 shows that there are also significant inequalities of differentials within states. This shows that priority should not be limited to the North and Northeast regions, since there are high differentials in specific areas of states with low differentials on average.
Source: Data from the study.
FIGURE 10 Differentials between INC and daycare enrollment rate by municipality, Brazil, 2018
TABLE 3 Daycare provision rate, Daycare Need Index (INC) and differential between provision rate and INC by UF, Brazil
| UFs | Daycare provision rate 2018 (a) | INC 2018 (b) | Differential between provision and INC 2018 |
|---|---|---|---|
| (b - a) | |||
| Amapá | 6.1 | 51.1 | 45.0 |
| Amazonas | 9.3 | 52.0 | 42.7 |
| Roraima | 14.8 | 47.3 | 32.5 |
| Pernambuco | 18.9 | 48.1 | 29.2 |
| Distrito Federal | 19.2 | 48.4 | 29.2 |
| Sergipe | 17.1 | 45.0 | 27.9 |
| Bahia | 22.2 | 49.8 | 27.6 |
| Alagoas | 22.9 | 49.1 | 26.2 |
| Acre | 17.4 | 42.8 | 25.4 |
| Rio de Janeiro | 27.7 | 52.1 | 24.4 |
| Pará | 13.1 | 36.7 | 23.7 |
| Tocantins | 23.5 | 44.7 | 21.2 |
| Rondônia | 10.8 | 29.5 | 18.8 |
| Paraíba | 23.4 | 40.8 | 17.4 |
| Espírito Santo | 32.1 | 48.5 | 16.4 |
| Rio Grande do Sul | 34.3 | 47.5 | 13.2 |
| Maranhão | 26.4 | 39.3 | 13.0 |
| Paraná | 33.4 | 44.3 | 10.9 |
| Minas Gerais | 29.8 | 40.6 | 10.8 |
| Mato Grosso do Sul | 34.1 | 44.9 | 10.8 |
| Ceará | 33.9 | 43.1 | 9.2 |
| São Paulo | 45.5 | 53.7 | 8.3 |
| Rio Grande do Norte | 30.0 | 35.9 | 5.9 |
| Piauí | 26.4 | 30.5 | 4.2 |
| Santa Catarina | 46.6 | 46.9 | 0.3 |
| Mato Grosso | 30.8 | 30.7 | -0.1 |
| BRAZIL | 30.2 | 46.0 | 15.9 |
Source: 2018 School Census and data from the study.
FINAL CONSIDERATIONS
There is growing scientific evidence on the importance of early childhood interventions to improve poverty, inequality and development indicators. In view of such evidence, the present work aims to inform public policy concerning the distribution of daycare vacancies.
Among children living in urban areas, the methodology used sought to prioritize daycare provision for those in the most vulnerable situations (poor families and single-parent families) in line with some findings of the literature on the subject. In addition, the methodology incorporated measures related to daycare demand and to the participation of mothers or caregivers in the labor market.
As usual, some methodological limitations must be considered. First, rural populations were not included in the analysis, as explained earlier (see also Appendix A). In addition, it was not possible to determine the accuracy of municipal projections for populations with the characteristics listed in the INC for the period 2018-2020, since there is no information available for this. There are other limitations in determining the accuracy of municipal estimates for 2010 (which would require a separate study) and of demographic projections (which use non-parametric methods).
The index estimates covered the years 2018, 2019 and 2020, and a more detailed analysis was carried out on 2018. We did not find a clear pattern that explains where there are higher or lower INC values. This is due to its composition, which can reach high levels in municipalities with a high incidence of poverty or in those with a significant number of mothers* in the labor market. In other words, municipalities with nothing in common may have similar levels in the INC. Data showed that, in the North and Northeast regions, municipalities were commonly found which had high rates in the poverty component of the INC, while the single parenthood and labor market components were more important in the other regions. When analyzing another aspect (with only the urban population in the denominator), the indices indicated a greater need for daycare in the North and Northeast regions. On the other hand, the Central-West region and a part of the Southeast showed a smaller need for daycare (considering only percentages in relation to the urban population).
Finally, the differentials between INC and daycare enrollment rate for 2018 were analyzed. There, too, the maps showed greater differentials between the index and the daycare enrollment rates in the North and Northeast regions. These findings indicate that the public policy to expand daycare provision should focus primarily on these regions of the country, in addition to other municipalities that showed major distances between enrollment and the calculated need.
As mentioned in the introduction to this work, the mere quantitative increase in the number of children served by daycare centers is far from sufficient for early childhood policies to be effective. The quality of the service provided is critical. There is no space here for a more in-depth discussion on the subject, but it is known that this phase of life requires qualified professionals, who must be provided with continuing education. Resource management and career attractiveness are yet other factors (which also matter for other education levels). This index proposal deals only with a piece of the puzzle to be solved for the effectiveness of public policies on early childhood in the country.