


 Inglés (pdf)
 Articulo en XML
 Enviar articulo por email
 Permalink
1. Introduction
Preserving academic integrity in an educational setting can be difficult. There are always new threats to academic integrity, each one often accompanied by a marketing push from commercially minded organisations. Included within those threats are automatic paraphrasing tools that look to disguise and rewrite words in student assignments so that they are not detected as plagiarism. Such threats represent a persistent and growing challenge for educational institutions around the world, primarily higher education institutions.
Many institutions use text matching systems to identify when student work is similar to known sources such as web pages, an area explored by Lancaster (2013). But as Rogerson (2017) has stated, text matching tools are not a complete solution to detecting plagiarism, particularly where a third party has been involved in the completion of assessment tasks. It can also be difficult for educators to evidence that work has not been completed by the student who handed it in. The use of automatic paraphrasing tools provides challenges for both detection and gain evidence. It is also an area for which little is known about the extent of the use of such tools. This paper aims to address that omission from the academic integrity literature.
Plagiarism continues to be a challenge for universities. Many commentators have identified that educational interventions are necessary to help students to avoid plagiarism and to improve their understanding of academic integrity. Macdonald and Carroll (2006) recommended a holistic approach to integrity, an idea taken forward by Sureda et al (2020) who classified three types of interventions that could be used with students. These were: (1) technological, (2) normative and (3) educational/informative. All three approaches can be used in parallel to good effect.
The technological mechanisms approach to plagiarism detection primarily involves the use of suitable software, such as text matching tools (Kumar and Tripathi, 2017; Shang, 2019). Such software can identify wording shared by a student and other known sources. Some critics have argued that such an approach may be inefficient as it requires considerable investment of money, time and human resources (Vie, 2017).
Normative mechanisms have focused on the processes through which plagiarism is identified and the procedures that are in place to be followed if plagiarism is found (Tatum and Schwartz, 2017; Wu et al., 2020). This can include the development of university regulations. The results from following such a procedure might see a student receiving penalties or sanctions. Sometimes the threat of such penalties can be enough to dissuade students from breaching academic integrity.
Raising awareness of academic integrity and helping students to avoid accidental plagiarism is also important. This is an area captured through the educational/informative intervention, which considers the development of supportive campaigns and programmes for students and higher education staff (Stoesz and Yudintseva, 2018; Lysiak, 2020).
Sometimes interventions can lead to unintended consequences. One example can be seen through the widespread use of text matching tools to detect plagiarism, meaning that students cannot simply copy material from the web and submit this as if it were their own work. As a result, some students have considered the limitations of text matching software and looked for methods to circumvent its efficiency, an outcome that Comas (2020) characterises as a cobra effect. This concept references the accidental results that arise when an attempt to solve a problem subsequently makes the problem worse (Siebert, 2001). Mphahlele and McKenna (2019) have also argued that the use of text matching tools for control and punishment, rather than for pedagogical support, has also been a driver for students to look to find ways to disrupt the system.
The cobra effect appears to have led to students using three main approaches to avoid being detected for plagiarised work: (1) contract cheating, (2) machine translation systems and (3) automatic paraphrasing tools.
Contract cheating, a term originally introduced by Clarke and Lancaster (2006), has developed a strong body of evidence in the academic literature. This sees an outsourcing process used, not dissimilar to that used by many businesses. Here students solicit a third party to complete their assessments for them. By ensuring that the answers they acquire are original, students are unlikely to be detected as having plagiarised when their work is run through text matching software. Contract cheating has been explored in multiple languages and suggested interventions are available, particularly taking the form of normative and educational interventions (Lancaster and Clarke, 2016; Comas et al., 2020). Although the problem is not new, evidence from student surveys suggests that the extent of contract cheating has increased in recent years (Newton, 2018).
Machine translation systems rely on the development of improved artificial intelligence techniques to help people reading and speaking different languages to understand and communicate with one another. Outside their legitimate uses, the ways in which students can use machine translation systems to disguise their work from detection by text matching tools have also been explored (Akbari, 2021; Jones and Sheridan, 2015). In its simplest format, a student could simply take an essay written in a language other than their own, run this through a machine translation system that is freely available on the web, then hand in the resulting essay. Since the words are different to the originals once translated, this academic misconduct is very unlikely to be detected. More sophisticated ways to use such tools to get an unfair advantage are also available, such as running the text through multiple rounds of translation.
Most pressing, for the purposes of this paper, is the little explored area of the use of automatic paraphrasing tools by students. The earliest known study of this, by Lancaster and Clarke (2009), used the terminology “automated essay spinning” reflecting how students were misusing online tools known as article spinners. These spinners had the primary purpose of changing text content intended for web pages sufficiently so that it would appear original to search engines such as Google, providing the cloned pages with better search engine optimisation and more traffic. Spinning techniques would allow, for example, the same text to be placed on ten different websites, all with slight variants, but not be detected as duplicated content through Google, something often referred to as a black hat approach. Madera et al. (2014) have discussed this in more detail.
Early article spinners were relatively unsophisticated, often replacing words with inappropriate synonyms. But as more recent commentators including Rogerson and McCarthy (2017) have observed, the technology has improved and now automatic paraphrasing tools are easily accessible to students. A simple Google search for “paraphrase tool” yields a large number of results, listing websites such as https://www.paraphrase-online.com. These sites appear at the top of the search engine results and their description clearly describes the nature of their service: “Our paraphrasing tool will help you achieve that and rewrite any text in seconds, therefore avoiding plagiarism issues” (Paraphrase Online, 2021). These resources “to create paraphrased material are easily available on the internet and can escape plagiarism software” (Newman, 2019). Even though such services may not be aimed solely at students, they are openly available and afford students to opportunity to commit academic fraud.
In its simplest format, an automatic paraphrasing tool could be relatively unsophisticated, for example replacing every noun with a synonym. But most current tools employ Natural Language Processing (NLP) techniques (Chevelu et al., 2009). In layman’s terms, such tools use artificial intelligence to try and understand the meaning behind text and to improve the quality of the paraphrased version. NLP is an area of study that has been extensively explored from a technological perspective, with numerous scientific publications describing experiences developing resources (Gadag and Sagar, 2016; Yang et al., 2019). Automatic paraphrasing does have real world uses. Li et al (2018) have discussed the key role this plays in applications such as automatic systems for answering questions, refining searches and improving recommendations.
If a student were to rewrite a text and present this for assessment as if this were an “original” document Dickerson (2007) would define this as a form of “facilitated plagiarism” since this involves using third-party texts and materials without proper attribution. It is still facilitated plagiarism if automatic paraphrasing tools are used. The use of such tools by students becomes problematic as current technological interventions do not work well. Hunt et al. (2019) have observed that interventions would need to go beyond simple text matching. Some research into detecting student work produced through automatic paraphrasing tools has also begun, but is primarily focused on the development of suitable algorithmic solutions (Altheneyan and Menai, 2020; Foltynek et al., 2020).
Despite the risks posed to academic integrity by automatic paraphrasing tools, there is still insufficient evidence about the use of these tools by students. Their existence is known and there are indications that their functionalities have improved in recent years (Gupta et al., 2018), but the extent to which they are used by students is unknown. Nothing is known about the causes associated with their use, nor about how frequently their use is detected in university settings.
The few empirical studies on the use of automatic paraphrasing tools in the academic environment are descriptive and exploratory. This is the case of the pioneering study by Lancaster and Clarke (2009), who tested the effectiveness of three text matching tools against different texts that had been automatically rewritten using automatic paraphrasing tools. Also noteworthy is the study by Rogerson and McCarthy (2017), very similar in approach to Lancaster and Clarke (2009), whose analysis used the Turnitin software to determine the level of similarity between two texts produced using paraphrasing tools. Prentice and Kinden (2018) provide the only situational analysis of the use of paraphrasing tools, by analysing three papers from health science students that were suspected of being produced through automatic paraphrasing tools. The results suggest that paraphrasing is happening in our academic institutions and support the need for research into this threat to academic integrity.
2. Objectives
This paper seeks to provide evidence about the level of interest into online paraphrasing tools that exists in four countries, the USA, the UK, Australia and Canada. This is based on an analysis of Google searches for those resources. To this end, three research questions (RQs) are posed:
RQ1: What is the volume of organic searches that use descriptors identifying automatic text paraphrasers and what trends can be seen in the four countries under analysis during 2020, the first year under COVID-19 circumstances?
RQ2: What search trends are observed based on the months of the year and how do these trends relate to the assessment periods at universities?
RQ3: What are the search trends for the five-year period 2016 to 2020 for the descriptors associated with searches for automatic paraphrasers in the countries under analysis? Is there a different trend in the interest towards automatic paraphrasers during the pandemic COVID-19?
3. Materials and Methods
3.1. Search Analytics Methodology
This research primarily uses the search analytics methodology, an approach used in other fields that has not been commonly applied to academic integrity research. In its simplest format, this can be used to identify the search volume and most frequently searched for terms on websites, through search engines or on social media (Orduña-Malea and Aguillo, 2015). According to Santos (2018), the methodology is primarily used to study human behaviour, to predict the present and to forecast trends in the near future.
Numerous empirical studies using the search analytics methodology have been carried out in recent years. Some examples of previous publications indicate the wide-ranging utility of this technique. These include studies related to forecasting visitors to a country (Antolini and Grassini, 2019); studies on price evolution (Seabold and Coppola, 2015); analysis of unemployment (Nagao et al., 2019); studies on health (Johson et al., 2020); and predictive analysis of attendance at cultural, sports and leisure spaces or events (Botta et al., 2020). There are also notable contributions from a range of disciplines based on search analytics for forecasting or prediction: predicting the consumption of goods and services (Yu et al., 2019); trends in the tourism sector (Bokelmann and Lessmann, 2019); predictions of the behaviour and evolution of diseases (Teng et al., 2017); labour market forecasts (Naccarato et al., 2018); and predictions in electoral races (Prado-Román et al., 2020).
Studies using the search analytics methodology often use the Google Trends service. Such tools are effective for research in many fields (Orduña-Malea, 2019) and make it possible for researchers to analyse the terms that users search for (Jansen, 2009). This is part of the wide-ranging data collected by Google. The use of Google Trends for academic research is well established. Jun et al. (2018) used Scopus results for the period 2006 to 2017 to identify 657 research articles that had used Google Trends. These articles covered a multitude of areas, primarily in information and communication technologies, medicine and health and business and economics. Those authors found that the use of Google Trends had shifted away from studies focused on technology monitoring and surveillance, and towards trend prediction.
Alongside Google Trends, this study uses the Keyword Magic Tool functionality of the commercial SEMrush software. This functionality takes a keyword or descriptor and generates a list of similar keywords used for Google searches.
In all cases, note that keyword denotes a search term typed in by users. Contrary to the name, this may also represent a phrase or more than one word.
3.2. Data Set Formation
Two data sets were collected. Each data set contained information for four countries, namely the USA, UK, Canada and Australia.
3.2.1. SEMrush Data Set
Searches of SEMrush were conducted using the terms “paraphrase”, “reword” and “rephrase”. The searches were repeated for each of the four countries. This process generated a total of 34,732 keywords. Table 1 shows the number of keywords obtained for each search term and country.
Table 1 Number of similar keywords obtained during initial searches of SEMrush
| Search Term | paraphrase | reword | rephrase |
|---|---|---|---|
| USA | 12,131 | 2,341 | 1,478 |
| UK | 5,097 | 796 | 767 |
| Canada | 5,244 | 576 | 573 |
| Australia | 4,496 | 644 | 589 |
Source: Authors elaboration based on SEMrush Data Set (2020).
Alongside each of the 34,732 keywords in the list, two metrics were collected for the period covering the 2020 calendar year. The first metric was the monthly Google search volume for each keyword (providing the average number of monthly searches for the keyword). The second metric was the trend, which measures the interest in the given keyword over a 12-month period (the metric scores are scaled between 0 and 1 based on changes in the number of searches per month from January to December 2020).
The data was analysed and filtered. Keywords for which the average monthly search volume for each country was below 100 were excluded. Keywords not related to searches associated with online paraphrasers were manually removed. The final SEMrush data set contains 236 keywords, many of which are repeated for each of the countries under analysis.
3.2.2. Google Trends Data Set
Google Trends was used to collect the second data set, which contained “relative search volume” (RSV) data for each week during the period 2016 to 2020. The weekly data was designed to help detect moments over the five-year period when there has been an increase in the popularity of a term under analysis. The RSV data makes it possible to evaluate rates of change between search terms.
The RSV data represents the search rate for a specific term. Google Trends supplies the numerical value of the RSV for each weekly time interval for search terms that meet a minimum volume threshold. The search results are proportional to the time and geographical location of a search (Modrego-Pardo et al., 2020). The RSV values are calculated on a scale from 0 to 100, where 100 indicates the week with the highest frequency of searches as a proportion of the total number of searches made, while, for example, the values of 50 and 0 indicate weeks where the popularity of the term is half of the maximum value or where there was insufficient data for calculation, respectively.
RSV data was collected for the descriptors “paraphrasing tool”, “paraphrase online” and “rephrase tool”, restricted to the USA, UK, Canada and Australia.
4. Results
4.1. Descriptors used to search for information related to automatic paraphrasing tools and search volume
The SEMrush Data Set was analysed to investigate search volume trends. Table 2 shows the five keywords for each of the countries being studied that had the highest average monthly searches in 2020. These are drawn from the list of 236 keywords. The highest average monthly search volume was 165,000 searches in the USA for the keyword “paraphrasing tool”. The lowest included in the keyword list was 110 searches, but this takes into account that the threshold for inclusion in the data set was set at 100 or more monthly searches.
The average monthly search volume for the 236 terms analysed is 442,970 monthly searches for the four countries (268,370 for the USA, 52,330 for the UK, 61,010 for Canada and 61,260 for Australia). This data, transposed to the annual average, indicates that during 2020, there were more than 5 million searches using the 236 descriptors analysed. This includes more than 3 million searches from the USA and approximately 700,000 searches for the other three countries being studied.
Table 2 List of the five keywords with the highest average monthly searches by country
| Keyword | Country | Volume of monthly searches |
|---|---|---|
| paraphrasing tool | USA | 165,000 |
| rephrase tool | USA | 9,900 |
| paraphrase generator | USA | 8,100 |
| rewording tool | USA | 8,100 |
| reword a sentence | USA | 5,400 |
| paraphrasing tool | UK | 33,100 |
| paraphrase online | UK | 2,400 |
| rephrase tool | UK | 1,900 |
| rewording tool | UK | 1,600 |
| sentence rephraser | UK | 1,000 |
| paraphrasing tool | Canada | 40,500 |
| paraphrase online | Canada | 2,900 |
| rephrase tool | Canada | 1,900 |
| paraphrasing tool online | Canada | 1,600 |
| sentence rephraser | Canada | 1,600 |
| paraphrasing tool | Australia | 40,500 |
| paraphrase online | Australia | 2,900 |
| rephrase tool | Australia | 2,900 |
| reworder | Australia | 1,900 |
| paraphrasing tool online | Australia | 1,600 |
Source: Authors elaboration based on SEMrush Data Set (2020)
The 236 words analysed were coded and classified into three categories: 1) searches for automatic paraphrasing tools and devices, 2) generic searches for paraphrasing and finally, 3) searches that combine paraphrasing and academic activities. Keywords related to automatic paraphrasing tools are in the majority and total 126, such as: “reword machine”, “professional paraphrasing tool” and “best paraphrasing tool” (with a total of 385,000 monthly searches and an average of 3,055 searches per month). A total of 90 keywords indicate generic searches for paraphrasing help or tool support, such as: “reword my sentence”, “rephrase text” and “rephrase this for me” (with a total of 48,000 searches and an average of 533 per month). Finally, 20 keywords describe searches for paraphrasing in an academic setting, for example: “reword my essay”, “essay paraphraser” and “scholarly paraphrasing tool” (representing 10,000 monthly searches in total and an average of 500 per month per keyword).
4.2. Monthly search trends
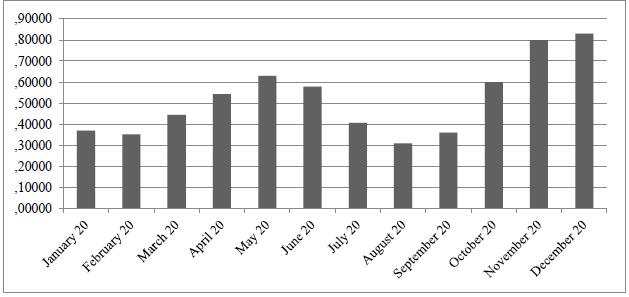
The SEMrush Data Set was further analysed to investigate monthly search trends for 2020 under each of the 236 descriptors. Figure 1 shows the overall search data for the total number of words analysed. As Figure 1 shows, the final quarter of 2020 is the period in which the greatest interest is detected in searches for the terms analysed, followed by the months of April, May and June. September and February are the months with the lowest search trends.
Source: Authors elaboration based on SEMrush Data Set (2020)
Figure 1 Monthly search trends for 2020 for the 236 keywords analysed
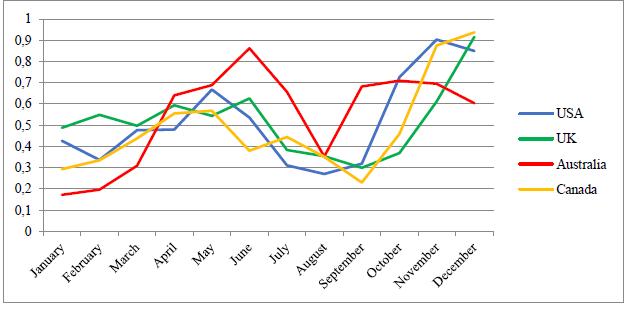
Figure 2 shows the monthly search trend data for 2020 for each country separately. This demonstrates largely similar trends to Figure 1, including showing a sharp rise in searches from March to June, with higher growth in Australia compared to the others. This is followed by a substantial drop between July and September, with searches increasing again during the last three months of the year, with the exception of searches made in Australia, which drop during the last two months of the year, and those made in the USA, which drop in December.
Source: Authors elaboration based on SEMrush Data Set (2020).
Figure 2 Monthly search trends for 2020 for the 236 keywords analysed by country
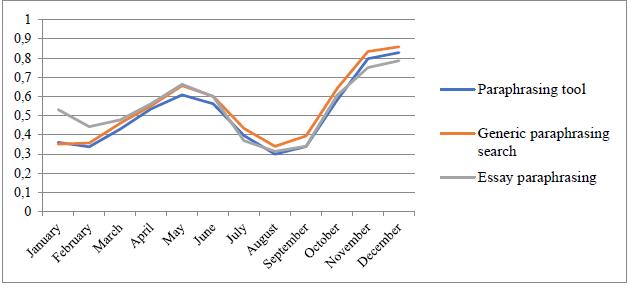
Analysis was also conducted to determine whether there are differences between the monthly search trends based on the content or object of the search, namely, searches for paraphrasing tools, generic searches for paraphrasing and searches for paraphrasing related to academic papers. As can be seen in Figure 3, the monthly trend for each search objective is very similar over the course of 12 months: a steady increase from January to June, a decrease from July to September and finally, a stable increase until December.
4.3. Search trends over the past five years
The Google Trends Data Set was analysed using the 2016 to 2020 weekly average RSV data for each of the three descriptors. To gauge the potential changes in keyword search trends, the means for each year were compared using a one-way ANOVA. As shown in Table 3, the trend in the search interest for the three descriptors has been increasing year-over-year since 2016, peaking in 2020. The differences are significant for two of the three keywords used: “Paraphrase online” and “Paraphrasing tool”. The sum of the means for each keyword was calculated and the trends of the means were also compared by year; the result is that there is a significant difference between the years analysed, with a clear upward trend in interest in the terms searched.
Table 3 Annual means of interest in the keywords analysed in the 4 countries
| Keyword | Year | Mean | Bilateral significance |
|---|---|---|---|
| Paraphrase online | 2016 | 8.65 | .000* |
| 2017 | 7.89 | ||
| 2018 | 7.18 | ||
| 2019 | 8.23 | ||
| 2020 | 20.62 | ||
| Total | 10.50 | ||
| Rephrase tool | 2016 | 6.03 | .515 |
| 2017 | 5.74 | ||
| 2018 | 5.93 | ||
| 2019 | 6.96 | ||
| 2020 | 8.08 | ||
| Total | 6.55 | ||
| Paraphrasing tool | 2016 | 6.62 | .000* |
| 2017 | 9.83 | ||
| 2018 | 16.31 | ||
| 2019 | 26.62 | ||
| 2020 | 33.62 | ||
| Total | 18.57 | ||
| Sum of the 3 keywords | 2016 | 21.30 | .000* |
| 2017 | 23.46 | ||
| 2018 | 29.42 | ||
| 2019 | 41.81 | ||
| 2020 | 62.32 |
* Significant at p<0.05
Source: Authors elaboration based on Google Trends Data Set (2016-2020).
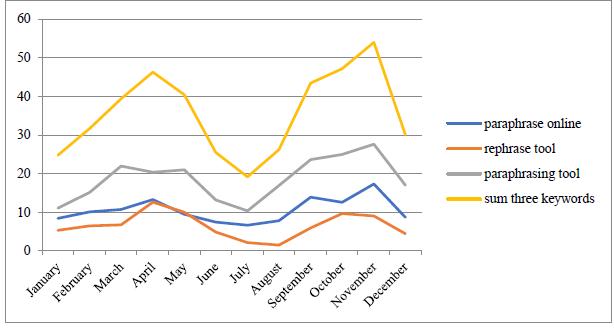
Next, the monthly evolution of the Google search trends for the three descriptors in the four countries was analysed. As in the analysis focused on 2020 using the SEMrush Data Set, the trend pattern is repeated for the three keywords analysed using Google Trends for 2016 to 2020. This is shown in Figure 4. There is an increase in searches from January to April and May. Then beginning in June there is a decrease in searches until July and August. Subsequently the search volume rises again, reaching a maximum in November, and then dropping slightly in December. This trend is very clear in the graphical representation of the sum of means of the three descriptors. These differences were analysed using the one-way ANOVA test and were statistically significant in all four cases.
Source: Authors elaboration based on Google Trends Data Set (2016-2020).
Figure 4 Monthly search trends for the analysed keywords using Google Trends for the period 2016-2020
The trends by country were then analysed. There are notable differences in the search interest for the terms analysed between the four countries, as shown in Table 4. As an overall average, the search trend or interest in the studied words is highest in Australia, with the USA in second place, the UK in third place and Canada as the country that demonstrated the least interest in searches related to the use of paraphrasers from 2016 to 2020. As shown in Table 4, the differences between the countries are significant, based on the one-way ANOVA variance comparison test.
Table 4 Mean interest in the keywords analysed by country
| Keyword | Country | Mean | Bilateral significance |
|---|---|---|---|
| Paraphrase online | USA | 12.12 | .000* |
| Canada | 7.6 | ||
| UK | 12.69 | ||
| Australia | 9.61 | ||
| Total | 10.5 | ||
| Rephrase tool | USA | 14.64 | .000* |
| Canada | 2.99 | ||
| UK | 4.08 | ||
| Australia | 4.48 | ||
| Total | 6.55 | ||
| Paraphrasing tool | USA | 13.22 | .000* |
| Canada | 17.18 | ||
| UK | 15.95 | ||
| Australia | 27.92 | ||
| Total | 18.57 | ||
| Sum | USA | 39.97 | .000* |
| Canada | 27.77 | ||
| UK | 32.72 | ||
| Australia | 42 | ||
| Total | 35.62 |
* Significant at p<0.05
Source: Authors elaboration based on Google Trends Data Set (2016-2020).
5. Discussion and Conclusions
According to the results of previous investigations, the use of internet search volume is a valid method to use for determining public interest and opinion on a broad range of topics (Villa and Cerdán, 2020). This is also considered to be a relevant and pertinent source of data for improving existing knowledge about the interest in and use of automatic paraphrasing tools in the countries being studied. Accordingly, the first contribution of this investigation is to propose a new weighting method based on the hypothesis that the internet search volume of terms related to automatic paraphrasing systems may reflect student interest in those systems and may be a baseline for gauging their actual use.
This paper assumes that when students decide to use an automatic paraphrasing tool to write an academic paper, they are making a series of decisions that resemble and can be compared to the behaviour of a consumer. The consumer decision model (Blackwell et al., 2006) argues that individuals make logical decisions based on prior events. That is, the model is based on a sequence of stages: 1. Recognition of the need; 2. Information search; 3. Evaluation of alternatives; 4. Decision; and 5. Behaviour after the decision. This model appears equally applicable to the choice of an automatic paraphrasing system by students: 1. Demand for an assessment task by a professor; 2. Search for information about paraphrasers; 3. Evaluation of alternatives; 4. Decision to use a paraphraser, based on the information gathered in Step 2; and 5. Behaviour after the decision.
Step 2 is the point at which students access the internet to search for information about automatic paraphrasing systems, an explanatory variable in the analysis presented. Assuming the hypothesis that search volume accurately represents student interest is true, this would imply that the more information is sought in Step 2, the more students make the decision to use paraphrasers to write their papers.
Nevertheless, this study has some shortcomings and limitations. First, the fact that trends reflect data at a general population level make it impossible to conclude that only students with an interest in automatic paraphrasing services are producing the entire search volume. Paraphrasing tools do have other uses, including for the production of web content. However, the low quality of the output generated (Rogerson and McCarthy, 2017) suggests that these would not likely be considered for use in a professional setting. It therefore appears likely that much of the use of automatic paraphrasing tools comes from an educational setting, whether this is from students or even from contract cheating providers. This is further supported by the search trends shown in Figure 3, where the relative volume of searches for academic paraphrasing closely matches those for more general paraphrasing terms.
There may also be a bias in the search volume data produced by intermittent variables that could lead to changes in search trends, such as, news events or media attention. Although this situation may occur, there is little evidence to suggest that the topic has attracted special interest from the press, nor has it had a significant public impact, as is the case with other academically dishonest behaviours, such as buying and selling papers (Curtis and Clare, 2017), cheating in online exams (Bilen and Matros, 2021), the use of file sharing sites (Lancaster and Cotarlan, 2021) or plagiarism (Larkham and Manns, 2002).
Finally, there are always limitations arising from the use of third-party data and the potential loss of control over that data. This is an inevitable effect of this type of research. Nonetheless, the considerable empirical literature based on this methodology should provide credibility and validity for this research. The search analytics methodology offers great potential for research on academic integrity and education in general. This represents a source of information on an activity that has become an everyday experience and will undoubtedly provide evidence that supplements the existing body of knowledge on a particular topic.
The fact that sufficient data was available through SEMrush to conduct this study shows that Google users and searching for information relating to automatic paraphrasing systems. The words and concept Google users search for were available and it was possible to classify these.
To focus exclusively on the keyword searches associated with the automatic paraphrasing of academic papers, the fact that the average monthly search volume of the four countries studied reaches 10,000 is quite symptomatic. There seems little risk of people not working on assignments conducting searches for these terms. It is very plausible to argue that people conducting such searches are students.
By the end of 2020, there was an average of 120,000 searches for the automatic paraphrasing of academic papers in the four countries. Breaking this data down by country, the figures are as follows: 102,840 searches in 2020 from the USA, 11,280 searches from the UK, 3,120 searches from Canada and 2,640 searches from Australia. These can then serve as benchmark figures for the minimum level of yearly searches, by country, by students wanting to use paraphrasing software in their assignments. What it is impossible to ascertain from this study is how many of those who searched for those resources ultimately used them. The number of students who use this type of tool is likely much higher than the search volume, as once a user has searched for paraphrasing software and used it, they can continue to use the software in the future without searching for it again. This is supported by statistics provided by one of the leading online paraphrasing systems, Quillbot, which claims to have an average of 1.5 million active users per month and 8,000 subscribers to its paid services (Long, 2020). The percentage of people who have accessed this service through a search engine will be very high for the initial visit, but will decrease significantly on subsequent visits to its website.
Another remarkable aspect is the behaviour of searches over the course of the year. As Figures 1 and 2 demonstrate, the peak search periods match up closely with the time periods used for assessment deadlines at many universities. The USA, UK and Canada see search peaks in April, May, November and December and lower levels during the summer vacation period. In Australia, which follows a separate calendar, there is a drop in November and December coinciding with their summer vacation. This further suggests that those searching for this type of service have some relationship with the educational environment.
The search trends for 2020 also show a clear upward trend in the search interest for automatic paraphrasing systems compared with previous years. 2020 was an exceptional year in many fields, including academia, due to the Covid-19 pandemic. Other studies have indicated an increase in student academic integrity breaches over that time period (Lancaster and Cotarlan, 2021), a finding that seems further strengthened by the research presented here. If students feel unsupported, or are not attending classes in person, does this mean that they are more likely to seek out paraphrasing tools as a means to an end? A future analysis of this type of data would be useful if teaching returns to a classroom setting to see if the upward trend continues.
Furthermore, given the potential of the databases used for this study, it would be appropriate for future studies to increase the number of countries under analysis in order to obtain a global perspective. There is also the opportunity to consider how these tools are being used in languages other than English. The phenomenon of using automatic paraphrasing software to circumvent plagiarism detection systems is unlikely to be exclusive to the countries analysed. Even without country specific data, it is very likely that all countries can learn from the trends presented here.
With reference to the intervention types mentioned at the start of the article (Sureda et al., 2020), tackling the cobra effect of automatic paraphrasing tools will require more effort than just developing new software. New technological developments in detecting paraphrasing are both possible and likely, but these will be circumvented by advances in machine learning and automated writing technologies. A normative approach may need to be considered, where automatic paraphrasing is considered as part of university processes. But ultimately, perhaps educational interventions are the best ones? How are students being taught how to write and to make the best use of technology? Are faculty being educated about the new tools available to students? Have students been shown that paraphrased work may not actually be very good? Developing a culture of academic integrity requires trust on all sides rather than just instinctively reacting to the cobra effect. Positive interventions have to be best way forward.

