


 Inglés (pdf)
 Articulo en XML
 Enviar articulo por email
 Permalink
1 – INTRODUCTION
Skills, intelligences and cognitive preferences have been intensely studied in recent years. (1–7) During the majority of the 20 th century, the main tool for evaluating human intelligence was the Intelligence Quotient (IQ). Even though adaptations have been made since its creation, in 1914, the aim of that test was to quantify intelligence according to performance in questions that basically involved logical, mathematical, linguistic and spatial rationale.( 1 , 2 , 6 , 8 )
In 1983, the theory of multiple intelligences (MI) was elaborated by Howard Gardner, expanding the concept of intelligence and questioning the notion that it would be a unique entity, measurable through IQ tests.( 6 , 9 ) According to Gardner, intelligence would be “the capacity of solving problems or creating products that are valued in one or more cultural contexts”, indicating the existence of 8 MI to date: bodily-kinesthetic, spatial, interpersonal, intrapersonal, linguistic, logical-mathematical, musical, and, more recently, the naturalist intelligence.( 9 ) In addition to the 8 intelligences already established ( Chart 1 ), Gardner suggests that there may be others not yet adequately identified or tested – such as a pedagogical or existentialist intelligences.( 3 , 10 )
CHART 1 Description and applicability of multiple intelligences – Adapted (1–4)
| Intelligence | Description / key concepts | Examples with high applicability | Examples of teaching and learning approaches |
|---|---|---|---|
| Bodily-kinesthetic | Bodily movement control (coordination, dexterity, speed) | Dancers, athletes | Simulations, practical sessions |
| Spatial | Interpretation of visual patterns; notions of distance and location | Pilots, architects | Slides, mental maps, videos |
| Interpersonal | Understanding of others’ feelings, motivations and capacities | Political leaders, salespeople | Team work, stimulating feedback (input/output), community activities |
| Intrapersonal | Self-interpretation (feelings, motivations, capacities) | All occupations | Individual work, concentration exercises, journals |
| Linguistic | Spoken and written language (clear, articulated, and effective expression) | Lawyers, teachers | Attend classes and/or listen to the audio afterwards, group discussions, reading, writing |
| Logical-mathematical | Logical analysis of problems, identifying patterns and carrying out deductions; and mathematical calculations | Engineers, researchers | Scientific experimentation, stimulating critical thinking, syllogisms (“if/then”) |
| Musical | Identification and creation of musical patterns; perception of timber, volume, intensity, rhythm. | Singers, composers | Oral mnemonics, songs with lyrics on the content to be studied |
| Naturalist | Bond with plants and animals; sensitivity with water, wind, the sun; categorization of materials | Biologists, chefs | Diverse sensorial stimuli (sounds, tastes, smells, textures, images), analogies with nature |
1. Gardner H. Frames of Mind: The Theory of Multiple Intelligences. 3rd ed. New York: Basic Books; 2011. 528 p.
2. Gardner H. Beyond the IQ: education and human development. Harv. Harv Educ Rev. 1987;57:187–93.
3. Bakić-Mirić N. Implementation of multiple intelligences theory in the English language course syllabus at the University of Nis Medical School. Srp Arh Celok Lek [Internet]. 2010;138(1–2):105–10. Available from: http://www.ncbi.nlm.nih.gov/pubmed/20422920 4. Armstrong T. Multiple Intelligences in the Classroom. 3rd ed. Alexandria, VA: ASCD; 2009. 246 p
In a framework unlike that of studies related to learning and cognition, Neil Fleming furthered his work in learning preference (LP) studies, which represent different degrees of preference in acquiring new knowledge according to individual variations – such as biological factors, previous experiences, and interests. In 1992, Fleming proposed the existence of four big domains regarding LP: visual, aural, read/write, and kinesthetic. More than one domain could be prominent in some individuals, constituting the multimodal pattern.( 4 , 5 )
The present paper seeks to identify MI and LP distributions among medical students at the Federal University of Paraná (Brazil). This mapping process could stimulate curricular changes aimed at optimising teaching and learning, rendering the course more dynamic, motivating, and democratic.(11–13) This paper also aims to correlate MI and LP, possibly expanding the possibilities for teaching and learning resources that should be employed. The research is in accordance with the premise that teaching institutions should not only inform, but also promote the students’ development as a whole. By becoming more aware of their capacities and preferences, students could increase self-awareness and choose better strategies when approaching challenges not only in their professional and academic settings – occasionally tweaking their study methods, for instance – but also in their personal and social lives.( 3 , 5 , 12 )
In this new context – in which the human intellect is understood in an increasingly complex and multifactorial fashion, with varied predominance of MI and LP – the necessity for more individualized teaching rises, acknowledging that each student may learn in diverse ways and that some may be more efficient than others.
2 – METHODS
2.1 Type of study and sample
A descriptive, observational, and transversal study was conducted between September and November 2016, in which two printed questionnaires were filled out by students in their 1 st to 12 th semester of the medicine course at the Federal University of Paraná (Brazil). The data was collected at Federal University of Parana’s Hospital de Clínicas, during the morning period and at times previously established in agreement with students, without time constraint. Upon completion, the students returned the printed questionnaires to the researchers.
The inclusion criteria were: medical students at Federal University of Paraná enrolled in at least one discipline; and the due signature of the Free Informed Consent Form (FICF). The adopted exclusion criteria were: students not currently enrolled in any discipline of the medicine undergraduate course at Federal University of Paraná; students in programs of academic mobility; and students who did not sign the FICF. Through these criteria, the final sample was composed of 527 students, with a total of 1054 completed questionnaires.
2.2 Questionnaires
Regarding MI, the “List of verification for evaluating students’ multiple intelligences”, idealized by Thomas Armstrong( 7 , 14 ), was used. The MI analyzed were bodily-kinesthetic, interpersonal, intrapersonal, linguistic, logical-mathematical, musical, naturalist, and spatial – with each onescored from 0 to 100. Both author and publisher – Association for Supervision & Curriculum Development (ASCD) – had authorized the use of the aforementioned questionnaire. Authorization was also provided regarding randomization of the order of the questionnaire items, which was ensured in an attempt to minimize the chance that the student would promptly identify the intelligence being evaluated.
Regarding LP, the “Visual-Aural-Read/Write-Kinesthetic (VARK) Questionnaire”( 5 ) was used (©Copyright Version 7.8 (2017) held by Neil D. Fleming, Christchurch, New Zealand). version 7.8. This tool, considered to be simple, quickly employable, and of known and validated psychometric properties( 15 ), has been improved over the years so as to better identify preferred learning inputs. In addition to the categorization, VARK suggests strategies that can be applied to optimize learning for each LP. Since it was originally available in English, the researchers had validated the questionnaire for the Brazilian Portuguese Language according to validation guidelines( 16 , 17 ). This process involved 5 steps: translation, back-translation, revision by an external committee, pre-test and pilot study, which were all successful. Authorization for both the validation and the use in this research had been previously obtained from Neil Donald Fleming, from VARK Learn Limited – the company that holds the rights to the VARK questionnaire. Currently, VARK consists of only 16 questions approaching daily situations, each one allowing for multiple responses. A correction matrix was used by the researchers to obtain scores, from 0 to 16, for visual, aural, read/write, and kinesthetic LP. Preserving the students’ identity, the results were sent to VARK Learn Limited and an algorithm was applied in order to classify each student in one of the following categories: visual, aural, read/write, kinesthetic or multimodal.
Additional data, such as age, sex, and academic performance, were not collected becausethe inexistence of significant differences has been demonstrated in previous studies.(18–20)
2.3 Statistical analysis and research ethics
The collected data was initially stored in an electronic spreadsheet (Microsoft Excel ® 2016). Statistical analysis was then carried out via software (R Core Team, 2016, version 3.3.1), considering three possible divisions: semester of student in the undergraduate course ( 1 - 12 ), cycles (basic, from the 1 st to the 4 th semester; clinical, from the 5 th to the 8 th semester; and internship, from the 9 th to the 12 th semester); and general analysis (encompassing all students simultaneously). Quantitative variables were expressed in terms of means and standard deviations, while the qualitative variables were expressed in terms of relative and absolute frequency. Statistical differences were calculated through Kruskal-Wallis, χ2, or Fisher tests, when applicable. Pearson’s correlation coefficient was obtained to investigate correlations between the MI. The value of p<0.05 was considered as statistically significant.
This study was approved by the Research Ethics Committee of the Hospital de Clinicas, Federal University of Paraná (decision 1.776.555). Informed consent was obtained from all individual participants included in the study.
3 – RESULTS
1054 questionnaires were collected and processed (527 referred to MI and 527 to LP). At least 27 students participated in each of the 12 semesters studied.
3.1 Multiple Intelligences
MI were analyzed considering the following divisions: semesters, cycles, and general analysis ( Table 1 ).
TABLE 1 Multiple intelligences according to semester, cycles, and general analysis
| Mean ± standard deviation (minimum – maximum) | |||||||||
|---|---|---|---|---|---|---|---|---|---|
|
|
|||||||||
| n = 527 | Bod-K | Spatial | Interp | Intrap | Ling | Log-M | Music | Natur | |
| Semester | |||||||||
| 01 | 50 (9.5%) | 59.5 ± 14.2 | 64.3 ± 12.2 | 68.8 ± 13.7 | 72.9 ± 9.8 | 68.5 ± 11.8 | 68.5 ± 15.2 | 62.5 ± 16.4 | 50.1 ± 19.3 |
| 02 | 50 (9.5%) | 54.4 ± 14.7 | 61.4 ± 11.9 | 65.6 ± 12.8 | 71.4 ± 10.5 | 65.9 ± 12.6 | 66.2 ± 15.1 | 59.3 ± 16.5 | 46 ± 19.4 |
| 03 | 47 (8.9%) | 54.3 ± 14.9 | 61 ± 12.7 | 66.5 ± 12 | 69 ± 10.7 | 66 ± 10.4 | 70.4 ± 14.8 | 57.3 ± 17.4 | 46.3 ± 18.9 |
| 04 | 44 (8.3%) | 55.5 ± 15.6 | 58.4 ± 14.5 | 66.9 ± 14.7 | 72.7 ± 10.5 | 68.8 ± 11.2 | 72.1 ± 11 | 58.6 ± 17.4 | 41.5 ± 17.4 |
| 05 | 39 (7.4%) | 55.3 ± 12.7 | 58.9 ± 12.1 | 65 ± 12.1 | 71.2 ± 11.5 | 67.2 ± 11.9 | 66.6 ± 15.9 | 58.6 ± 15.3 | 46.1 ± 17.8 |
| 06 | 47 (8.9%) | 55.6 ± 14.7 | 56.4 ± 13.2 | 70.7 ± 14.5 | 69.3 ± 9.8 | 65.5 ± 12.2 | 67.5 ± 14.4 | 55.9 ± 18 | 40.5 ± 22.3 |
| 07 | 62 (11.8%) | 59.2 ± 14.4 | 64.8 ± 13.5 | 69.4 ± 12 | 68.7 ± 11.8 | 69.9 ± 10.8 | 68.3 ± 13.2 | 59 ± 17.8 | 54.4 ± 19.7 |
| 08 | 52 (9.9%) | 62.1 ± 14.7 | 64.9 ± 12.7 | 72.7 ± 12.5 | 73 ± 8.4 | 71.7 ± 11.8 | 71.8 ± 14 | 59.3 ± 19.2 | 50.3 ± 17.8 |
| 09 | 28 (5.3%) | 61.6 ± 14.2 | 62 ± 11.5 | 66.1 ± 12.8 | 72.9 ± 9.1 | 66.9 ± 11 | 70.3 ± 11.7 | 54.9 ± 21.4 | 47.8 ± 22.7 |
| 10 | 27 (5.1%) | 56.9 ± 14.1 | 63.6 ± 14.5 | 65.1 ± 14.1 | 73.3 ± 10.4 | 70.4 ± 13.3 | 74.6 ± 13.5 | 56.9 ± 17 | 46.7 ± 20.8 |
| 11 | 50 (9.5%) | 59.5 ± 13.5 | 61.9 ± 13 | 70.6 ± 12.4 | 70.7 ± 8.6 | 67.5 ± 11.8 | 69.9 ± 13.75 | 56.9 ± 17.5 | 47.6 ± 18.5 |
| 12 | 31 (5.9%) | 56.3 ± 14.9 | 62.9 ± 14.4 | 65.9 ± 13 | 67.5 ± 14.4 | 68.6 ± 14.3 | 68.3 ± 14.1 | 51.9 ± 19.3 | 46.8 ± 18.4 |
| p | 0.05 | 0.02 | 0.03 | 0.38 | 0.40 | 0.20 | 0.40 | 0.05 | |
| Cycle | |||||||||
| Basic | 191 (36.2%) | 56 ± 14.9 | 61.4 ± 12.9 | 66.9 ± 13.3 | 71.5 ± 10.4 | 67.3 ± 11.6 | 69.2 ± 14.3 | 59.5 ± 16.9 | 46.1 ± 18.9 |
| Clinical | 200 (38%) | 58.3 ± 14.4 | 61.7 ± 13.4 | 69.7 ± 12.9 | 70.4 ± 10.6 | 69.5 ± 11.6 | 68.7 ± 14.3 | 58.2 ± 17.7 | 48.5 ± 20 |
| Internship | 136 (25.8%) | 58.7 ± 14.1 | 62.5 ± 13.2 | 67.5 ± 13.1 | 70.9 ± 10.7 | 68.2 ± 12.5 | 70.5 ± 13.4 | 55.3 ± 18.6 | 47.3 ± 19.6 |
| p | 0.12 | 0.82 | 0.12 | 0.65 | 0.27 | 0.72 | 0.08 | 0.57 | |
| General Analysis | |||||||||
| 527 (100%) | 57.6 ± 14.5 (15-92) | 61.8 ± 13.1 (19-96) | 68.1 ± 13.1 (25-96) | 71 ± 10.5 (29-99) | 68.4 ± 11.8 (22-98) | 69.3 ± 14 (20-100) | 57.9 ± 17.7 (15-100) | 47.3 ± 19.5 (0-99) | |
Bod-K: bodily-kinesthetic; Interp: interpersonal; Intrap: intrapersonal; Ling: linguistic; Log-M: logical-mathematical; Music: musical; Natur: naturalist.
When analyzed according to semesters, the highest scores were obtained by the following MI: intrapersonal (highest means in periods 1, 2, 4, 5, 8, 9, and 11); linguistic (highest means in periods 7 and 12); logical-mathematical (highest means in periods 3 and 10); and interpersonal (highest mean in the 6 th semester). The naturalist intelligence obtained the lowest scores in all 12 examined semesters.
Considering cycles, intrapersonal MI predominated (highest means in basic, clinical, and internship cycles). Logical-mathematical intelligence reached the second highest means in both basic and internship cycles, whereas the interpersonal MI achieved the second highest mean in the clinical cycle. The lowest means were attributed to the naturalist skill.
The general analysis (n = 527) also revealed a predominance of the intrapersonal MI, followed by the logical-mathematical and the linguistic MI. The lowest mean was, once again, obtained by the naturalist intelligence. Figure 1 summarizes the distribution standards for MI according to the cycles and also according to the general analysis.
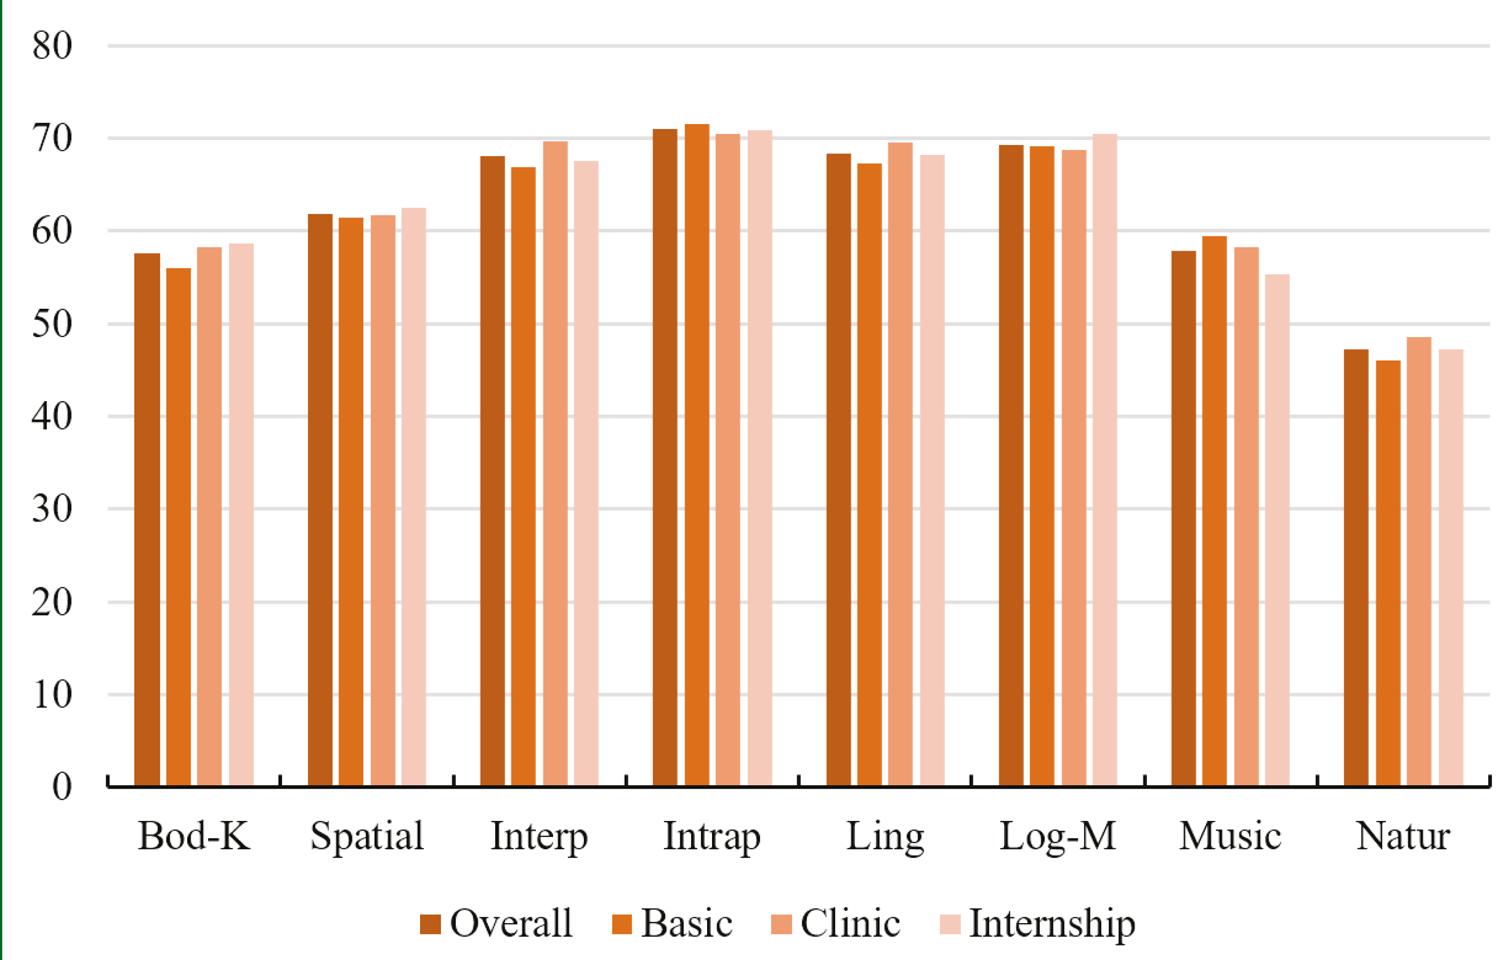
FIGURE 1 Distribution of Multiple Intelligences according to cycle and general analysis. Bod-K: bodily-kinesthetic; Interp: interpersonal; Intrap: intrapersonal; Ling: linguistic; Log-M: logical-mathematical; Music: musical; Natur: naturalist
Additionally, a matrix of correlation between MI was elaborated in order to identify how they influenced one another and exclusively positive indexes were found ( Table 2 ).
TABLE 2 Matrix of Correlation for the Multiple Intelligences
| Bod-K | Spatial | Interp | Intrap | Ling | Log-M | Music | Natur | |
|---|---|---|---|---|---|---|---|---|
| Bod-K | +1 | +0.4 | +0.32 | +0.22 | +0.29 | +0.36 | +0.41 | +0.51 |
| Spatial | +1 | +0.27 | +0.3 | +0.22 | +0.38 | +0.24 | +0.24 | |
| Interp | +1 | +0.22 | +0.28 | +0.15 | +0.18 | +0.22 | ||
| Intrap | +1 | +0.38 | +0.33 | +0.17 | +0.32 | |||
| Ling | +1 | +0.19 | +0.07* | +0.35 | ||||
| Log-M | +1 | +0.3 | +0.3 | |||||
| Music | +1 | +0.39 | ||||||
| Natur | +1 |
Bod-K: bodily-kinesthetic; Interp: interpersonal; Intrap: intrapersonal; Ling: linguistic; Log-M: logical-mathematical; Music: musical; Natur: naturalist. -1: strong negative correlation; +1: strong positive correlation *: only correlation involving p > 0.05.
3.2 Learning Preferences
Regarding LP, analyses were also executed in terms of semesters, cycles and general analysis ( Table 3 ).
TABLE 3 Learning Preferences according to semester, cycle, and general analysis
| Frequency – absolute, relative (%) | ||||||
|---|---|---|---|---|---|---|
|
|
||||||
| V | A | R/W | K | MM | TOTAL | |
| Semester (p = 0.58) | ||||||
| 01 | 6 (12) | 10 (20) | 4 (8) | 5 (10) | 25 (50) | 50 (9.5) |
| 02 | 9 (18) | 10 (20) | 4 (8) | 10 (20) | 17 (34) | 50 (9.5) |
| 03 | 10 (21.3) | 11 (23.4) | 4 (8.5) | 3 (6.4) | 19 (40.4) | 47 (8.9) |
| 04 | 7 (15.9) | 10 (22.7) | 4 (9.1) | 4 (9.1) | 19 (43.2) | 44 (8.3) |
| 05 | 7 (18) | 8 (20.5) | 2 (5.1) | 6 (15.4) | 16 (41) | 39 (7.4) |
| 06 | 8 (17) | 8 (17) | 2 (4.3) | 2 (4.3) | 27 (57.4) | 47 (8.9) |
| 07 | 13 (21) | 11 (17.7) | 3 (4.8) | 6 (9.7) | 29 (46.8) | 62 (11.8) |
| 08 | 11 (21.1) | 7 (13.5) | 2 (3.8) | 9 (17.3) | 23 (44.3) | 52 (9.9) |
| 09 | 9 (32.1) | 2 (7.1) | 1 (3.6) | 3 (10.7) | 13 (46.2) | 28 (5.3) |
| 10 | 6 (22.2) | 2 (7.4) | 3 (11.1) | 3 (11.1) | 13 (48.2) | 27 (5.1) |
| 11 | 14 (28) | 12 (26) | 5 (10) | 4 (8) | 15 (30) | 50 (9.5) |
| 12 | 12 (38.7) | 7 (22.6) | 1 (3.2) | 4 (12.9) | 7 (22.6) | 31 (5.9) |
| Cycle (p = 0.09) | ||||||
| Basic | 32 (16.8) | 41 (21.5) | 16 (8.4) | 22 (11.5) | 80 (41.8) | 191 (36.2) |
| Clinical | 39 (19.5) | 34 (17) | 9 (4.5) | 23 (11.5) | 95 (47.5) | 200 (38) |
| Internship | 41 (30.1) | 23 (16.9) | 10 (7.4) | 14 (10.3) | 48 (35.3) | 136 (25.8) |
| General Analysis | ||||||
| 112 (21.3) | 98 (18.6) | 35 (6.6) | 59 (11.2) | 223 (42.3) | 527 (100) | |
V: visual; A: aural; R/W: read/write; K: kinesthetic; MM: multimodal
In the semester-based analysis, the multimodal LP predominated (most frequent from 1 st to 11 th period), while visual was the most prevalent in the 12 th . On the other hand, the read/write modal was the least pervasive in all 12 subdivisions.
As for cycles, the most frequent was the multimodal LP (41.8%, 47.5%, and 35.3% for the basic, clinical and internship cycles, respectively – see Figure 2 ). The read/write LP, once again, reached lower frequencies (8.4%, 4.5%, and 7.4% for the basic, clinical and internship cycles, respectively).
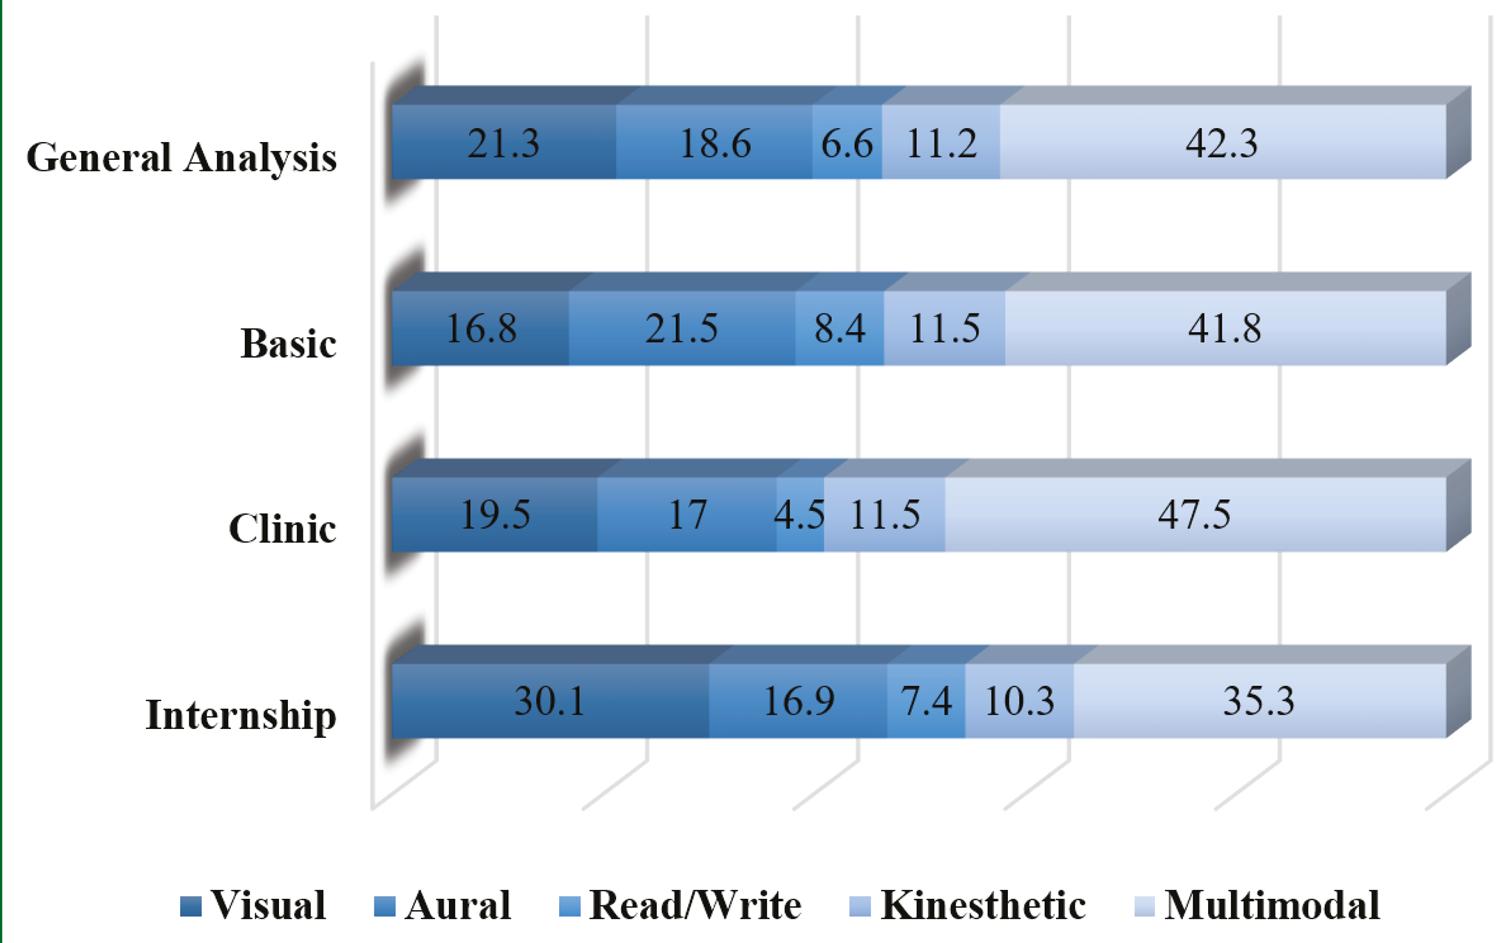
The general analysis revealed, in decreasing order, a preference for the LP: multimodal (42.3%), visual (21.3%), aural (18.6%), kinesthetic (11.2%), and read/write (6.6%).
3.3 Correlation between Learning Preferences and Multiple Intelligences
In addition to their analysis in isolation, LP and MI were correlated, with the aim of identifying associations among their respective parameters. The construction of such an interface between the two cognitive theories initially involved dividing the total student sample (n = 527) into 5 groups, according to the predominant LP. Next, the means and respective standard deviations were calculated for each MI in all 5 groups. As a result, it was possible to observe that students with a predominance of the visual modal attained higher scores for intrapersonal MI (71.9±10.3), for the logical-mathematical MI (69.5±13.2), and for the interpersonal MI (68.1±13.1). Students who were predominantly aural obtained higher scores in the interpersonal MI (70.7±12.1), the intrapersonal MI (69.7±10.4), and the linguistic MI (67.5±11.7). As for students who preferred read/write, the logical-mathematical MI (72.9±10.5), the intrapersonal MI (72.8±10.4) and the linguistic MI (69.3±12) achieved the higher scores. On the other hand, those classified under the kinesthetic modal obtained higher scores in the logical-mathematical MI (73.9±13.3), the interpersonal MI (71.8±12.9), and the intrapersonal MI (71.4±10.9). Finally, multimodal students stood out in relation to the intrapersonal MI (70.6±10.6), the logical-mathematical MI (68.9±14.4), and the linguistic MI (68.6±11.9). The remaining results of these correlations are listed in Table 4 .
TABLE 4 Correlation between Learning Preferences (LP) and Multiple Intelligences (MI) in 527 students
| LP | Mean ± standard deviation | ||||
|---|---|---|---|---|---|
|
|
|
||||
| MI | Visual n = 112 | Aural n = 98 | Read/Write n = 35 | Kinesthetic n = 59 | Multimodal n = 223 |
| Bodily-Kinesthetic | 59.3 ± 14.8 | 55 ± 13.8 | 52.4 ± 15.2 | 64.7 ± 12.7 | 56.8 ± 14.4 |
| Spatial | 66.8 ± 11.4 | 57.8 ± 15.6 | 56.3 ± 14.1 | 65.2 ± 12 | 61 ± 12.9 |
| Interpersonal | 68.1 ± 13.1 | 70.7 ± 12.1 | 61.3 ± 13.3 | 71.8 ± 12.9 | 67.1 ± 13.1 |
| Intrapersonal | 71.9 ± 10.3 | 69.7 ± 10.4 | 72.8 ± 10.4 | 71.4 ± 10.9 | 70.6 ± 10.6 |
| Linguistic | 67.6 ± 11.8 | 67.5 ± 11.7 | 69.3 ± 12 | 69.7 ± 12.2 | 68.6 ± 11.9 |
| Logical-Mathematical | 69.5 ± 13.2 | 66.2 ± 14.9 | 72.9 ± 10.5 | 73.9 ± 13.3 | 68.9 ± 14.4 |
| Musical | 56 ± 16.4 | 60 ± 18.9 | 51.1 ± 17.5 | 58.9 ± 18.6 | 58.9 ± 17.3 |
| Naturalist | 48.1 ± 19.1 | 45.5 ± 19.5 | 43.6 ± 20.3 | 51.8 ± 17 | 47.1 ± 20.2 |
4 – DISCUSSION
The MI theory has been gathering recognition and support, stimulating debate and undergoing tests in different countries. The results of its capacity for optimizing learninghave been observed in diverse contexts, such as in language schools and universities.( 7 , 11 , 12 , 21 )
In this study, the intrapersonal intelligence achieved the highest mean scores not only in 7 out of 12 semesters analyzed, but also in all 3 cycles and, consequently, in the general analysis. Such predominance suggests that teaching strategies associated with the intrapersonal intelligence ( Chart 1 ) should be stimulated, which could increase academic performance and encourage engagement in the learning process.( 12 , 22 , 23 )
Similar results were obtained in a Venezuelan study, in which both intrapersonal and bodily-kinesthetic intelligences reported the highest mean among first-year medical students.( 21 ) However, in the present study, the bodily-kinesthetic achieved the second lowest mean, higher only thannaturalist intelligence – which obtained the lowest scores in terms of semesters, cycles, and general analysis. Similarly, the naturalist intelligence also achieved the lowest means in an Irish MI experiment involving 90 nursing students.( 12 )
The second highest overall score was achieved by the logical-mathematical intelligence, which predominated in semesters 3 and 10. Celik observed, in an experimental study performed in Iraq, the presence of this MI in the top three among undergraduate students, along with intrapersonal and bodily-kinesthetic MI.( 24 )
Linguistic intelligence achieved the third highest overall score in this sample and obtained the highest means in semesters 7 and 12. This MI did not stand out in any of the reviewed studies.
On the other hand, the interpersonal MI, which in this study achieved only the fourth highest overall score, showed quite different results in similar studies. Morillo et al. ( 21 ), for example, observed that this MI obtained the lowest overall score, whereas Sheahan et al. ( 12 ) observed it as having the highest means compared to all the other MI. Differences regarding MI distributions in diverse countries possibly suggest the influence of economic, social, and cultural elements.( 25 )
The MI correlation matrix, which permits figures between -1 (high inverse correlation) and +1 (high direct correlation), revealed exclusively positive indexes. This could help prove the tendency of intelligencesbeing presented not in isolation, but rather in a pattern of positive interdependency. For example, the higher the interpersonal score is, the higher the naturalist MI also tends to be, and vice-versa – even though they might intuitively seem to be quite independent from each other. In this analysis, the most evident correlations were established between bodily-kinesthetic and naturalist MI; bodily-kinesthetic and musical MI; bodily-kinesthetic and spatial MI; musical and naturalist MI; intrapersonal and linguistic MI; and spatial and logical-mathematical MI. Such observations favour the multifactorial interpretation of human cognition, in which mental functions maintain a given degree of reciprocal dependency – even though, occasionally, a given skill may stand out in relation to the others.( 3 )
Regarding LP, the existence of different input preferences among students has been widely discussed.( 1 , 4 ) In 1987, Neil Fleming, in Christchurch, New Zealand, developed a questionnaire which not only identified LP, but also suggested which tools to use and which strategies should be prioritized in each group ( Chart 2 ).( 5 ) By recognizing that many daily activities demand more than one input mode, Fleming indicated that the moments in which only one LP is used or sufficient is rare. In that context, despite there beingfour fundamental LPs, there would also be another possible classification: the multimodality, contemplating those who employ two or more dominating modes. Those who belong in the multimodal group alternate LP according to the context, or they are not satisfied until the information is gathered through all the modes involved.( 13 ) Like the MI theory, suiting teaching methods to the LP could also result in gains for the learning process, as the literature suggests. Furthermore, the application of these questionnaires alone may already improve teaching, since students could feel compelled to adapt their learning strategies when faced with their results.( 26 – 29 )
CHART 2 Description of learning preferences and suggested teaching and/or learning strategies – Adapted (1,2)
| Learning preference | Description / key concepts | Examples of strategies to maximize learning |
|---|---|---|
| Visual | Preference for graphic input and hierarchical information | Mental maps, charts, graphs |
| Aural | Preference for heard or spoken instructions | Classroom lessons, group discussions, self-talk |
| Read/write | Preference for verbal learning (written or read) | Slides, reading, note-taking during classes |
| Kinesthetic | Preference for touch, smell or taste input; and for practical activities – real or simulated | Demonstrative videos, visitations to simulation laboratories, practical exercises (trial and error), diverse sensorial experiences |
1. Fleming ND, Mills C. Not another inventory, rather a catalyst for reflection. To Improv Acad. 1992;11(1):137–50.
2. Fleming ND. VARK Strategies [Internet]. [cited 2017 Aug 20]. Available from: http://vark-learn.com/strategies/
Among Federal University of Paraná’s medical undergraduate students, the multimodal LP predominated (42.3%). That observation possibly reflects the students’ capacity of developing adaptation strategies regarding the several ways in which information have been presented throughout their academic path.( 28 ) In similar studies, carried out in different countries in nearly all continents, the multimodal LP also stood out. In the United States, for example, 63.9% of 166 first-year medical students preferred multiple modes of LP.( 30 ) The same result (63.9%) was observed in a Turkish study involving 155 volunteers who were also in the first year of medical school. ( 19 ) The proportion of students who had the multimodal LP was even higher (68.7%) in an Indian study that analyzed 415 undergraduate medical students.( 18 ) A predominance of the multimodal LP was also noticed among other health science students, such as in an Australian analysis which observed that 56% of 405 chiropractic students were multimodal.( 29 ) In Egypt, 73.7% of 57 postgraduate dental students also preferred the multimodal LP.( 31 )
In our sample, the preference for multimodal learning was manifested in 11 out of 12 semesters, in the 3 cycles, and in the overall analysis. The exception was observed in the 12 th semester, in which the visual LP was the most prevalent (38.7%). Further studies are necessary in order to better investigate the underlying factors that could explain this particular finding.
On the other hand, the read/write preference had the lowest prevalence in 10 out of 12 semesters, in the 3 cycles, and in the general analysis. These results diverge from the literature, such as observed by Lujan et al., ( 30 ) in which visual and aural modes were the least frequent among undergraduate medicastudents. Similarly to that which was discussed for MI, the differences between LP in different countries possibly indicate the influence of economic, social, and cultural factors.( 5 ) It is hypothesized, for instance, that different teaching methodologies to which students from diverse countries have been exposed prior to admission in higher education may have contributed to such divergences. These variations could also be explained by the fact that teaching institutions have different curricula for the undergraduate medical course. This would implicate, for example, in different course stages for the beginning of clinical experience, which are marked by practical nature.( 28 )
Another tendency observed was the increase in the proportion of the visual LP as semesters go by, with an isolated decline in the 4 th and 6 th semesters. The highest discrepancy is identified between the 1 st and 12 th semesters: 12% and 38.7%, respectively. It is also observed a significant decrease in multimodal students’ proportion between 1 st and 12 th semesters (50% and 22.6%, respectively). By analysing the second most prevalent mode in each semester, a pattern shift is observed: from 1 st to 5 th semesters, the second most frequent LP was the aural; in the 6 th semester, aural and visual were observed with the same frequency; and, in the 7th semester, the visual modal became, exclusively, the second most occurrent. The low accordance regarding LP in different stages of the medical undergraduate course was observed in other studies and may reflect students’ capacity of adapting to the predominant teaching style being offered throughout different stages of their undergraduate years.( 28 , 32 , 33 )
When MI and LP – both related to cognitive processes regarding capacities and preferences – were compared, correlations that could have eventually been anticipated intuitively were confirmed. Firstly, the association between the read/write LP and the linguistic MI, both generally related to the skill of perceiving, processing, and understanding the world through words. The second correlation involves the aural LP and, once again, the linguistic MI, which, intuitively, were already interposed due to their strong bind to orality. Additionally, the present work revealed an important correspondence between the kinesthetic LP and the logical-mathematical MI, similar in regard to understanding and processing the world in its practical dimension.( 3 , 5 , 7 , 34 ) However, other associations have not been confirmed by this study, such as the visual LP and the spatial MI; the aural LP and the musical MI; and the kinesthetic LP and the bodily-kinesthetic MI. That may be partially explained by the fact that, despite the similarities between both theories – such as their applicability in teaching and learning – they are not entirely juxtaposed. Potential limitations of the questionnaires might also help explain this observation.
It is known that numerous factors influence learning, such as motivation, self-confidence, and personality. The teaching method also influences the learning process.( 22 ) In the academic context, there is a tendency towards instructing students using, basically, the same strategies throughout the semesters. A classic example of that are theoretical lessons based on slides presentations, which generally involve less efforts in terms of planning and execution. Besides, such a strategy demands less in structural terms and allows more content to be discussed in each session.( 28 ) However, the mapping performed in this study has revealed that students perceive the world, process information, and interact with their respective contexts in distinct ways, distributing their learning predilections in several categories, instead of concentrating on a single one. Furthermore, the heterogeneity is not likely to be limited to students from different semesters in the undergraduate medicalcourse, permeating, instead, the university as a whole – and the literature already indicates differences in terms of LP between medical students and attendees of other courses.( 35 ) This claim supports the idea that students as a group must be recognized in their complexities and particularities regarding learning. In this context, the demand for the implementation of new teaching strategies in this university is reinforced, in which a more multimodal approach would favor the democratization of the learning process.( 11 – 13 )
5 – CONCLUSION
The mapping of MI among undergraduate medical students at the Federal University of Paraná (Brazil) revealed that the intrapersonal intelligence achieved the highest scores in the overall analysis, followed by logical-mathematical and linguistic. On the other hand, the naturalist intelligence obtained the lowest scores. All of the MI were positively intercorrelated.
As for LP, the multimodality was the most commonly observed, followed by visual, aural, and kinesthetic. The read/write preference was the least frequent.
Correlations initially expected between the MI and the LP were confirmed.
In terms of future prospects, it is expected that the present work inspires professors and education managers regarding the need to adapt teaching methods to the students’ preferences, potentially enrichening the exchange of experiences and information in the classrooms. In parallel, it is expected that students use their own results as tools for optimizing their performances not only in the academic setting, but also in professional, social, and personal contexts. Together, MI and LP indicate that it is no longer adequate to solely rely on how smart – in quantitative terms – a given person may be, but rather in which ways.

