


 texto en
  Inglés (pdf)
 Articulo en XML
 Enviar articulo por email
 Permalink
INTRODUCTION
In the area of education, much is discussed about improvements in the existing teaching practices, rethinking teacher training, reformulating curricula, aiming to promote education in which students can be active and participate in their role, developing autonomy and critical thinking in learning process1),(2, in addition to the possibility of exploring the production of knowledge and the transformation of educational paradigms by strengthening creativity3. In this scenario, the teacher ceases to be the center of knowledge, becoming a mediator, an instigator in the learning process, responsible for using different resources to provide students with a constructive pedagogical strategy1),(2.
In the context of medical education, the proposal to base student learning on active methodologies started to be standardized in Brazil in 2001 through the National Curricular Guidelines (NCGs) aimed at medical courses, and became mandatory in the 2014 NCGs, prioritizing the pedagogical proposals aimed at “learning to learn”. Therefore, it provides a unique and active performance for each student, using individual and collective activities, developing not only theoretical knowledge, but also interpersonal relationships, reflection of contents, that is, a constant preparation for the search for knowledge4),(5),(6),(7.
Nevertheless, it is beneficial to use tools that act as modifiers of the current traditional education model in society, guaranteeing the effectiveness of the methodological principles of a transformative education practice. Hence, infographics appear as an instrument to assist with this change, resulting in the commitment of all those involved in its construction process. The infographic is a tool used to synthesize the information displayed in a text. It is an explanation carried out through the association of texts and images (photography, drawings, graphics, anagrams, diagrams, among others) of which purpose is to show concise information, in an attractive, clear and objective way to the reader8. To be effective, infographics must be developed aiming at the quick reading and easy understanding of the addressed topic9.
Through infographics, students can access the most diverse types of content and that can be explored in multiple formats10, that is, it can be an alternative source of information, a source of research and a method for discussion. Thus, this resource can be a great ally for the teacher to develop pedagogical strategies for teaching, due to its dynamic character, its association between text and images that facilitates and improves the teaching-learning process and, above all, encourages students to learn in a playful way, valuing creativity, and not only productivity11. Therefore, this study aims to describe the construction of infographics as a pedagogical proposal for the learning of organic human aging processes by medical students.
EXPERIENCE REPORT
This is an experience report, carried out with students from the fourth period of the medical course at a Higher Education Institution (HEI) in the municipality of Vitória da Conquista, state of Bahia, Brazil, in the second semester of 2019, as a practical content requirement for the module called “Aging Processes”. The proposal designed for the performance of practical classes was the production of infographics, of which main topic was focused on the organic processes of aging, as well as the histological, physiological and /or pathological changes arising from these processes.
Initially, the teacher in charge introduced the concept of infographics to the class, its types, usefulness, websites and free applications with different layouts, so that the groups were able to choose the best way to produce the proposed material. Such an explanation was important to overcome the difficulties posed by the students regarding the understanding of the infographic and its construction process.
A good infographic is the result of research, searches and the definition of a strategy. In this context, the students were guided ‘step by step’, which indicated the fundamental elements for the creation of this tool: definition of the target audience; definition of the objective; choice of topic; selection of the most relevant information (focus); direct and accessible language; organized information; choices of style and color palettes and infographic sketch12.
The static-type infographic3 was adopted, which is characterized by the combination of texts and images (photography, illustration) as a standard for the development of the topics. To address the contents, each group was able to choose a specific theme, according to the drawn topics, as shown in Chart 1, explaining the aging process of that specific organ or system, focusing on histological changes, as well as their pathophysiological alterations.
Chart 1 Proposed and developed topics on the histological human aging processes, Vitória da Conquista - BA, 2019
| Proposed topics | Developed topics |
| Cartilage aging | Degenerative joint diseases |
| Bone aging | Bone weakening |
| Pulmonary aging | Pneumonia in the elderly |
| Cardiac aging | Acute myocardial infarction |
| Central nervous system aging | Vascular dementia |
| Arteriosclerosis | Atherosclerosis |
| Immunosenescence | Herpes Zoster |
Source: Elaborated by the authors.
Through the proposal of the topics presented for the creation of the infographics, students were asked to guide their production based on the following elements: title and subtitle; definition; risk factors; clinical condition; diagnosis; prevention measures and treatments. Subsequently, each group was responsible for presenting their infographic to the other students in the class, detailing the aging process related to their topic, as well as the histological changes resulting from the physiological or pathological aging process, in accordance with the previously listed criteria. This proposal aimed at promoting socialization and the sharing of all the material developed during the semester, thus favoring individual and collective reflection, as well as the learning of all the proposed topics, and not only what each group developed individually. Moreover, the final product of each produced infographic was printed in banner format and displayed at the HEI Histology Laboratory, allowing easy access and providing supporting material for all HEI students.
It is worth noting that the entire process for the infographic creation was monitored by the supervising professor from the conception, research phase, layout sketch, until completion, and each group had to attend the nine pre-scheduled meetings, according to the schedule detailed in Chart 2.
Chart 2 Schedule for the monitoring of activities during the preparation of infographics, Vitória da Conquista - BA, 2019.
| Activities | Groups | Meetings/Schedule |
| Brief explanation of the topics to be addressed in the module. | 1, 2, 3 and 4 | 1st 08:00am - 12:00 pm |
| 5, 6 and 7 | 2nd 08:00am - 12:00 pm | |
| Presentation of the topics to be addressed; division of groups and organization of tasks performed by them. | 1, 2, 3 and 4 | 3rd 08:00am - 12:00 pm |
| 5, 6 and 7 | 4th 08:00am - 12:00 pm | |
| Meeting with the groups: presentation of the infographic structure, layout, and the bibliography used. | 1, 2, 3 and 4 | 5th 08:00am - 12:00 pm |
| 5, 6 and 7 | 6th 08:00am - 12:00 pm | |
| Meeting with the groups: final structure of the infographics. | 1, 2, 3 and 4 | 7th 08:00am - 10:00am |
| 5, 6 and 7 | 8th 10:00am - 12:00 pm | |
| Presentation of infographics by group. | All | 9th 07:00pm - 10:00pm |
Source: Elaborated by the authors.
In addition to the creation stages, the teacher also established criteria for the evaluation process, as the creation of the infographics was closely associated to the practical component of the aging module. Thus, the evaluation took place in a procedural and continuous way, so that each student was individually and collectively evaluated according to the criteria established in Chart 3, also allowing the feedback to be given at the end of the process.
Chart 3 Student evaluation criteria regarding the construction of infographics, Vitória da Conquista - BA, 2019.
| Established criteria for the evaluation of infographics |
| Participation in pre-established meetings with the teacher. |
| Acting as an active member (development of proposed activities). |
| Presentation of the proposed tasks within the established deadlines. |
| Authorship (images and texts). |
| Infographic (clear, objective, coherent, reliable information; correct use of spelling; scientific language; adequate layout). |
| References (current and reliable). |
| Mastery and clarity of information in the oral presentation of the infographic. |
Source: Elaborated by the authors.
In total, seven infographics (Figure 1) were developed by the students, encompassing different body systems, as shown in Chart 1, allowing a global view of the aging process, from the understanding of the pathophysiology, risk factors, presentation of clinical signs and symptoms and treatment measures up to the preventive approaches that are taught in Health Education.
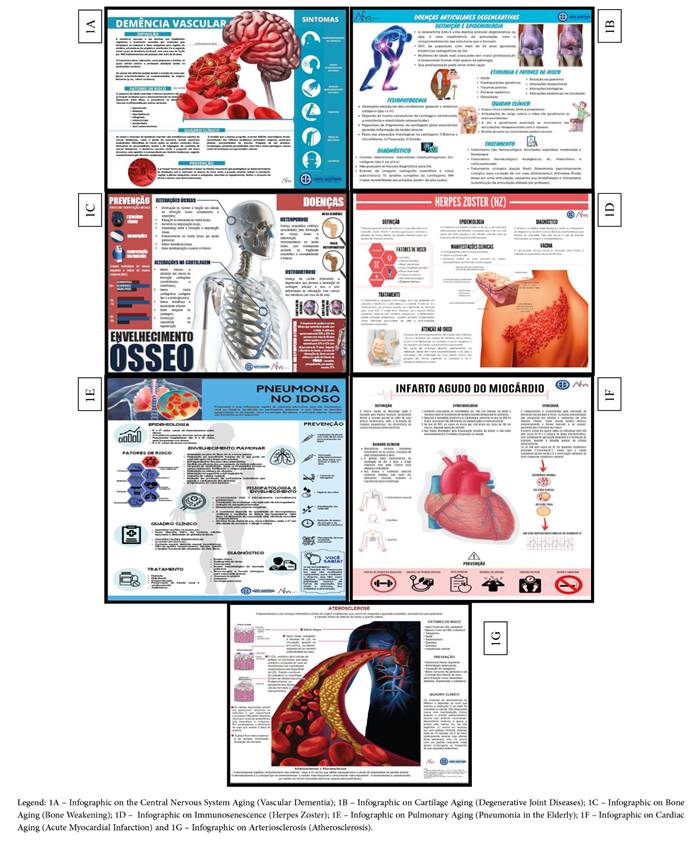
Figure 1 Thematic infographics produced by the medical students, about the organic aging process and associated pathologies, Vitória da Conquista - BA, 2019.
The choice of the infographic as a tool that facilitates the teaching-learning process was made aiming at exploring its potential, among which are: a) The follow-up of each stage of the creation process, providing monitoring of the student’s learning process since it explored, when necessary, each step in the construction of the infographic; b) Development of cognitive skills, such as interpretation, analysis and synthesis; c) Encouragement of the participation in the meetings for the construction of the infographic, due to its dynamic, attractive and objective aspects, stimulating the sense of responsibility, leadership and teamwork; d) Development of a new observation perspective, so that students could perceive fundamental aspects of the addressed topic, considering the problem proposed within its magnitude; e) Possibility of associating different technological resources in the construction of the infographic, in addition to the development of information exposure strategies, which are essential for the routine of a health professional9.
As discussed above, infographics represent a tool that makes it possible, during their construction, for students to develop different ways to express their understanding of the worked topic. The multifaceted character can show several possibilities when it is being structured, as each individual has a specific viewpoint and correlates it according to their interpretation3. Therefore, it can be observed that the students met the requirements established for the proposed evaluation criteria, demonstrating their involvement with the creation of the material and, although we observed difficulty regarding the setting up of the work groups, this limitation was overcome and work skills were developed as a team.
The literature points to the infographic as a potent active methodology tool, so that students can build knowledge in a creative and informative way, through visual graphic communication3),(10. Also, it allows an assessment of the student in a technical and continuous way. Finally, it is worth mentioning that the present report depicts this tool as an evaluation device that encompasses the assessed subject in all their dimensions.
FINAL CONSIDERATIONS
Infographics were successfully used as tools to build the knowledge of medical students, as they allowed individual and collective learning, creativity, reflection, objectivity and the use of graphic language to understand the organic processes of aging.
In addition to the knowledge the students who prepared the infographics acquired, their final product will serve as an instrument for the acquisition of objective knowledge for the students who will attend the histology laboratory, and they can also be used outside the academic scenario, allowing the dissemination of information through this tool and academic production.
The importance of infographics as a practical evaluation device, working as an alternative tool for the evaluation process is also emphasized, since in this model, the evaluation takes place in a procedural and continuous way, taking into account the different characteristics and skills involved and developed by each student.

