


 texto em
  Inglês (pdf)
 Artigo em XML
 Enviar este artigo por email
 Permalink
This paper investigates grade repetition in Portugal using microdata. Drawing on multilevel models, we analyse the number of student grade repetitions in compulsory education - our endogenous variable - in association with individual children’s characteristics, household sociodemographic and economic background, and children’s living conditions - our covariates. Furthermore, we also attempt to shed light on the impact of schools on the endogenous variable. In fact, empirical studies have been researching why children with equal intelligence to that of their wealthier peers continue to pursue unsuccessful academic routes (BURGESS; BRIGGS, 2010; SMYTH; WRIGLEY, 2013). Therefore, besides the influence of the aforementioned factors, we examine whether, and how, specific schools determine academic failure.
The analysis of grade repetition is an important issue because of its meaning - unaccomplished education - but also because it signifies an unproductive investment. For the individual, it has negative consequences on self-esteem, labour market insertion, and social participation (BOYDEN; JAMES, 2014; BUDRIA; MORO-EGIDO, 2008; FERGUSON; MICHAELSEN, 2015). For society as a whole, it represents an unproductive investment (BASTOS et al., 2009) and a threat to human capital, which is an important factor of development for all economies. Furthermore, empirical evidence has demonstrated that those students who were retained are less motivated and are more likely to have behaviour problems and to dropout (ROBISON et al., 2017). Therefore, preventing grade repetition is a target policy action in its own right.
The association of factors such as age, gender, children’s living conditions, and household sociodemographic and economic background with grade repetition is largely documented in the literature. Ferguson and Michaelsen (2015) also register a negative relationship between school outcomes and deprivation. In fact, empirical studies have proved the association of grade repetition with poverty. Corman (2003) notes the importance of individual, family, and neighbourhood characteristics on grade repetition in the United States. In line with this reasoning, being male, living in poverty, living in a single parent family, being African, having parents with low education levels (especially the mother), and having health problems are all factors that increase the likelihood of grade repetition (BASTOS et al., 2009; CORMAN, 2003; EAMON, 2005; FERGUSON; MICHAELSEN, 2015). However, less is known about the importance of the school itself for student’s performance.
This paper examines the determinants of grade repetition. Our aim is twofold: (i) to investigate the association of grade repetition with children’s individual characteristics, sociodemographic and economic factors that characterise their family backgrounds and living conditions and (ii) to analyse whether and how the school itself affects children’s grade repetition. The main contribution of this research to the literature on grade repetition stems from its focus: on children - which is the statistical unit of observation and measurement, as well as on the school per si, through the estimation of a multilevel model. In fact,
[…] the rise of multilevel modelling (MLM) was clearly essential to faithfully represent the reality of educational systems in which students learned or not in accordance with variation in their background characteristics, and in which they attended classes nested in schools, which in turn were nested in Districts/Local Authorities, and which in turn were nested in regions and nations. […] it made possible the handling of multiple variations, differential effects, and cross-level interactions. (in REYNOLDS et al., 2014, p. 202)
For this purpose, we analyse primary data gathered from a survey carried out among children in all compulsory school levels in the district of Mafra (Portugal) in 2014, which resulted in 784 observations. We then estimate a multilevel model that takes into account the influence of these three level determinants - children’s environment and living conditions, class, and the school.
Our research considers three statistical unit levels: the child, the class, and the school. Aside from the analysis of the association between the aforementioned individual, sociodemographic, and economic factors on grade repetition, the use of multilevel models also enables the research of the impact of the school on grade retention, which gives important insights for policies designed to alleviate the disadvantages of deprived children (MORTIMORE; WHITTY, 1997).
After this introduction, the remainder of the paper is organised as follows: section two briefly reviews the literature on the predictors of grade repetition, section three sets out the methodological framework used in the empirical study, the results of which are presented in section four. The main conclusions and the study limitations are to be found in the fifth section.
BACKGROUND
Previous studies on the relationship between grade repetition and children’s attributes (EAMON, 2005; FERGUSON and MICHAELSEN, 2015; FERRÃO, 2015) have proved the importance of two kinds of variables: (i) household economic and socio-demographic characteristics, and; (ii) children’s individual living standards. Besides these variables, the school itself also plays an important role in grade repetition, as we detail in point (iii).
HOUSEHOLD ECONOMIC AND SOCIO-DEMOGRAPHIC CHARACTERISTICS
Family has an important impact on cognitive performance and academic success and therefore on school trajectory (ALVES et al., 2017). Elements such as economic resources, family composition, and parent’s level of education have been considered important determinants of grade repetition in the literature (BROPHY, 2006; MATOS; FERRÃO, 2016). Concerning household economic resources, poverty has been identified as being an important constraint of children’s education (YANG et al., 2018), due to the resources available, as well as through the familial everyday life stress that conditions their involvement with school (ANDRESEN; MEILAND, 2018). Poor children often have a more difficult access to playful and educational materials, which limits their cognitive development (BRADLEY; CROWYN, 2002; BURGER, 2010). These resources are particularly important in childhood, when a lack of them has a negative impact on later school achievement (RINDERMANN; FLORES-MENDOZA; MANSUR-ALVES, 2010), which points out the importance of investment in early childhood as a possible way of breaking the poverty intergenerational cycle (ALMOND; CURRIE, 2011).
With regards to family composition, empirical studies such as those of KACZALA (1991), CORMAN (2003), and more recently ROBISON et al. (2017), all found that living in a single parent household, being born to a teen-aged mother, and having at least two siblings in the household contributes to fail at school. This relationship is not linear, as it may be highly conditioned by the living conditions of these families, resulting in a negative impact in terms of school involvement. In fact, according to the EUROSTAT statistics, such families are more at risk of poverty or social exclusion. With respect to parent’s level of education, the literature often refers to the correlation of this factor with children’s school success (ALVES et al., 2017; FERGUSON; MICHAELSEN, 2015; ROBISON et al., 2017). Parents with low levels of education may value education less and they are less able to follow and provide inputs to the work of their children at school. Furthermore, family involvement has a significant impact on children’s cognitive development and therefore with school success (ALVES et al., 2017). The role of the mother’s level of education seems to be particularly important as a predictor of children’s cognitive performance (GUTMAN; SAMEROFF; COLE, 2003), as well as of children’s school achievement (BROWN; PARK, 2002; CORMAN, 2003).
CHILDREN’S INDIVIDUAL LIVING STANDARDS
In the school context, studies have identified that sociodemographic characteristics, as well as housing, health, and social participation are important determinants of grade repetition. Regarding children’s individual sociodemographic characteristics, attributes such as age, gender, race, and ethnicity have been associated with grade repetition by researchers.
Empirical studies have shown that as children get older, the likelihood of grade repetition increases (CORMAN, 2003). Longitudinal data analysis on school education trajectories have also found that children who fail at early stages are less harmed than those who fail at later stages (ALEXANDER; ENTWISLE; DAUBE, 1994; BOYDEN; JAMES, 2014). Based on PISA (Programa Internacional de Avaliação de Estudantes) data other authors found that in Brazil and Portugal, early repetition appears to be a strong predictor of later repetition (FERRÃO, 2015; FERRÃO; COSTA; MATOS, 2017).
Regarding gender, girls often have a higher involvement with school and their likelihood of failure is lower than boys (CORMAN, 2003; CORREA; BONAMINO; SOARES, 2015; FERNANDEZ-ZABAL et al., 2016; FERRÃO, 2015; MATOS; FERRÃO, 2016). In addition, other authors considered gender differences on grade retention and found that girls take a higher burden from grade retention (GHAZVINI; KHAJEHPOUR, 2011). In terms of housing living conditions, the neighbourhood environment is necessarily interlinked with the economic status of the family - poor households often live in disadvantaged neighbourhoods and in overcrowded houses. However, apart from this, theories of neighbourhood effects on children refer that peers and adults play an important role in children’s behaviour and attitude to school. Therefore, epidemic or contagion theories point out the potential negative effects of collective socialisation on children in these areas (AUGHINBAUGH; ROTHSTEIN, 2014). They also refer to the importance of social services in these neighbourhoods, as these may diminish their deprived living conditions. These services can create heterogeneous environments suggesting a need for caution in the analysis of the effect of this variable.
Children’s health is an important determinant of their physical and cognitive development. In this context, adequate nourishment and medical care play an important role. Having health or behavioural problems increase the likelihood of repeating a grade (CORMAN, 2003). Not having enough food is an absolute deprivation in the space of capabilities, in the sense of Sen (1999), with negative effects on children’s physical and cognitive development, and is also a restriction of their participation in the process of education (REDMOND and SKATTEBOL, 2017).
This restriction also applies to adequate clothing, for not having the right clothes is an important issue per si (physical need), and also a determinant of social participation and engagement in education (REDMOND; SKATTEBOL, 2017). In terms of social participation, the economic constraints of poor households strongly determine the range of social and cultural activities of their children. In these contexts, school and public services are central in shaping children’s experiences (BESSELL, 2018).
SCHOOL
School achievement is an important determinant of success in adulthood. However, doing well at school is conditioned by attending good schools (BARBOSA; FERNANDES, 2001; MORTIMORE et al., 1988). As Burgess and Briggs argue, “schools matter and school differ” (2010, p. 639). In this context, school assignment plays an important role on social mobility.
In Portugal like in other countries, the distance between house and school is one of the criteria of school admission. There is a relationship between poverty and school assignment (BURGESS; BRIGGS, 2010), as spatially-concentrated demand increases housing costs. In fact, poor households often live in disadvantaged neighbourhoods, where schools often have deteriorating resources and a non-stable faculty of teachers, compromising school quality (PEREIRA JÚNIOR; OLIVEIRA, 2013; ROBISON et al., 2017). Burgess and Briggs (2010, p. 647) argue “there is a clear link between poverty location and school quality”. Besides the negative effects of living in disadvantaged neighbourhoods discussed above, children’s academic performance in these areas strongly depends on their teachers and on school quality (MORTIMORE; WHITTY, 1997). Furthermore, there is commonly an assumption that children from disadvantaged neighbourhoods have serious deficits in their educational capabilities. Therefore, they are only able to learn the basic requirements, or an “emaciated and dumbed down educational diet” (ZYNGIER, 2015, p. 82).
School assignment processes perpetuate disadvantages that can potentially affect student’s success (GOLDSTEIN; NODEN, 2003). In this sense, social inequalities turn into school inequalities and these boost the latter, configuring a vicious cycle of social class reproduction (ALVES et al., 2017). Schmidt et al. (2015, p. 374) say that, “Unequal learning opportunities are often treated as occurring between schools. In the United States, there is considerable public attention on the problem of ‘failing schools - schools that are often high poverty, have a large proportion of minority students, and are lower achieving.”
Although several studies recognise the importance of school itself as an important determinant of school success, in Portugal there is little research on grade repetition considering this factor. Our aim is to disentangle the factors of grade repetition, considering the school per si, besides the individual and household characteristics.
DATA AND MODEL
The data used in this study were gathered through a questionnaire specifically constructed for the purpose of this study, applied to a random sample of 923 students (around 15% of the population), aged 6 to 18 years old, living in the district of Lisbon (Mafra county), attending public and private schools, during the school year of 2014-15. We used a stratified sample procedure proportional to school and class dimension in order to guarantee the representativeness of the dataset. Schools with less than five students in the sample were excluded for the purpose of modelling. The sample size was reduced by 28, due to school exclusion, and by 111, due to missing data. Thus, the size of the working sample is 784. We assume that the missing data occurred completely at random (LITTLE; RUBIN, 2002).
Following the research conducted by Bastos, Fernandes e Passos (2009), we used a count-data model to analyse the relationship between the number of student grade repetitions and the set of covariates. Specifically, we are interested in understanding the relationship between the number of grade repetitions for each student and their individual characteristics, such as poverty2, gender, family sociodemographic and economic background, and living conditions in terms of health, housing, and social participation. The linear predictor also includes the year of schooling as a controlling variable, which varies from two to twelve. In practice, the longer the student’ schooling trajectory, the higher is the probability of failure.
In this paper, we assume that Y follows a Poisson distribution with parameter λ, and that the generalised linear model with random effects takes into account the heteroscedasticity of Y, due to the hierarchical structure of the educational population. A three-level model with the canonical link function was applied, considering the student at level one, the class at level two, and the school at level three. Thus, for each pupil i in class j and school k, Y represents the number of failures or the number of grade repetitions, and the observed counts are y ijk , where i=1,...,n jk , j=1,...,J k and k = 1,..., K, with n jk representing the number of students in class j and school k, J k the total number of classes in school k, and K the total number of schools. The event Y can occur 0, 1, 2, or 3 times per student, and its average is λ, or Y~Poisson(λ ijk ) where:
Equation (1.1) defines the linear predictor of the model, and equation (1.2) defines the random components at Level 2 (u0
jk
) and at Level 3 (v0
k
). The probability distribution assumptions for random components are - u0
jk
~N(0,
A second set of equations was specified in order to check whether the parameter β6 also varies randomly:
The probability distribution assumptions for the random components are as follows
This model includes two additional random parameters for Level 3. The variance
The indexes of housing, health, and social participation were obtained by the classical factor analysis method (BROWNE; SHAPIRO, 1980; MOOIJAART; BENTLER, 1991) applied to students’ data. Factor analysis is a multivariate technique which aims to approximate the p original variables of a dataset by linear combinations of a smaller number of factors. Three factor analyses were conducted, one per index, and the principal factor of each analysis was selected as the index of housing, health, or social participation. The housing index includes information about house size and environment, as well as children’s specific living conditions, commonly-used examples being the existence of a single bed for the child and a place for study. The health index comprises information on medical assistance, nourishment, and development. Finally, the social participation index concerns issues related to extra-curricular activities, play and social living habits, and individual evaluation of wellbeing.
EMPIRICAL FINDINGS
The descriptive statistics of the covariates used in the models are summarized in Table 1. The covariates related to mother and father education consider three categories: primary, medium and high. The primary category includes the basic level of education (ISCED3 0, 1 and 2), the medium category refers to secondary and professional education (ISCED 3) and the high category concerns to higher education (ISCED 4 to 8). The sample consists of 46% boys and 54% girls, the empirical distribution of mother’s education is: 7.6% have no more than ISCED 2 level, 62.3 have no more than ISCED 3 and 30.1% attended any level of higher education. The distribution for father’s education is, respectively, 8.9%, 72.2%, and 18.9%. The percentage of students classified as “poor” is 28.6%.
TABLE 1 VARIABLE DEFINITIONS AND SUMMARY STATISTICS
| VARIABLE | MIN | MAX | MEAN | SD | PROPORTION | N MISSING |
| Male | --- | --- | --- | --- | 0.46 | 7 |
| Mother’s education ≤ ISCED 2 | --- | --- | --- | --- | 0.076 | 11 |
| ISCED 2 < Mother’s education ≤ ISCED 3 | --- | --- | --- | --- | 0.623 | 11 |
| ISCED 3 < Mother’s education ≤ ISCED 8 | --- | --- | --- | --- | 0.301 | 11 |
| Father’s education ≤ ISCED 2 | --- | --- | --- | --- | 0.089 | 56 |
| ISCED 2 < Father’s education ≤ ISCED 3 | --- | --- | --- | --- | 0.722 | 56 |
| ISCED 3 < Father’s education ≤ ISCED 8 | --- | --- | --- | --- | 0.189 | 56 |
| Poverty status | --- | --- | --- | --- | 0.286 | 6 |
| Housing index | -12.502 | 1.511 | 0.012 | 0.937 | --- | 13 |
| Health index | -5.941 | 1.016 | 0.000 | 1.000 | --- | 27 |
| Social participation index | -2.649 | 1.940 | -0.013 | 1.000 | --- | 7 |
Source: Own calculation (2019).
The indexes for housing, health and social participation are fitted to have approximately standard normal distribution.
The dependent variable - the number of grade repetitions per student until the year of the inquiry - is censored at three or more, and is comprised of 82.9% of students without failures, 11.9% with one failure, 3.9% with two failures, and 1.3% with three or more failures. The null model, that is, the multilevel Poisson model without covariates, suggests that the log of the expected number of repetitions varies across classes (28%) and across schools (72%), according to the model assumptions referred in the previous section. This result denots the schools role on the dependent variable.
The results presented in tables 2 and 3 concern the models defined by equations (1.1) and (1.2) and by equations (2.1) and (2.2), with and without the covariates father’s education and housing index, respectively. The estimates show that the coefficients related to gender, mother’s education, poverty status, student’s health, social participation and school year attended are statistically significant at the level of 5%. Low mother’s education level, being poor, being male, having deficits in health and in social participation and being enrolled in higher grades, increase the likelihood of grade repetition. This is particularly true for the first three variables referred, in line with the results presented in other empirical studies referred earlier in section 2 (ANDRESEN; MEILAND, 2018; CORMAN, 2003; FERNANDEZ-ZABAL et al., 2016). The results also suggest that the student’s number of grade repetitions is not statistically associated with housing index and father’s education, at 5% level of significance. Such covariates were removed from the linear predictor and results are presented in the 3rd and 4th columns of Tables 2 and 3. The increased estimate of mother’s education coefficient demonstrates its higher importance on the dependent variable, but also seems to catch the omitted relationship with father’s education. The number of valid cases also increases since approximately 6% of students miss to declare father’s education. In addition, some pairs of variables are moderately correlated with each other. Thus, there is an hypothetical concern that multicollinearity could mask the association between some of these characteristics and the response variable. For instance, the correlation between mother’s and father’s education is weak-moderate (the Spearman coefficient varies between 0.3 and 0.5). However, the stability in regression analyses precludes the inexistence of such kind of multicollinearity problem. Therefore, we consider the second set of estimates in Table 3 as the final model.
According to the Poisson regression model, the expected count of repetitions for a male student is given by the exponential function of the correspondent estimated model coefficient. Therefore, the difference in the expected counts is 1.351 units higher for boys compared to girls, while holding the other variables constant in the model. This result shows that boys have higher probability of grade repetition than girls, in line with previous empirical findings referred earlier.
In order to detail our empirical findings we then present some examples to illustrate the interpretation of the estimates included in the final model (Table 3). For instance, for male students, the log of the expected count for grade repetition is 0.301 units and the expected count is given by exp(-3.162 + 0.301)= 0.057. As another example, the extreme disadvantaged student, whose mother’s education is less than ISCED 2, male, poor, health and social participation scores 3 standard deviation below the mean, and at the 9th grade, the log of the expected number of grade repetitions is 0.717, corresponding to the expected count of approximately 2 repetions (2.048). The expected count of repetitions of students whose mother’s education level is low (ISCED ≤ 2) is 2.573 higher than for those whose mother’s education is higher (ISCED > 2), given the other variables are held constant. By the same reasoning and regarding poverty status, poor students are expected to have 1.498 higher number of repetions than the non-poor students, while holding the other variables constant in the model. Moreover, if a student were to increase his/her health score by one point, the difference in the logs of expected counts would be expected to decrease by 0.34, controlling for the remaining variables. Similar reasoning, if a student were to increase his/her social participation score by one point, the difference in the logs of expected counts would be expected to decrease by 0.193 unit, while holding the other variables constant.
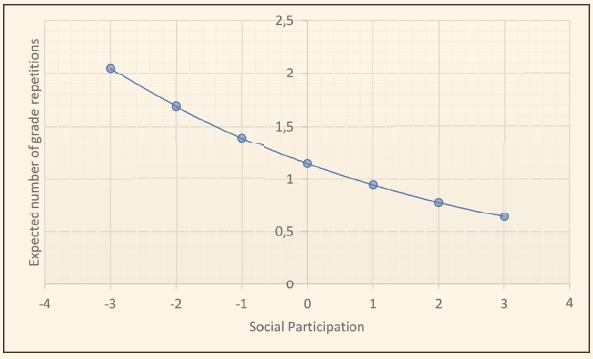
Suppose the example of the extreme disadvantaged student presented above, and assume that is possible to vary his/her social participation score from -3 standard deviations up to 3 standard deviations, controlling all other variables. The change per unit of social participation has a different effect on the expected number of grade repetitions. Such change per unit is known as the variable marginal effect. It was computed for 9th grade. Figure 1 illustrates the marginal effect of social participation on the expected number of grade repetitions. In fact, the marginal effect tells us how much the probability of repeating one more year changes when the student’s social participation score changes by a unit, with other covariates to be held constant. It can be observed that the expected count of repetitions ranges from 2 to less than one as the social participation score ranges over the scale.
Regarding the random parameters, the variance component model suggests the intercept varies across classes and across schools meaning that, after controlling for gender, poverty status, parents’ education, student’s health and social participation, grade attended, the residual variance of the log number of grade repetitions may be attributed to class and school differences. Thus, the final model residual variance (0.448) shows that 58% of the initial variance was explained by the model. The decomposition of such explained variance by hierarchical levels, suggests that the variance explained across schools (65% of the initial level 3 variance) was higher than the variance explained across classrooms (39% of the initial level 2 variance). Although the variables included in the model represent individual and family characteristics of students, we found that their explanatory capacity reduces more the variability across schools than within school variability. However, the residual variance is still stronger at the school level (59%) than at the classroom level (41%), pointing out once again the importance of the school effect on grade repetition.
In addition, the estimates of random parameters presented in Table 3 suggest that the coefficient related to social participation also varies randomly across schools, meaning that the effect of such student’s attribute may or may not influence the child’s number of grade repetitions depending on the school he/she attends.
In summary, the estimates obtained by the random coefficient model, confirm the importance of children’s individual and familial characteristics, living conditions and the school itself as predictors of grade repetition - the research questions of this investigation.
TABLE 2 ESTIMATES OF THE THREE LEVEL POISSON MODEL FOR NUMBER OF GRADE REPETITIONS
| PARAMETER ESTIMATE | EXPECTED COUNT | STANDARD ERROR | PARAMETER ESTIMATE | EXPECTED COUNT | STANDARD ERROR | |
| ALL FIXED PARAMETERS | FIXED PARAMETERS WITH α=5% | |||||
| Constant | -3.604 | 0.027 | 0.405 | -3.076 | 0.046 | 0.353 |
| Boy (1) vs. Girl (0) | 0.364 | 1.439 | 0.174 | 0.299 | 1.349 | 0.149 |
| Mother’s education ≤ ISCED 2 (1) vs Mother’s education > ISCED 2 (0) | 0.662 | 1.939 | 0.214 | 0.942 | 2.565 | 0.175 |
| Father’s education ≤ ISCED 2 (1) vs Father’s education > ISCED 2 (0) | 0.447 | 1.564 | 0.230 | --- | --- | --- |
| Poverty status (poor=1) | 0.415 | 1.514 | 0.183 | 0.404 | 1.498 | 0.166 |
| Housing index | -0.084 | 0.919 | 0.052 | --- | --- | --- |
| Health index | -0.240 | 0.787 | 0.077 | -0.261 | 0.77 | 0.081 |
| Social participation index | -0.278 | 0.757 | 0.088 | -0.192 | 0.825 | 0.068 |
| Grade or School year | 0.088 | 1.092 | 0.041 | 0.065 | 1.067 | 0.030 |
| Random effect at level 2 (class) | 0.228 | 0.139 | 0.194 | 0.117 | ||
| Random effect at level 3 (school) | 0.234 | 0.164 | 0.199 | 0.138 | ||
| Number of cases | 784 | 838 | ||||
Source: Authors’ elaboration.
Source: Authors’ elaboration.
FIGURE 1 MARGINAL EFFECT OF SOCIAL PARTICIPATION FOR STUDENTS ATTENDING THE 9TH GRADE
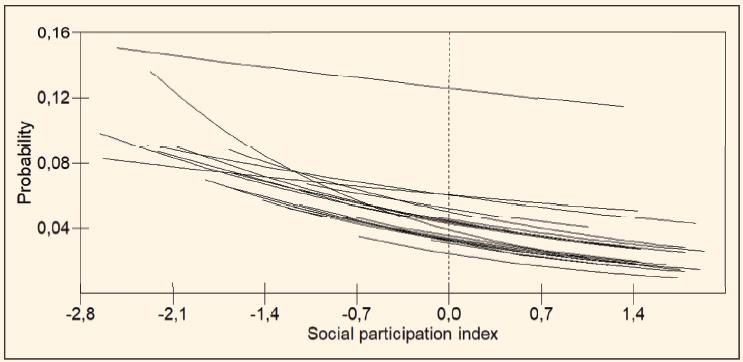
The estimates of fixed coefficients in Table 3 remain stable in comparison to those in Table 2. However, the statistical significance of the level 3 variance-covariance matrix suggests that the relationship between the dependent variable and social participation varies across schools, and that the higher the average per school, the lower the estimate of the coefficient that quantifies the relationship between students’ social participation and the probability of grade repetition, as illustrated in Figure 2.
The curves are fitted separately for each school. They show that the relationship between the probability of grade repetition and the social participation index depends upon which school the pupil attends. For instance, a student with a social participation score around -2 has a probability of failure that can be 0.08, 0.10, or 0.15, depending upon the school he/she attends, assuming that all other explanatory variables are controlled. This important result points out the importance of the school itself on grade repetition, with significant policy implications that will be discussed in the next section. The individual school curves show very little variability in the probability of failure when social participation demonstrates positive values. In addition, we observe that there is a curve that seems to be an outlier, regarding the relationship between the social participation and the probability of repeating once more4. We included a fixed effect for such school and the respective interaction with social participation in the linear predictor of the model. We verified that the respective fixed parameters are not statistical significant and the random parameter estimate decreased from 0.046 to 0.039, remaining statistical significant at the level of 5%, and suggesting that the estimates in model 3 are not significantly affected by the eventual exclusion of this school from the model.
TABLE 3 ESTIMATES OF THE THREE LEVEL POISSON MODEL FOR NUMBER OF GRADE REPETITIONS. RANDOM COEFFICIENT OF SOCIAL PARTICIPATION
| PARAMETER ESTIMATE | EXPECTED COUNT | STANDARD ERROR | PARAMETER ESTIMATE | EXPECTED COUNT | STANDARD ERROR | |
| ALL FIXED PARAMETERS | FIXED PARAMETERS WITH α=5% | |||||
| Constant | -3.652 | 0.026 | 0.410 | -3.162 | 0.042 | 0.357 |
| Boy vs. Girl | 0.362 | 1.436 | 0.174 | 0.301 | 1.351 | 0.149 |
| Mother’s education ≤ ISCED 2 (1) vs Mother’s education > ISCED 2 (0) | 0.686 | 1.986 | 0.214 | 0.945 | 2.573 | 0.176 |
| Father’s education ≤ ISCED 2 (1) vs Father’s education > ISCED 2 (0) | 0.445 | 1.576 | 0.230 | --- | --- | --- |
| PARAMETER ESTIMATE | EXPECTED COUNT | STANDARD ERROR | PARAMETER ESTIMATE | EXPECTED COUNT | STANDARD ERROR | |
| ALL FIXED PARAMETERS | FIXED PARAMETERS WITH α=5% | |||||
| Poverty status (poor=1) | 0,409 | 1.505 | 0.183 | 0.404 | 1.498 | 0.166 |
| Housing index | -0,084 | 0.919 | 0.052 | --- | --- | --- |
| Health index | -0,242 | 0.785 | 0.077 | -0.340 | 0.712 | 0.104 |
| Social participation index | -0,313 | 0.731 | 0.107 | -0.193 | 0.824 | 0.069 |
| Grade or School year | 0,091 | 1.095 | 0.041 | 0.070 | 1.073 | 0.030 |
| Random effect at level 2 (class) | 0,208 | 0.135 | 0.182 | 0.115 | ||
| Random effect at level 3 (school) |
|
|
|
|
||
| Number of cases | 784 | 838 | ||||
Source: Authors’ elaboration.
CONCLUDING REMARKS
In this research, we attempted to analyse the determinants of grade repetition. We consider three level models in our analysis that is individual characteristics at student level, class and school level. The main contribution of this study lies in recognising the importance of hierarchical structure, demonstrating the significance of the school itself, independent of the individual determinants of grade repetition. The methodology used can easily be extended to other datasets.
From a policy angle, the results obtained imply that educational planning and grade repetition programmes should take into account not only the child socioeconomic context and individual characteristics, but also the specificities of the school, in order to avoid differences in school quality.
In terms of social policy implications, empirical studies have shown that policies that increase the economic resources of low-income families and the environment of disadvantaged neighbourhoods (infrastructures and services) may have positive effects on children’s cognitive and non-cognitive skills development. These effects may be critically important as determinants of school success, as well as in later employment outcomes.
Besides these interventions, the development of policies that stimulate parent’s involvement have also been proved to promote positive school functioning and children’s achievement. Early school intervention also has been mentioned as providing an important contribution to school success. In fact, empirical evidence indicates that early investment in children may decrease the negative association between living in a social and economic disadvantaged environment and school attainment. The results obtained prove the strong association between poverty and grade repetition, pointing out the importance of school success in the social policies developed to cope with child poverty. In fact, education has been proved to be an important means of breaking the family cycle of poverty. The school plays an important role in poverty action plans, by its educational function but also by its potential means of empowerment, which is a highway of escaping poverty.
Having provided evidence of the importance of social policies in the context of grade repetition, it is now time to develop programmes that may attempt to improve the quality of schools in disadvantaged environments, which leads to the direction of breaking the intergenerational poverty cycle. The results discussed suggest a potential opportunity for social policy intervention to reduce the disparities of opportunities of children and to promote school success. The dataset used in this research considers the child as the unit of observation and as the unit of measurement, which is a perspective that required the application of a survey specifically constructed for this study. In fact, there is a scarcity of child-centred microdata in the context of grade repetition analysis in Portugal. However, the observations used refer to a specific moment in time. The use of panel data would certainly improve the information gathered concerning children, as well as schools.
Within educational and social research, the benefit of longitudinal studies has been acknowledged (BOYDEN; JAMES, 2014). With regards to education, the analysis of educational trajectories gives important insights about the determinants of grade repetition, as it enables one to shed light into the process that culminates in school retention. In addition, the use of qualitative data would also be important, especially regarding the perspective of children on their educational experience, or the school’s development constraints.

