


 Inglês (pdf)
 Artigo em XML
 Enviar este artigo por email
 Permalink
Introduction
In 2004, the National Assessment System for Higher Education (Sinaes) was created through Lei n. 10.861, de 14 de abril de 2004, in Brazil. It was idealized in order to assess the quality of higher education institutions (HEI), their undergraduate programs, and student achievement. It targets various areas of education including teaching, research, extension and outreach, social responsibility, program coordination, faculty, and facilities. Many instruments are used to assign grades to each of these and provide a quality indicator-based overview of undergraduate programs and HEI in the country (Brasil, 2004).
One of Sinaes’ quality indicators is the Indicator of Difference Between Observed and Expected Achievements (IDD). It measures the value that an undergraduate program adds to the development of its seniors by examining their achievements on the Enade in comparison to their developmental characteristics at the beginning of their study track (Brasil. Inep. Daes. CQCQES, 2017c). In other words, the IDD, which is the object of this study, aims to quantify how much each program enhances student achievement throughout their undergraduate studies. Such a notion assumes that education is a process of continuous transformation, one which empowers students and adds value to them (Harvey; Green, 1993). This is consistent with Austin (1980), according to whom quality should be considered a continuous process that also includes assessing how much an institution contributes to its students’ intellectual, cultural and social development.
This study aims to show the impact of changing the IDD estimation methodology on the quality levels of undergraduate programs in Brazil. Specific objectives include: (1) comparing the Sinaes value-added models that have been developed since the system’s creation; (2) ranking Brazilian undergraduate programs based on the different value-added models available; (3) measuring school effectiveness according to its value-added.
The literature suggests that different methods of estimating academic gain produce different findings (Kim; Lalancette, 2013; Liu, 2011; Melguizo et al., 2017; Pike, 2016; Steedle, 2012). Like any other assessment model, value-added models (VAM) cannot be the only parameter to guide or determine public policies, and its modeling requires caution in measuring school and family-related characteristics, in order not to reinforce the disadvantages of HEIs that have a relatively high percentage of students from lower socioeconomic backgrounds. Yet, it is still possible to use VAM findings to compare the units under scrutiny by looking into the institutions’ achievements against the mean, which includes all other institutions (Liu, 2011; Braun; Chudowsky; Koening, 2010).
This study is relevant not only because of its theoretical contribution to using VAM to measure the quality of undergraduate programs in Brazil but most importantly because it scrutinizes the advantages or disadvantages that an institution may have depending on the model used for assessment. The inconsistent definition of the IDD estimation methodology since 2006 has had a significant impact on the ranking results of many institutions, with implications for their brands (meaning prestige), allocation of financial resources, and access to public funding.
Higher education assessment in Brazil
The numbers for undergraduate studies have increased significantly over the last decade in Brazil: overall, new students have increased 51%, enrollment has increased 56.4%, and graduations have increased 52% (Brasil. Inep, 2018a). Because of this significant growth, social pressure has increasingly demanded accountability, disclosure of assessment findings, and measuring of the quality resulting from public investments in education. Educational assessments have been prominent in the country since the 1990s but the current system, Sinaes, was established in 2004.
Several instruments are used to assign scores to each of these areas (Brasil, 2004). Institutional assessment is based on self-assessment conducted by a specific HEI commission, external evaluation conducted by peers, the higher education census, and the institution’s registration data. The institutional assessment considers tencriteria, namely: 1) mission and institutional development plan; 2) policies for teaching, research, graduate studies, extension and outreach; 3) social responsibility; 4) communication with society; 5) personnel policies, faculty and staff careers; 6) management organization; 7) physical infrastructure; 8) assessment planning; 9) student service policies; 10) financial sustainability (Brasil. Inep, 2018a).
The assessment of undergraduate programs involves three sub-areas, namely: pedagogical teaching structure, faculty profile, and physical facilities. All programs undergo three different stages of assessment: one for authorization (before starting a new program), one for recognition (when the first class studying in the new program is halfway through the course), and one re-assessment for renewal of recognition (repeated every three years after initial recognition). Finally, the assessment of undergraduate student achievement is performed through the Enade exam.
Based on these different assessment instruments, the government releases indicators that 1) measure the quality of Brazilian undergraduate programs and HEI and 2) support the development of policies for higher education. All data are public and retrievable from the Inep website. Figure 1 shows how the Sinaes instruments are related to the quality indicators used in (re)assessment processes.
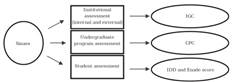
Quality indicators are expressed on a continuous scale from 1 to 5, with levels equal or above 3 indicating satisfactory quality. The General Index of Programs (IGC) is an indicator used to estimate quality in HEI; the Preliminary Program Quality Level (CPC), the Indicator of Difference Between Observed and Expected Achievements (IDD), and the Enade are indicators used to estimate quality in undergraduate programs. While the CPC aims overall understanding of course quality, the IDD aims to estimate the value-added by the undergraduate program to the senior’s achievement; and the Enade aims to measure student achievement by means of a standardized exam. Figure 2 shows the current methodology (as of 2020) for estimating each quality indicator.
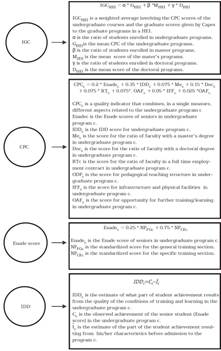
Source: Elaborated by the authors based on Brasil. Inep. Daes. CGCQES (2018a, 2018b, 2018c, 2018d)
Figure 2 Current methodology for estimating the Sinaes quality indicators
As it can be seen in Figure 2, the CPC is a weighted sum of means related to student achievement (i.e., IDD and Enade scores), faculty characteristics (i.e., type of employment contract falling under ‘RT’, the ratio of faculty members with a doctoral degree or Ph.D. falling under ‘Doc’ and a master’s degree under ‘Me’), and the program structure in the students’ perception (opportunity for further training/learning is covered by ‘OAF’, pedagogical teaching structure by ‘ODP’ and infrastructure by ‘IFF’). Before estimating the CPC, all these variables are standardized (how far from the mean a score is) and transformed into a new scale from 0 (poor) to 5 (excellent) as follows:
(1)
where 1) the lower and upper APs (standard score) in measure are the standard deviation for the program, and 2) the lower and upper APs greater than │3│ are outliers and excluded from the indicator estimation. No changes have been applied to this rule or to the methodological procedures of standardization and scale transformation.
Since its inception in 2006, three indicators have undergone several changes aimed at their improvement, as reported in the Normas técnicas: Enade, IDD and CPC (Brasil. Inep, 2018a; Brasil. Inep, 2009; 2015; Brasil. Inep. Daes, 2012). Changes in the Enade happened in 2011. From the beginning until 2010, freshmen and senior students were required to take the Enade exam. From 2011 to date the Enade became only required for senior students. The IDD has gone through 4 different methodologies to calculate (the observed senior achievement) and (the estimate of student’s achievement resulting from his/her characteristics when entering the course).The first method took place until 2010. The IDD estimation included the Enade scores of both freshmen and seniors checking personal and institutional characteristics:
(2)
where: c is the senior’s Enade score in a given year; i is the freshman’s Enade score in that same year; w is the ratio of students whose parents had higher education; z is the ratio of seniors and freshmen; Doc is the ratio of faculty members with a doctoral degree/Ph.D.; Me is the ratio of faculty members with a master’s degree; RT is the ratio of full-time faculty members; IFF is the score for infrastructure and physical facilities; ODP is the score for pedagogical teaching structure; and e is the random error of the equation (Brasil. Inep, 2009a).
After estimating regression parameters, they are used to estimate the Enade score (<mml:math><mml:mover accent="true"><mml:mrow><mml:mi>i</mml:mi></mml:mrow><mml:mo>^</mml:mo></mml:mover></mml:math>), as in equation 3. The IDD was calculated as the average difference between the actual Enade score (c) and the estimated score (<mml:math><mml:mover accent="true"><mml:mrow><mml:mi>i</mml:mi></mml:mrow><mml:mo>^</mml:mo></mml:mover></mml:math>) of all students in a specific program
Significant changes occurred in the estimation of the CPC from 2011 onwards, influenced by Fernandes et al. (2009) - the former president of Inep, director for educational studies, coordinator, and the general coordinator for educational instruments and measures, respectively. Their study aimed to analyze the purpose, quality, and consistency of quality indicators IDD and CPC while also providing a new, “ideal” estimation methodology that would show the actual contribution of the undergraduate programs to their students’ learning (Fernandes et al., 2009, p 5). Zoghbi, Moriconi, and Oliva (2010) also argued that using the Enem score was a more effective and efficient procedure for estimating the IDD than freshmen’s Enade scores. Efficiency, in this case, is a result from the reduced cost of using the Enem scores and not having freshmen take the Enade while effectiveness is a result of students’ strong incentive to take the Enem (as it was already part of the admission process to most undergraduate programs countrywide), which tends to provide a better quality indicator for prior achievement.
Therefore, in 2011 and 2012, the IDD (C - Î) was calculated according to equations 4 and 5, where <mml:math><mml:mrow><mml:mi>E</mml:mi><mml:mi>n</mml:mi><mml:mi>e</mml:mi><mml:mi>m</mml:mi></mml:mrow><mml:mo>-</mml:mo></mml:mover></mml:math> is the average score of a student in the four Enem sections (Natural Science, Humanities, Language, and Mathematics).
In 2013, Inep included a variable called “opportunity for further training/learning” (OAF) which expressed students’ perception of the program structure. Because of that, the third methodology to calculate value-added in higher education was:
Until 2013, the IDD estimation was based on seniors’ Enade scores in a given year and freshmen’s Enem scores in that same year. As the Enem scores had been released since 2009, seniors in 2014 already had their Enem scores recorded in the Inep database. The new estimation methodology came to include multilevel hierarchical regression analysis, and the characteristics of both students and programs were excluded from the new model. This IDD estimation employs two-level hierarchical linear modeling. One level is that of the student, estimated through:
where: <mml:math><mml:msub><mml:mrow><mml:mi>C</mml:mi></mml:mrow><mml:mrow><mml:mi>i</mml:mi><mml:mi>j</mml:mi></mml:mrow></mml:msub></mml:math> is an achievement estimate for senior student i on the Enade as weighted by his/her scores in the specific training section (75%) and the general training section (25%) for the undergraduate program j; <mml:math><mml:msub><mml:mrow><mml:mi>C</mml:mi><mml:mi>N</mml:mi></mml:mrow><mml:mrow><mml:mi>i</mml:mi><mml:mi>j</mml:mi></mml:mrow></mml:msub></mml:math>is the measure of achievement in Enem’s ‘Natural Sciences and their Technologies’ section for senior student i in undergraduate program j; <mml:math><mml:msub><mml:mrow><mml:mi>C</mml:mi><mml:mi>H</mml:mi></mml:mrow><mml:mrow><mml:mi>i</mml:mi><mml:mi>j</mml:mi></mml:mrow></mml:msub></mml:math>is the measure of achievement in Enem’s ‘Humanities and their Technologies’ section for senior student i in undergraduate program j; <mml:math><mml:msub><mml:mrow><mml:mi>L</mml:mi><mml:mi>C</mml:mi></mml:mrow><mml:mrow><mml:mi>i</mml:mi><mml:mi>j</mml:mi></mml:mrow></mml:msub></mml:math>is the measure of achievement in Enem’s “Languages, codes, and their technologies” section for senior student i in undergraduate program j; <mml:math><mml:msub><mml:mrow><mml:mi>M</mml:mi><mml:mi>T</mml:mi></mml:mrow><mml:mrow><mml:mi>i</mml:mi><mml:mi>j</mml:mi></mml:mrow></mml:msub></mml:math>is the measure of achievement in Enem’s “Mathematics and its Technologies” section for senior student i in undergraduate program j; <mml:math><mml:msub><mml:mrow><mml:mi>λ</mml:mi></mml:mrow><mml:mrow><mml:mi>i</mml:mi><mml:mi>j</mml:mi></mml:mrow></mml:msub></mml:math>represents the random effects associated with senior student i in undergraduate program j. The second level of analysis is the program, as estimated through:
where: <mml:math><mml:mi> </mml:mi><mml:msub><mml:mrow><mml:mover accent="true"><mml:mrow><mml:mi>I</mml:mi></mml:mrow><mml:mo>^</mml:mo></mml:mover></mml:mrow><mml:mrow><mml:mi>i</mml:mi><mml:mi>j</mml:mi></mml:mrow></mml:msub></mml:math> represents the mean, which is constant across the undergraduate programs; and represents the random effects associated with undergraduate program j. The multilevel regression model is estimated twice. The first regression extracts the parameters, estimates the standardized residual, and excludes those with a modular value higher than 3. The second regression uses the parameter values to produce the estimate Î as in:
where: <mml:math><mml:msub><mml:mrow><mml:mover accent="true"><mml:mrow><mml:mi>I</mml:mi></mml:mrow><mml:mo>^</mml:mo></mml:mover></mml:mrow><mml:mrow><mml:mi>i</mml:mi><mml:mi>j</mml:mi></mml:mrow></mml:msub></mml:math> is the estimate of the Enade achievement of senior student i in undergraduate program j resulting from the students’ characteristics before admission to the program. A gross IDDij is estimated for each student i from undergraduate program j, then, a mean IDDij is estimated for each program (sum of all IDDij for program j divided by the number of students from program j). As with the other variables that make up the CPC indicator, the IDDj score is standardized and transformed into a continuous scale from 1 to 5. The IDD estimation has been disclosed in a specific Technical Bulletin since 2016.
Beyond the changes in the IDD variables which had an impact on the CPC calculation, variables that reflect student perception of the undergraduate programs’ structure (OAF, IFF, and ODP) started being estimated by using the mean of a broad set of questionnaire responses. This variation impacted the weight of variables in the CPC as also happened to the use of freshmen and seniors’ scores in both Enade/Enem. Table 1 shows the evolution of the course quality indicator (CPC) measure
Table 1 Evolution of CPC measurement and its variables wieght
| Variable | Until 2010 | 2011-2012 | 2013 - date |
|---|---|---|---|
| Doc (Faculty members with Ph.D.s) | 0.20 | 0.15 | 0.15 |
| Me (Faculty members with master’s degrees) | 0.05 | 0.075 | 0.075 |
| RT (Full-time professors) | 0.05 | 0.075 | 0.075 |
| IFF (infrastructure) | 0.05 | 0.075 | 0.05 |
| ODP (pedagogic teaching structure) | 0.05 | 0.075 | 0.075 |
| OAF (opportunity for further training/learning) | - | - | 0.025 |
| IDD (value-added) | 0.30 | 0.35 | 0.35 |
| C (Average of seniors' Enade score) | 0.15 | 0.20 | 0.20 |
| I (Average of freshmen Enade score) | 0.15 | - | - |
Source: Elaborated by the authors based on Brasil. Inep (2009a), Brasil. Inep. (2012); Brasil. Inep. (2014a).
Despite Brazilian government having made an effort to engage academia in its processes for building instruments for higher education assessment, the information produced by the Sinaes reports, with data and characteristics of educational institutions, have not reached program coordinators properly in order to improve higher education substantially (Griboski, 2012). Some seem to have been unaware of the existence of online reports. A survey of coordinators of undergraduate programs in Accounting showed that 61% of the sample had read the 2006 Enade report and pointed to a positive association between the use of the report and the program’s achievement in the following assessment cycle (Freitas, 2012). A similar result was found in a study on how coordinators of undergraduate programs in Business Administration and Accounting perceived the usefulness of the 2012 Enade reports: highly-rated programs had coordinators with a positive stance toward the quality and usefulness of such reports (Freitas et al., 2015).
The lack of a reference measure has been pointed out as a major reason for not using the reports. Nonetheless, all Sinaes quality indicators, estimated on a scale from 1 to 5, rely on a model designed according to government standards, which entails that the rates are relative and dependent on the data of all HEIs, rather than on an expected level of achievement (Pedrosa; Amaral; Knobel, 2013). In other words, an institution rated 5 cannot be said to have an expected level of excellence, but rather that it is amongst the best institutions when it comes to its undergraduate programs that have been analyzed.
Methodology
Correlational research design is used to describe the relationship between variables. The procedure generally follows this logic: multiple variables are measured for each participant, and statistics are used to estimate the magnitude and direction of the association between such variables (Clark; Creswell, 2015). Inep’s value-added models are all based on regression equations where student and program variables are predictive of academic achievement. Thus, to accomplish the first specific objective of this study (i.e., comparing the value-added models used in Sinaes since its implementation), the undergraduate programs’ IDDs were re-estimated for the sample following both the correlational design and Inep Technical Bulletins (since 2006).
To perform a comparative analysis across the VAMs, the 2015 IDD was re-estimated based on the Inep methodology used between 2006 and 2010 (Model 1), 2011 and 2012 (Model 2), 2013 (Model 3), and 2014-to date (Model 4). The procedures for estimating the IDD in all models were as follows: 1) calculate regression equations according to the period-specific Notas Técnicas (Brasil. Inep, 2009a; Brasil. Inep, 2012; Brasil. Inep, 2014a; Brasil. Inep. Daes, 2017a), 2) extract parameters to estimate standardized residuals, 3) remove values with standardized residuals greater than 3, 4) re-estimate regression equations to compute parameters without outliers, 5) compute the Enade estimate, and 6) estimate the IDD (actual Enade score minus the Enade estimate).
Table 2 Description of variables tested
| Level of analysis | Name of variable (code) | Type of variable | Value of variable |
|---|---|---|---|
| Response Variable | Enade score (C) | Numerical | 0 to 100 |
| Explanatory variable (student-related) | Mean Enem score () | Numerical | 0 to 1000 |
| Score in Enem’s ‘Natural Sciences’ section (CN) | Numerical | 0 to 1000 | |
| Score in Enem’s ‘Humanities’section (CH) | Numerical | 0 to 1000 | |
| Score in Enem’s ‘Mathematics’section (MT) | Numerical | 0 to 1000 | |
| Score in Enem’s ‘Languages’ section (LT) | Numerical | 0 to 1000 | |
| Ratio of parents with higher education (w) | Numerical | 0 to 1 | |
| Explanatory variable (program-related) | Faculty members with Ph.Ds (Doc) | Numerical | 1 to 5 |
| Faculty members with master’s degrees (Me) | Numerical | 1 to 5 | |
| Faculty members under full-time employment contracts (RT) | Numerical | 1 to 5 | |
| Program’s infrastructure (IFF) | Numerical | 1 to 5 | |
| Program’s pedagogical teaching structure (ODP) | Numerical | 1 to 5 | |
| Program’s opportunity for further training/learning (OAF) | Numerical | 1 to 5 |
Source: Elaborated by the authors.
Table 2 provides a description of all variables used in Models 1, 2, 3, and 4. The variables were used following the current Inep description for all models tested in this research (Models 1-4). This stage aimed at identifying the methodological and practical implications in estimating the value added by a program to student achievement following the different Inep Technical Bulletins. Statistical differences between the models were analyzed using the freeware R (The R Foundation, 2017).
Dataset
The study is limited to undergraduate programs in Accounting in Brazil and based on public databases made available by Inep, namely: the Enade microdata, the CPC microdata, and the IDD microdata from the year 2015. A total of 30,668 students from 911 undergraduate programs in Accounting were included in the sample, i.e., 46.98% of the total population of accounting students. Accounting has been one of the five largest fields of undergraduate studies in Brazil since 2009. It currently ranks third in number of undergraduate programs in the country and fourth in number of enrollments, only lower in numbers than Law, Pedagogy, and Administration undergraduate programs (Brasil. Inep, 2019a). Yet, only 30% (11,210 out of the 37,051) of applicants passed the 2019-2 proficiency exam applied by the Federal Board of Accountants. Meanwhile, 1,101 undergraduate programs in Accounting had students take the 2019 Enade and obtained the following quality levels: 50 ranked 1 (worst level); 348 ranked 2; 478 ranked 3 (satisfactory level); 166 ranked 4; and 42 ranked 5 (best level) (Brasil. Inep, 2019a), i.e., 36% of them did not reach a satisfactory level according to the criteria set forth by Inep. This way, uncovering characteristics of the programs which are doing well could help other school leaders implement policies that improve their student achievement levels.
Program level quality based on different IDD estimations
To accomplish the second specific objective (i.e., rating undergraduate programs in Accounting based on different VAMs), the quality indicator CPC was re-estimated for each of the models tested. To this end, the Enade score had to be re-estimated following the 2015 Inep Technical Bulletin, so that it could encompass the research sample data. The variables related to students’ perception of the training/learning process (‘IFF’, ‘ODP’, ‘OAF’), and faculty members’ characteristics (‘Doc’, ‘Me’, ‘RT’) were extracted from the 2015 CPC database. Once the CPC was re-estimated, the quality of programs based on this indicator was compared across the different models by testing the means and analyzing the variance of the continuous CPCs and the number of programs in each CPC Level to identify if the CPC of a given program would change depending on the IDD estimation methodology.
Finally, a further measure of school effectiveness was based on the standard error associated with the value-added estimate of each model in order to accomplish the third specific objective of this research. It was developed by the Tennessee Value-Added Assessment System and applied to higher education by Liu (2011). Measuring this standard error helped identify whether each institution’s value-added estimate is significantly different from the growth pattern of other institutions (Table 3).
Table 3 Program rating by school effectiveness
| Program ranking | Value-added estimate compared to the sample mean | Index | Interpretation |
|---|---|---|---|
| Level 5: Most effective | At least 2 standard errors above | Higher than or equal to 2.00 | Significant evidence that students exceeded the Growth Standard. |
| Level 4:Above-average effectiveness | Between 1 and 2 standard errors above | Between 0.99 and 1.99 | Moderate evidence that students exceeded the Growth Standard. |
| Level 3: Average effectiveness | Between 1 standard error above and 1 standard error below | Between -1.00 and 1.00 | Evidence that students met the Growth Standard. |
| Level 2: Approaching average effectiveness | Between 1 and 2 standard errors below | Between -1.99 and -0.99 | Moderate evidence that students did not meet the Growth Standard. |
| Level 1: Least effective | More than 2 standard errors below | Less than or equal to -2.00 | Significant evidence that students did not meet the Growth Standard. |
Source: USA. TDOE (2019, p. 35).
After rating the programs according to their comparative effectiveness, an analysis was carried out to identify whether their effectiveness is upgraded or downgraded (i.e., level change) by changing the IDD estimation.
Results
Descriptive analysis
To estimate the expected scores on the achievement test (Enade), Models 1-3 use regressions of actual Enade scores for freshmen and seniors. As the freshmen’s scores were unavailable, this study assumed the value-added measure (IDD) to be the difference between the observed values and the expected values based on the Accounting seniors’ scores (Enade). The difference between Model 1 and Models 2-3 is that the independent variable is the score in each Enem section (Natural Sciences - CN; Human Sciences - CH; Literature and Languages - LT; Mathematics - MT) in Model 1, but the mean scores of all Enem sections in Models 2-3. Model 3 is different from Models 1-2 in that the student questionnaire has been a broader version since 2013, and a new variable was captured based on their answers: the “opportunity for further training/learning” (OAF); in addition, the variables “pedagogical teaching structure” (ODP) and “infrastructure” (IFF) were reformulated based on the questionnaire.
The IDD estimation for Models 1-3 was based on data at the program level, rather than at the student level. After excluding outliers, variables Doc and Me were non-significant in model 1, while ODP and w were significant at 10%. Models 1 and 2 did not produce much difference in the estimates for parameters related to each variable under scrutiny. This is probably because both models only diverge in how they employ the student’s prior knowledge variable(s) to explain the Enade results: Model 1 uses the scores of four Enem sections, while Model 2 uses their mean. Faculty characteristics (Doc and Me) produce no significant contribution to the models tested, and the same is true for variable w, which means that parents’ education does not account for student achievement. In Models 1, 2, and 3 the only significant institutional characteristic was infrastructure (IFF). The results of parameter estimation among models are shown in Table 4.
Table 4 Parameter estimation in Models 1-4
| Variable | Model 1 | Model 2 | Model 3 | Model 4 |
|---|---|---|---|---|
| Intercept | -32.46* | -31.92* | -32.06* | -8.09* |
| CN (Score in Enem’s ‘Natural Sciences’sections) | 0.02* | - | - | 0.02* |
| CH (Score in Enem’s ‘Humanities’ sections) | 0.02* | - | - | 0.02* |
| LT (Score in Enem’s ‘Languages’ sections) | 0.04* | - | - | 0.03* |
| MT (Score in Enem’s ‘Mathematics’ sections) | 0.05* | - | - | 0.02* |
| Enem score | - | 0.13* | 0.13* | - |
| W (ratio of students whose parents have higher education) | -2.76** | -2.45 | -2.40 | - |
| Doc ( faculty members with Ph.D.s) | 0.02 | 0.06 | 0.06 | - |
| Me (faculty members with master’s degrees) | 0.18 | 0.18 | 0.18 | - |
| RT (full-time professors) | 0.39* | 0.32* | 0.32* | - |
| IFF (infrastructure) | 0.78* | 1.07* | 1.17* | - |
| ODP (pedagogical teaching structure) | 0.53** | 0.31 | 0.37 | - |
| OAF (opportunity for further training/learning) | - | - | -0.17 | - |
Source: Elaborated by the authors.
Notes:
* significant at 95% confidence level.
** significant at 90% confidence level.
To the best of the authors’ knowledge, no study has used such a model at the institution or program level for higher education. In general, studies using OLS regression equations for higher education arrange their database at the level of freshmen and seniors (Kim; Lalancette, 2013; Liu, 2011; Steedle, 2012). The value-added is estimated by averaging the difference between the students’ actual and estimated scores in a given institution. In Brazil, as the variables were based on the mean, the value-added estimate was at the institutional level.
Unlike Models 1-3 (OLS multiple linear regression), Model 4 estimates the IDD using an HLM regression equation, with the main database arranged at the student level and the analysis performed at two levels: that of the student, and that of the institution (in this case, the undergraduate program in Accounting). Much as one of the assumptions in OLS models is that the observations are independent, academic achievement is known to be the result of student experience in the institution; thus, the test scores of students in a given program cannot be considered independent of the institution (Kim; Lalancette, 2013).
Table 5 shows, for instance, that the correlation between the Enade scores and the Enem scores is higher at the institution level than at the student level. As such, HLM models are more appropriate, and Model 4 is a better predictor in that it differentiates the variance of student scores within and between programs.
Table 5 Correlation between standardized Enem and Enade scores
| Student level | Institution level | |||||
|---|---|---|---|---|---|---|
| Enade | General training | Specific training | Enade | General training | Specific training | |
| Enem | 0.54 | 0.37 | 0.51 | 0.71 | 0.61 | 0.68 |
| CN | 0.44 | 0.31 | 0.41 | 0.63 | 0.56 | 0.60 |
| CH | 0.43 | 0.31 | 0.40 | 0.60 | 0.55 | 0.56 |
| LT | 0.45 | 0.33 | 0.41 | 0.66 | 0.57 | 0.62 |
| MT | 0.44 | 0.26 | 0.43 | 0.69 | 0.53 | 0.67 |
Source: Elaborated by the authors.
The assumption of variance homogeneity was tested for Model 4, i.e., if level-1 (student) variance is equal across all institutions, it follows that the institutions do not contribute additional variance to student achievement and, therefore, the method of choice should be the classical regression model estimated by OLS. The intraclass correlation coefficient was estimated to indicate the percentage of total variance that was explained by the programs. The result was a coefficient of 0.17, i.e., 17.04% of the variance in student achievement on the Enade, explained by the difference between the programs, which is consistent with other studies focused on higher education (Ferreira, 2015; Liu, 2011; Rodrigues et al., 2016).
The correlation between the IDDs was estimated to assess the relationship between the models. Table 06 points to a high correlation between the fitted models. The values found are close to those reported by Melguizo et al. (2017), who compared three VAMs using data from Colombia. They found a correlation of 0.74 when comparing the cumulative residual model (similar to Models 1-3 in this article) with the fixed effects model (with selectivity as a control variable), and a correlation of 0.9 between fixed effects model and random effects model (with or without control variables).
Table 6 Correlation between value-added estimates (IDD)
| Model 1 | Model 2 | Model 3 | |
|---|---|---|---|
| Model 1 | 1.00 | - | - |
| Model 2 | 0.98 | 1.00 | - |
| Model 3 | 0.98 | 1.00 | 1.00 |
| Model 4 | 0.76 | 0.78 | 0.78 |
Source: Elaborated by the authors.
Models 2-3 are perfectly correlated (1). Table 4 confirms this through the similarity of the parameters across the different models. Model 4 has less similar parameters because its intercept varies at both the student and the institution levels.
Some considerations are required when comparing Model 4 against Models 1-3. First, Models 1-3 ignore all student-level information, as they estimate the IDD at the institution level, while Model 4 uses a student-level database. The results tend to be more reliable at the student level, since the number of students is much larger than that of institutions (Liu, 2011; Klein et al., 2008). In addition, while Models 1-3 uses characteristics of both students (parental education) and institution (faculty and program), Model 4 is based on standardized test scores, but it doesn’t include other variables such as parental education or infrastructure. However, research on Brazilian undergraduate programs in Accounting (Beck; Rausch; 2014; Miranda, 2011; Ferreira, 2015; Rodrigues et al., 2016; Rodrigues et al., 2017) has underscored that several individual and institutional aspects should be factored in to determine academic achievement.
Finally, after running analysis of IDD variance across the different models, we figured out a significant difference between one or more IDD means. In order to find out which specific groups’ means (compared with each other) are different, a Tukey’s HSD test was run. The results (Table 7) elucidate that the IDD difference in group-by-group mean tests is significant only between Model 4 and the other models.
IDD-based ranking of undergraduate programs
Following the Sinaes methodology, undergraduate Program Quality Level is measured by the CPC indicator, a pool of indicators each with its specific weight (Figure 2). The program’s continuous CPCs are rounded and transformed into Levels from 1 to 5, as shown in Table 8.
Table 8 CPC levels
| CPC (continuous) | CPC (categorical) |
|---|---|
| 0 ≤ CPC < 0.945 | 1 |
| 0.945 ≤ CPC < 1.945 | 2 |
| 1.945 ≤ CPC < 2.945 | 3 |
| 2.945 ≤ CPC < 3.945 | 4 |
| 3.945 ≤ CPC ≤ 5 | 5 |
Source: Brasil. INEP, 2018c, our translation.
To assess whether the program rankings differed through re-estimating the IDD, the CPCs were estimated in the four models for all 911 programs in the sample. Table 9 shows the ranking of programs in each CPC Level. It is interesting to note that the worst and the best (considering that the same institutions account for these numbers) are consistent across the models. It is also interesting that Model 4 results in more institutions considered to have achieved acceptable standards.
Table 9 Program ranking in CPC levels
| CPC levels | Model 1 | Model 2 | Model 3 | Model 4 |
|---|---|---|---|---|
| Level 1 | 4 | 5 | 5 | 5 |
| Level 2 | 145 | 160 | 161 | 101 |
| Level 3 | 593 | 586 | 586 | 639 |
| Level 4 | 165 | 156 | 155 | 161 |
| Level 5 | 4 | 4 | 4 | 5 |
Source: Elaborated by the authors.
From Model 1 to Model 2, 34 programs had their CPC Levels changed, 30 of which upgraded one level and four of which downgraded one level. The largest and smallest differences between the continuous CPCs of the 30 upgraded programs were 0.18 and 0.02, respectively, which implies that their upgrade was merely an issue of transforming continuous scores into categorical levels. In turn, the largest and smallest differences between the continuous CPCs of the four downgraded programs were respectively 0.1 and 0.03. From Model 2 to Model 3, two programs had their CPC Levels upgraded, with differences of 0.005 and 0.012 between their continuous CPCs. From Model 3 to Model 4, 112 programs had their CPC Levels changed, out of which 90 upgraded one level and 22 downgraded one level. In this case, differences between continuous CPCs were greater, ranging from 0.04 to 0.71.
Amongst the programs that had their CPC Levels changed from Model 3 to Model 4, 62 upgraded from Level 2 to 3. Their average IDD was 1.3 in Model 3 and 2.0 in Model 4. The 26 programs that upgraded from Level 3 (Model 3) to 4 (Model 4) had their average IDD at 1.8 and 2.4 in Models 3, and 4, respectively. The two programs that upgraded from Level 4 (Model 3) to 5 (Model 4) had their average IDD at 3.8 in Model 3 and 2.4 in Model 4.
Using HLM-based residual analysis (Model 4) has the advantage of increasing the reliability of school effects compared to OLS regression models (Model 3). Thus, the reliability and consistency of the year-by-year estimate of value-added for each institution are higher when applying the multilevel model (Kim; Lalancette, 2013). As such, the value-added estimate can be used by school leaders to determine how effective an institution is in contributing to student achievement over the years.
In general, value-added models lend themselves to compare effectiveness across institutions (Chudowsky; Koening, 2010; Horn; Horner; Lee, 2019; Kim; Lalancette, 2013; Liu, 2011; Melguizo et al., 2017; Braun), which in turn requires defining measurement scales to compare the models. In addition to ranking the programs based on their CPCs, school effectiveness was defined using the standard deviations of the value-added scores. Table 10 provides the ranking results.
Table 10 Program rating by school effectiveness across models
| Effectiveness level | Model 1 | Model 2 | Model 3 | Model 4 |
|---|---|---|---|---|
| Level 1 - Least effective | 14 | 15 | 16 | 78 |
| Level 2 - Above average effectiveness | 68 | 59 | 57 | 110 |
| Level 3 - Average effectiveness | 578 | 587 | 587 | 532 |
| Level 4 - Above average effectiveness | 192 | 189 | 189 | 102 |
| Level 5 - Most effective | 59 | 61 | 62 | 89 |
Source: Elaborated by the authors.
Tables 9 and 10 reveal that the program rankings were similar across Models 1-3, supporting the results of the regression statistics. Considering Model 4-based CPC ranking (Table 9) compared to the others, programs tend to concentrate in Level 3, which assumedly stands for programs with satisfactory quality in the Sinaes classification. However, in comparing effectiveness across programs, the central values (Level 3) are reduced while discrepancy increases across the programs, which were re-ranked in the most extreme levels (see Table 10).
The greatest difference is found from Model 3 to Model 4: 70 programs had their effectiveness upgraded in one level, two programs upgraded two levels (both from “average” to “more effective” programs), 35 downgraded two levels, and 214 downgraded one level. Most programs (590) did not experience any change in their comparative effectiveness, but a meaningful percentage (i.e., 40% of these programs) did have their effectiveness level changed, which calls for a more fine-grained analysis.
Table 11 shows how the means for student and program variables changes with changing the estimation methodology (from Model 3 to Model 4). Column 1 describes the observed variables, column 2 provides the means of these variables for programs downgraded in two levels of effectiveness (from Model 3 to Model 4), and column 3 shows the means for the programs upgraded in two levels (from Model 3 to Model 4).
Table 11 Comparison between means (model 3 vs. model 4)
| 2-level down-grade | 2-levels upgrade | t test (p-value) | Interpretation (The most effective programs have…) | |
|---|---|---|---|---|
| Enade mean | 42.71 | 50.96 | 0.00 | Highest overall score on the Enade |
| Mean Enade score for FG | 52.91 | 58.53 | 0.00 | Highest Enade score for FG |
| Mean Enade score for CE | 39.28 | 48.41 | 0.00 | Highest Enade score for CE |
| Mean books read/year | 0.43 | 0.55 | 0.05 | Highest % of people eading 3 books or + |
| Mean hours of study | 0.28 | 0.51 | 0.00 | Highest % of people studying above 3h |
| Mean Enem score for CN | 490.83 | 501.31 | 0.05 | Highest Enem score for Natural Science |
| Mean Enem score for CN | 509.80 | 540.18 | 0.00 | Highest Enem score for History |
| Mean Enem score for LT | 533.45 | 546.44 | 0.00 | Highest Enem score for Literature |
| Mean Enem score for LT | 556.93 | 574.22 | 0.00 | Highest Enem score for Math |
| Mean IGC (continuous) | 2.52 | 3.00 | 0.00 | Highest general Index |
| Mean ODP | 2.26 | 4.29 | 0.00 | Highest pedagogical teaching |
| Mean IFF | 2.27 | 4.48 | 0.00 | Highest infrastructure |
| Mean OAF | 2.26 | 4.20 | 0.00 | Highest opportunity for further training/learning |
| Mean Me | 2.87 | 3.99 | 0.00 | Highest % of faculty members with masters degrees |
| Mean Doc | 1.16 | 1.84 | 0.04 | Highest % of faculty members with Ph.D.s |
Source: Elaborated by the authors
In programs with a 2-level effectiveness upgrade, lower values are found for the number of single students, white students and students of Asian descent, and the number of students with scholarships, as well as student income higher values are found for students’ average age, the ratio of parents with only some level of basic education, and the number of individuals with student funding. Although the means were different between models, they were non-significant for the variables mentioned, and therefore, are not shown in Table 11. However, the t-test was significant for the difference in means for two student-related variables: number of books read, and hours of study. The group of programs with upgraded effectiveness has a higher percentage of students who study over three hours a week and those who read over three books a year.
Not surprisingly, such 2-level-upgraded programs also have higher Enem and Enade scores. They also have higher means for institutional variables (IFF, ODP, OAF, Me and DOC) than the 2-level-downgraded programs. Particularly, the variable that measures the HEI quality index (IGC) was also significantly higher. This means that the most effective programs are those with better infrastructure, better pedagogical teaching structure, and more qualified faculty members, as well as those within universities, university centers or federal institutes.
From such a finding, it may be concluded that: 1) the Tennessee ranking system (USA. TDOE, 2019), whereby school effectiveness is measured from the deviations of the mean, is a good way to compare program effectiveness within and between different value-added models, and 2) multilevel regression models, which include data grouped by institution and data per student, provide more accurate measures of school effectiveness, especially when comparing institutions.
Practical and political implications for IDD models
Analyses should not focus only on the students’ final achievement, as revealed in their Enade scores, or on a single quality indicator such as the CPC, which combines indicators and is difficult to interpret. It is important to investigate which variables are related to the value-added so that faculty, school leaders and policymakers can work together to improve their student achievement. With this in view, a correlation test was run to find out which student and/or institutional characteristics were related to the IDD among the models tested.
In Table 12, the IDD is significantly correlated with individual student characteristics in all models tested (i.e., marital status, ethnicity, parental education, income, type of high school, number of books read, hours of study). As a program’s value-added is correlated with the students’ sociodemographic characteristics regardless of institutional efforts, it follows that public policies of social inclusion are essential in Brazil. If the IDD is conceptually an indicator that measures the value a program adds to student achievement (Brasil. Inep 2019a), it should not be related to the students’ personal characteristics. Program coordinators have little control over such sociodemographic variables, since public policies for social inclusion are generally instituted at the level of HEIs and/or the federal government. Therefore, school leaders’ attention should be drawn to the fact that the number of books read and hours of study are related to academic achievement: the more they read or study, the higher their achievement.
Table 12 Correlation between IDD and student characteristics
| IDD_M1 | IDD_M2 | IDD_M3 | IDD_M4 | ||
|---|---|---|---|---|---|
| Marital status | ρpb | 0.20* | 0.20* | 0.20* | 0.04* |
| Ethnicity | ρpb | 0.05* | 0.06* | 0.06* | 0.04* |
| Nationality | ρpb | 0.02* | 0.02* | 0.02* | 0.01* |
| Level of education (father’s) | ρpb | -0.02* | -0.02* | -0.01* | 0.00 |
| Level of education (mother’s) | ρpb | -0.01* | -0.01* | -0.01 | 0.00 |
| Income | ρpb | 0.06* | 0.06* | 0.06* | 0.03* |
| Work | ρpb | -0.00 | 0.00 | 0.00 | 0.02* |
| Funding | ρpb | -0.17* | -0.19* | -0.19* | 0.01 |
| Affirmative policy | ρpb | -0.04* | -0.04* | -0.04* | -0.00 |
| High school institution | ρpb | 0.01 | 0.01* | 0.01* | 0.01 |
| Type of high school | ρpb | 0.12* | 0.12* | 0.12* | 0.02* |
| First in the family in a HEI | ρpb | -0.02* | -0.02* | -0.02* | -0.01 |
| No. of books read | ρpb | -0.02* | -0.02* | -0.02* | -0.02* |
| Hours of study | ρpb | -0.05* | -0.04* | -0.05* | -0.05* |
| Enem (CN - Natural Sciences) | ρ | 0.03* | 0.02* | 0.02* | 0.04* |
| Enem (CH - Humanities) | ρ | 0.03* | 0.01 | 0.01 | 0.03* |
| Enem (LT - Languages) | ρ | 0.04* | 0.04* | 0.04* | 0.04* |
| Enem (MT - Mathematics) | ρ | 0.03* | 0.05* | 0.04* | 0.06* |
Source: Elaborated by the authors.
Correlation was also tested between the IDD in all models and program-specific characteristics (Table 13). Institutional characteristics were significantly related to the value-added and the results can enhance understanding on how to make institutional improvements in undergraduate programs. Data show that pedagogical teaching structure (ODP), opportunity for further training/learning (OAF) and program infrastructure (IFF) are variables significantly related to the value-added. Cruz, Corrar and Slomski (2008) analyzed the relationship between student achievement and certain pedagogical variables of undergraduate programs in Accounting and found that student achievement was higher when 1) faculty members had more up-to-date qualifications for their respective courses (also found by Miranda, 2011); 2) teachers used innovative teaching techniques; 3) students carried out research as a learning strategy, 4) courses were based on textbooks instead of handouts and summaries, and 5) students had access to computer laboratories.
Table 13 Correlation between IDD and characteristics of the undergraduate programs in accounting
| IDD_M1 | IDD_M2 | IDD_M3 | IDD_M4 | ||
|---|---|---|---|---|---|
| Academic organization | ρpb | 0.02 | 0.02 | 0.02 | 0.11* |
| No. of programs in the HEI | ρ | 0.14* | 0.16* | 0.16* | 0.24* |
| IGC (continuous) | ρ | 0.35* | 0.34* | 0.34* | 0.42* |
| Learning modality | ρpb | 0.11* | 0.04 | 0.04 | 0.05 |
| ODP | ρ | 0.35* | 0.35* | 0.35* | 0.26* |
| IFF | ρ | 0.36* | 0.38* | 0.38* | 0.31* |
| OAF | ρ | 0.35* | 0.36* | 0.36* | 0.30* |
| Faculty members with master’s degrees | ρ | 0.12* | 0.13* | 0.13* | 0.18* |
| Faculty members with Ph.D.s | ρ | 0.07* | 0.08* | 0.07* | 0.11* |
| Employment contract | ρ | 0.15* | 0.13* | 0.13* | 0.16* |
Source: Elaborated by the authors.
Note: * significant at α=5%.
Thus, the present research data show that in order to add more value to student achievement, undergraduate programs in Accounting need to strive to provide high-quality infrastructure, well-designed pedagogical teaching structure, and offer scholarship for students to participate in research, extension and help them manage their career.
Students may find quality important, but many seem to take it for granted. Employers are also concerned with quality when it comes to recruiting faculty to teach and research. Policy makers, too, deem high-quality as relevant, particularly when circumstances change, participation and access to higher education increase, audits or assessments take place, and/or human and physical resources are too limited.For private organizations, quality matters most when competition between higher education institutions intensifies, leading to disputes for market shares and searches for excellence-driven differentiation across organizations (Harvey; Green, 1993).
Public institutions generally attract better students than private HEIs in Brazil, as their selection process tend to be more rigorous and their faculty members tend to be more qualified. Furthermore, public programs do not require tuitions or any other fees from students or their families. Previous studies (Fernandes et al., 2009; Ferreira, 2015; Rodrigues et al., 2017) have reported higher achievement from Accounting students in public HEIs than those from private institutions. Although it was not the purpose of this study, data showed that faculty-related variables (Me, Doc, and RT) had higher standardized scores in public HEIs than in private institutions. In the end, the continuous Enade score was higher for public programs than for private ones, which is consistent with Brazilian studies, as previously mentioned. Further studies should address value-added difference between these types of higher education institutions.
Final considerations
The historical evolution of the IDD estimation methodology shows that Inep has improved its system of measuring a program’s contribution (value-added) to student achievement. Such changes have had an impact on the ranking of undergraduate programs in Accounting, with some institutions having their quality levels upgraded and others having their levels downgraded. The current model is the most appropriate from a statistical and practical standpoint, since pooling students within institutions reduces bias in estimating the value-added of a program and allows for comparability across programs. However, excluding control variables related to the characteristics of students and institutions may be a problematic choice, as measuring value-added provides more accurate estimates of a program’s contribution to student achievement since they incorporate a set of contextual characteristics of both students and institutions.
Besides that, the IDD is positively correlated with these traits. The research shows that regardless of the IDD estimation methodology, the value-added has been significantly connected to the characteristics of faculty members as well as conditions of training and learning. If an academic unit providing an undergraduate program in Accounting aims to add value to its students’ academic achievement, it should observe these characteristics, which can be improved through internal policies.
Discussing how each method impacts policymakers’ characterizations of the effectiveness of different programs is an important contribution this study provides. Variations in ranking and measures of effectiveness have fiscal implications for the programs themselves as well as for the national government since funding is tied to assessment. For future research, investigating budgetary implications for these different rankings is suggested.
Finally, even though the CPC is the main Sinaes indicator, it does not relay the quality of programs to the public. From Levels 1 to 5, this indicator agglutinates valuable information that should be clearly informed to the stakeholders involved in higher education. The IDD aligned with the Enade score is undoubtedly the main and most suitable mechanism for the purpose of promoting quality across undergraduate programs in Brazil. Scores for infrastructure, pedagogical teaching structure and opportunity for further training/learning should not be disclosed as quality indicators, but as indicators of the condition of training and learning. After all, as this research shows, the program’s contribution (IDD) is directly related to these variables

