


 texto em
  Inglês (pdf)
 Artigo em XML
 Enviar este artigo por email
 Permalink
INTRODUCTION
The purpose of the present study is to determine whether the Exame Nacional do Ensino Médio [Brazilian High School Exam] (Enem) can be simplified by using Computerized Adaptive Testing (CAT) (Peres, 2019) without compromising reliability. Since 2009, Enem, which comprises an essay and four tests with 45 multiple-choice items, has been used as the only entrance exam for admission to several higher education institutions. Given the wide range of cutoff scores for different courses of study, the exam’s reliability is crucial. The present study combines a reflection on the technical feasibility of implementing CAT in the Enem in view of the impact the position of an item has on educational test performance (Debeer & Janssen, 2013; Domingue et al., 2020; Wu et al., 2016), with consideration of CAT’s potential for improving the logistics of applying it to the Enem. It also seeks to advance knowledge about using CAT in educational tests, by conducting a simulation with databases consisting of more than 600 items.
ENEM
The Enem was created in 1998 by the Instituto Nacional de Estudos e Pesquisas Educacionais Anísio Teixeira [Anísio Teixeira National Institute for Educational Studies and Research] (Inep), an agency of the Ministério da Educação [Ministry of Education]. Among its goals was to provide a framework for self-assessment based on performance indicators and the development of skills and abilities inherent in the cognitive and social development phase at the end of basic education (Instituto Nacional de Estudos e Pesquisas Educacionais Anísio Teixeira [Inep], 2009).
The Enem underwent changes in 2009 that brought it closer to becoming the only entrance exam for undergraduate courses of study at Brazilian federal higher education institutions. Under the Sistema de Seleção Unificada [Unified Selection System] (SiSU), established by the Ministério da Educação, institutions select candidates based on their test scores. Moreover, participation in the Enem has become a requirement to apply for government scholarships or funding to attend a private college or university.
The exam comprises an essay and four 45-item tests, each combining skills from four different areas of knowledge: Human Sciences (HS); Natural Sciences (NS); Languages and Codes (LC); and Mathematics (MT). Using item response theory (IRT) (Pasquali & Primi, 2003), each test is applied in a linear format and produces a one-dimensional measure for each area (Inep, 2012a). In order to select candidates for admission into their courses, educational institutions may use an arithmetic or a weighted average of the four tests and the essay.
Implications of using the Enem for selection
There are several challenges, in terms of reliability and validity, associated with the use of the Enem for selection. First, it is essential to demonstrate the validity of the test for predicting performance in higher education. Few studies have explored this aspect (see, for example, Ferreira-Rodrigues, 2015). A second issue is the assessment of the equivalence of essay scores, since evaluators differ in their levels of leniency or severity (Primi et al., 2019), which is not taken into account in the current version of the test. Finally, measurement error is a concern when using the test with candidates at very different proficiency levels. We do not know how large the error at each scale level is, with some courses of study having cutoffs at lower levels of the scale and others at higher levels.
Inep transforms and standardizes IRT scores on the Enem to have a mean of M = 500 and standard deviation of SD = 100, using statistics of the 2009 edition as reference (Inep, 2012a). Considering the wide variation in cutoff scores, items must cover a broad spectrum of difficulty to obtain sufficiently reliable scores for selection decisions. For example, in the 2020 edition of SiSU, which incorporated the 2019 Enem, the lowest average score for enrollment in the Social Sciences course of study at the Universidade Federal do Rio de Janeiro [Federal University of Rio de Janeiro], for vacancies reserved for black students with disabilities and for students from low-income public schools, was 394.10. On the other hand, the lowest average score to enter the Medicine course of study at the same institution was 790.98. Cutoff scores ranged from 227.78 (Aquaculture Engineering) to 928.30 (Medicine). In addition, to qualify for public scholarships and funding, a minimum average of 450 is required. Based on these cutoff scores, it is evident that the tests require adequate reliability over a range of more than 7 standard deviations, depending on the Enem edition.1 Inep attempts to achieve the Enem’s objectives through tests with a fixed number of 45 items. Clearly, it is practically impossible to achieve the same level of reliability with 45 items over a range of 7 standard deviations. CAT may be one of the few ways of achieving this objective.
Fatigue is also a concern. We know that in high-stakes, large-scale educational achievement tests, a question’s position can affect its properties of difficulty and discrimination (Domingue et al., 2020). For example, an item placed in the final section of a test will have a lower hit rate than if it is placed at the beginning of the test. Similarly, participant performance declines in the final items of a test (Debeer & Janssen, 2013; Wu et al., 2016). Also, in the 2016 Enem, the item position in MT was associated with the performance on that item (Barichello et al., 2022). These findings suggest that fatigue may impact student performance.
When there are individual differences in performance, and these differences do not relate to the construct measured by the Enem, this can result in an equity issue for the test. Students with similar levels of proficiency may score differently as a result of fatigue rather than competency. The application of a CAT could mitigate the problem of the size of a test and, consequently, reduce the potential effects of fatigue. The promise of CAT design is to maintain, or even enhance, the reliability of a test with fewer items (Veldkamp & Matteucci, 2013; Weiss, 2011).
Next-generation Enem assessment using CAT
In the IRT framework, error is inversely related to the amount of information in the region of the estimated measurement level (Ayala, 2009). Generally, a question is most informative for people whose abilities are comparable to its difficulty. Therefore, items that are too difficult or too easy have little impact on the reliability of assessing people with lower or higher abilities. However, due to the nature of the Enem, which must be able to measure a large range accurately, participants with high ability levels are required to complete easy items, even though the information they add is minimal. Moreover, participants with low ability levels are required to respond to questions with a very high level of difficulty. Alternatively, CAT selects items for administration based on the participant’s provisory ability estimates, computed from previous answers, so items that are too far from the participant’s level of ability will be avoided.
Following this procedure, subjects will answer a large proportion of items that are useful for informing their level of proficiency, and will not waste their time answering uninformative items. This could solve a problem with the Enem MT test, which is off-target for the people taking it. This test is much more difficult than the average level of proficiency of most examinees taking the Enem. As a result, the reliability of most scores is very low. Thus, it is difficult to differentiate among low-ability students.
Studies have confirmed that CATs can be used to reduce the size of educational tests. Kalender and Berberoglu (2017) simulated a test, consisting of 17 items on average, for admission to higher education in Turkey. Originally, this test had 45 items. Spenassato et al. (2016) simulated the application of the 45 MT items of the 2012 Enem in the format of a CAT and concluded that a 33-item extension of the CAT produced comparable results. Mizumoto et al. (2019) demonstrated that English language vocabulary tests consisting of 115, 73, and 56 items could be reduced to tests consisting of 20, 15, and 10 items, respectively. Considering these are high-stakes tests, the item banks in these studies contained relatively few items for a CAT. In the present study, the item banks ranged from 674 to 839 items.
Furthermore, in addition to reducing test size and measurement error, CAT can also contribute significantly to the practical features of such a large-scale test. For example, one can pre-test items during the regular administration, reduce logistical complexity (no need to transport physical material), reduce chances of fraudulent disclosure of test content, and provide immediate feedback to participants.
THE PRESENT STUDY
The size of the test, one of the points mentioned above, was chosen as the starting point for exploring and reflecting on the feasibility of implementing CAT in the Enem. So, the purpose of the present study is to investigate whether it is possible to reduce the number of items in the Enem, through the use of CAT, without compromising measurement reliability. Our research was divided into two studies. First, we intended to determine the item parameters applied in the Enem and equate them to a single scale, since Inep did not disclose the item parameters by the time this study was carried. This information is now available on the Inep website, but the methodology discussed in the first study remains relevant for researchers interested in replicating or extending our work. The second study aims to simulate CAT analysis using these items.
STUDY 1
In this study, we set out to create an Enem item bank, using a single metric, that was used later on the CAT in Study 2. The IRT three-parameter logistic model was used to calibrate the parameters of items from different years. We then converted them into a single metric, using student scores from Inep’s official database.
Participants
This study uses secondary data, extracted from Enem microdata between January and June 2020 and available on the Inep portal.2 We excluded participants whose microdata displayed inconsistencies, such as a vector of responses with 44 instead of 45 characters. Additionally, we excluded participants who left the 45 answers blank.
We randomly selected samples of 5,000 participants from each application of editions of the Enem from 2009 to 2019. The samples were stratified based on the total score of correct responses. We therefore ensured that participants with high scores would be drawn, and that the most difficult items would be calibrated accordingly. We selected 1,250 participants from both the lower and upper strata (25th and 95th percentiles, respectively), and 2,500 from the middle stratum. In applications with fewer than 25,000 participants, the upper stratum had fewer than 1,250 subjects (0.05 * 25,000 = 1,250). In these cases, the sample was supplemented with participants from other strata, maintaining a ratio of 1:2 (lower:intermediate). Due to rounding, some samples comprised more than 5,000 people.
There are at least two applications in each edition of Enem. Typically, the first application has the larger number of participants. Whenever there were fewer than 5,000 participants, calibration was performed with the entire population, if greater than or equal to 1,000. This sample size is suitable for using the IRT, three-parameter model to calibrate items (Şahin & Anıl, 2017). Therefore, we excluded applications with fewer than 1,000 participants. The sample draw was carried out using the strata function of the sampling package (v2.8) (Tillé & Matei, 2016) in the R programming environment (R Core Team, 2019). In Table 1, we summarize the sample and population sizes for each application of the Enem, along with other information that will be discussed in the Results section of Study 1.
TABLE 1 Information about each application (participants, sample, items used and correlation)
| Area | Year | Application | Population | Sample | Number of items used | Correlation |
|---|---|---|---|---|---|---|
| Human Sciences | 2009 | 1 | 2,552,781 | 5,000 | 45 | 0.996 |
| 2009 | 2 | 1,660 | 1,660 | 45 | 0.977 | |
| 2010 | 1 | 3,369,211 | 5,000 | 45 | 0.997 | |
| 2010 | 2 | 3,904 | 3,904 | 45 | 0.993 | |
| 2011 | 1 | 3,981,762 | 5,000 | 45 | 0.995 | |
| 2011 | 2 | 10,963 | 5,001 | 45 | 0.991 | |
| 2012 | 1 | 4,217,478 | 5,000 | 45 | 0.995 | |
| 2013 | 1 | 5,198,617 | 5,000 | 45 | 0.994 | |
| 2014 | 1 | 6,159,992 | 5,000 | 45 | 0.970 | |
| 2015 | 1 | 5,747,279 | 5,000 | 45 | 0.987 | |
| 2016 | 1 | 5,836,551 | 5,000 | 45 | 0.992 | |
| 2016 | 3 | 159,440 | 5,000 | 45 | 0.990 | |
| 2017 | 1 | 4,689,506 | 5,000 | 45 | 0.987 | |
| 2017 | 2 | 1,039 | 1,039 | 45 | 0.989 | |
| 2018 | 1 | 4,136,361 | 5,000 | 45 | 0.983 | |
| 2018 | 2 | 1,134 | 1,134 | 45 | 0.995 | |
| 2019 | 1 | 3,914,432 | 5,000 | 45 | 0.987 | |
| Total | 765 | |||||
| Natural Sciences | 2009 | 1 | 2,554,741 | 5,000 | 45 | 0.997 |
| 2009 | 2 | 1,668 | 1,668 | 45 | 0.964 | |
| 2010 | 1 | 3,366,011 | 5,000 | 45 | 0.996 | |
| 2010 | 2 | 3,890 | 3,890 | 45 | 0.989 | |
| 2011 | 1 | 3,980,082 | 5,000 | 45 | 0.998 | |
| 2011 | 2 | 10,953 | 5,000 | 45 | 0.974 | |
| 2012 | 1 | 4,216,367 | 5,000 | 45 | 0.989 | |
| 2013 | 1 | 5,197,365 | 5,000 | 45 | 0.986 | |
| 2014 | 1 | 6,158,548 | 5,000 | 45 | 0.983 | |
| 2015 | 1 | 5,746,263 | 5,000 | 45 | 0.984 | |
| 2016 | 1 | 5,835,361 | 5,000 | 45 | 0.984 | |
| 2016 | 3 | 159,419 | 5,000 | 44 | 0.988 | |
| 2017 | 1 | 4,433,922 | 5,000 | 45 | 0.972 | |
| 2018 | 1 | 3,901,771 | 5,000 | 45 | 0.987 | |
| 2019 | 1 | 3,707,205 | 5,000 | 45 | 0.987 | |
| Total | 674 | |||||
| Languages and Codes | 2009 | 1 | 2,434,642 | 5,000 | 44 | 0.999 |
| 2009 | 2 | 1,554 | 1,554 | 45 | 0.977 | |
| 2010 | 1 | 3,246,005 | 5,000 | 50 | 0.998 | |
| 2010 | 2 | 2,306 | 2,306 | 50 | 0.994 | |
| 2011 | 1 | 3,866,703 | 5,000 | 50 | 0.997 | |
| 2012 | 1 | 4,090,691 | 5,000 | 50 | 0.982 | |
| 2013 | 1 | 5,022,660 | 5,000 | 50 | 0.994 | |
| 2014 | 1 | 5,971,721 | 5,000 | 50 | 0.996 | |
| 2015 | 1 | 5,615,054 | 5,000 | 50 | 0.994 | |
| 2015 | 2 | 1,038 | 1,038 | 50 | 0.995 | |
| 2016 | 1 | 5,685,125 | 5,000 | 50 | 0.988 | |
| 2016 | 3 | 155,250 | 5,000 | 50 | 0.986 | |
| 2017 | 1 | 4,693,808 | 5,000 | 50 | 0.993 | |
| 2017 | 2 | 1,039 | 1,039 | 50 | 0.996 | |
| 2018 | 1 | 4,140,393 | 5,000 | 50 | 0.989 | |
| 2018 | 2 | 1,134 | 1,134 | 50 | 0.990 | |
| 2019 | 1 | 3,917,238 | 5,000 | 50 | 0.985 | |
| Total | 839 | |||||
| Mathematics | 2009 | 1 | 2,433,932 | 5,000 | 45 | 0.984 |
| 2009 | 2 | 1,549 | 1,549 | 45 | 0.973 | |
| 2010 | 1 | 3,244,895 | 5,000 | 45 | 0.997 | |
| 2010 | 2 | 2,301 | 2,301 | 45 | 0.981 | |
| 2011 | 1 | 3,865,301 | 5,000 | 45 | 0.995 | |
| 2011 | 2 | 10,364 | 5,001 | 45 | 0.979 | |
| 2012 | 1 | 4,088,847 | 5,000 | 45 | 0.997 | |
| 2013 | 1 | 5,020,489 | 5,000 | 45 | 0.990 | |
| 2014 | 1 | 5,968,542 | 5,000 | 45 | 0.986 | |
| 2015 | 1 | 5,612,869 | 5,000 | 45 | 0.988 | |
| 2015 | 2 | 1,038 | 1,038 | 45 | 0.984 | |
| 2016 | 1 | 5,683,429 | 5,000 | 45 | 0.992 | |
| 2016 | 3 | 155,197 | 5,000 | 45 | 0.994 | |
| 2017 | 1 | 4,433,702 | 5,000 | 45 | 0.987 | |
| 2018 | 1 | 3,901,617 | 5,000 | 44 | 0.985 | |
| 2019 | 1 | 3,707,065 | 5,000 | 45 | 0.987 | |
| Total | 719 |
Source: Authors’ elaboration.
Note: Population size, the sample size used for calibration, total items, and correlation between the reestimated and the original (official) scores of the population for each application of each area of knowledge. All correlation coefficients were statistically significant (p < 0.001).
Measures
Each of the four Enem tests contains 45 multiple-choice items with five options, of which only one is correct. A three-parameter, logistic model of IRT is used to estimate scores, which are positioned on a scale with a mean of 500 and a standard deviation of 100. The scale’s reference is the 2009 regular graduates of the public schools (Inep, 2012a). Since 2010, the LC test has contained five foreign language items. Therefore, each test in this area contains 50 questions. Participants can select either English or Spanish as their foreign language of choice. The other three tests (HS, NS, and MT) have 45 items each. Occasionally, Inep may exclude an item for pedagogical reasons (for example, two correct answers). In this study, we used all of the tests from the 2009-2019 editions of the Enem that did not undergo adaptation (for instance, those for people with impaired vision). Additionally, we excluded tests with fewer than 1,000 participants, those which did not have microdata, and the second application of the LC of the 2011 Enem because the information concerning its key is inconsistent. Table 1 presents the number of items used for each area.
Data analysis
The calibration was carried out using the mirt package (v1.33.2) (Chalmers, 2012). For discrimination, we used log-normal prior distributions (mean of 0 and standard deviation of 0.5, which ensures positive values). For guessing, we used beta distributions with parameters 7 and 28 (this was centered around 0.2, which is suitable for items with five alternatives). We reestimated all participant scores for each application using the mirt package, with the expected a-posteriori (EAP) method. Calibration adequacy was evaluated by correlating the reestimated and official scores (published by Inep). According to the assumption of invariance of the IRT parameters, we expected these correlation values to be close to 1, with the only differences being of scale center and of scale (intercept and slope).
As mentioned, Inep had not disclosed the item parameters. The only information we had about the scale of a test were the official scores of the participants, which have been equated throughout the years. We used the sigma-mean method to place the items in the same Inep metric (Hambleton et al., 1991). The official scores of each sample (Inep metric) were transformed to a mean of 0 and a standard deviation of 1. We also recalculated student scores using mirt in metrics 0 and 1 (mirt scores). Therefore, we had two theta values for each student (official and mirt), which should have been identical. Yet they were not, as it is unlikely that the ability distribution of the selected sample had an exact mean of 0 and a standard deviation of 1. Nevertheless, mirt assumes these values when calibrating/estimating for metric identification. Imagine that Yi represents the official score (metric in which we want to calibrate the items), and Xi represents the mirt score, for subject i. We can express the equality of these two scores as follows:
where
The constants k and d
extracted from this equation represent the equating constants (scale and origin, respectively) to transform the subjects’ scores and the item parameters obtained via mirt to the Inep metric. As the subjects’ scores and the item parameters are in the same metric, we can use these constants to transform the parameters b and a of item j from the mirt metric to the official Inep metric, using the following linear equations:
The items in the same area are, then, all positioned on the official Inep metric following these transformations. Our results are, therefore, comparable to the official results, and we can estimate a simulation participant’s score by using all the items in a particular area. It is as if we had a test consisting of hundreds of items for each of the knowledge areas in the Enem.3
Results
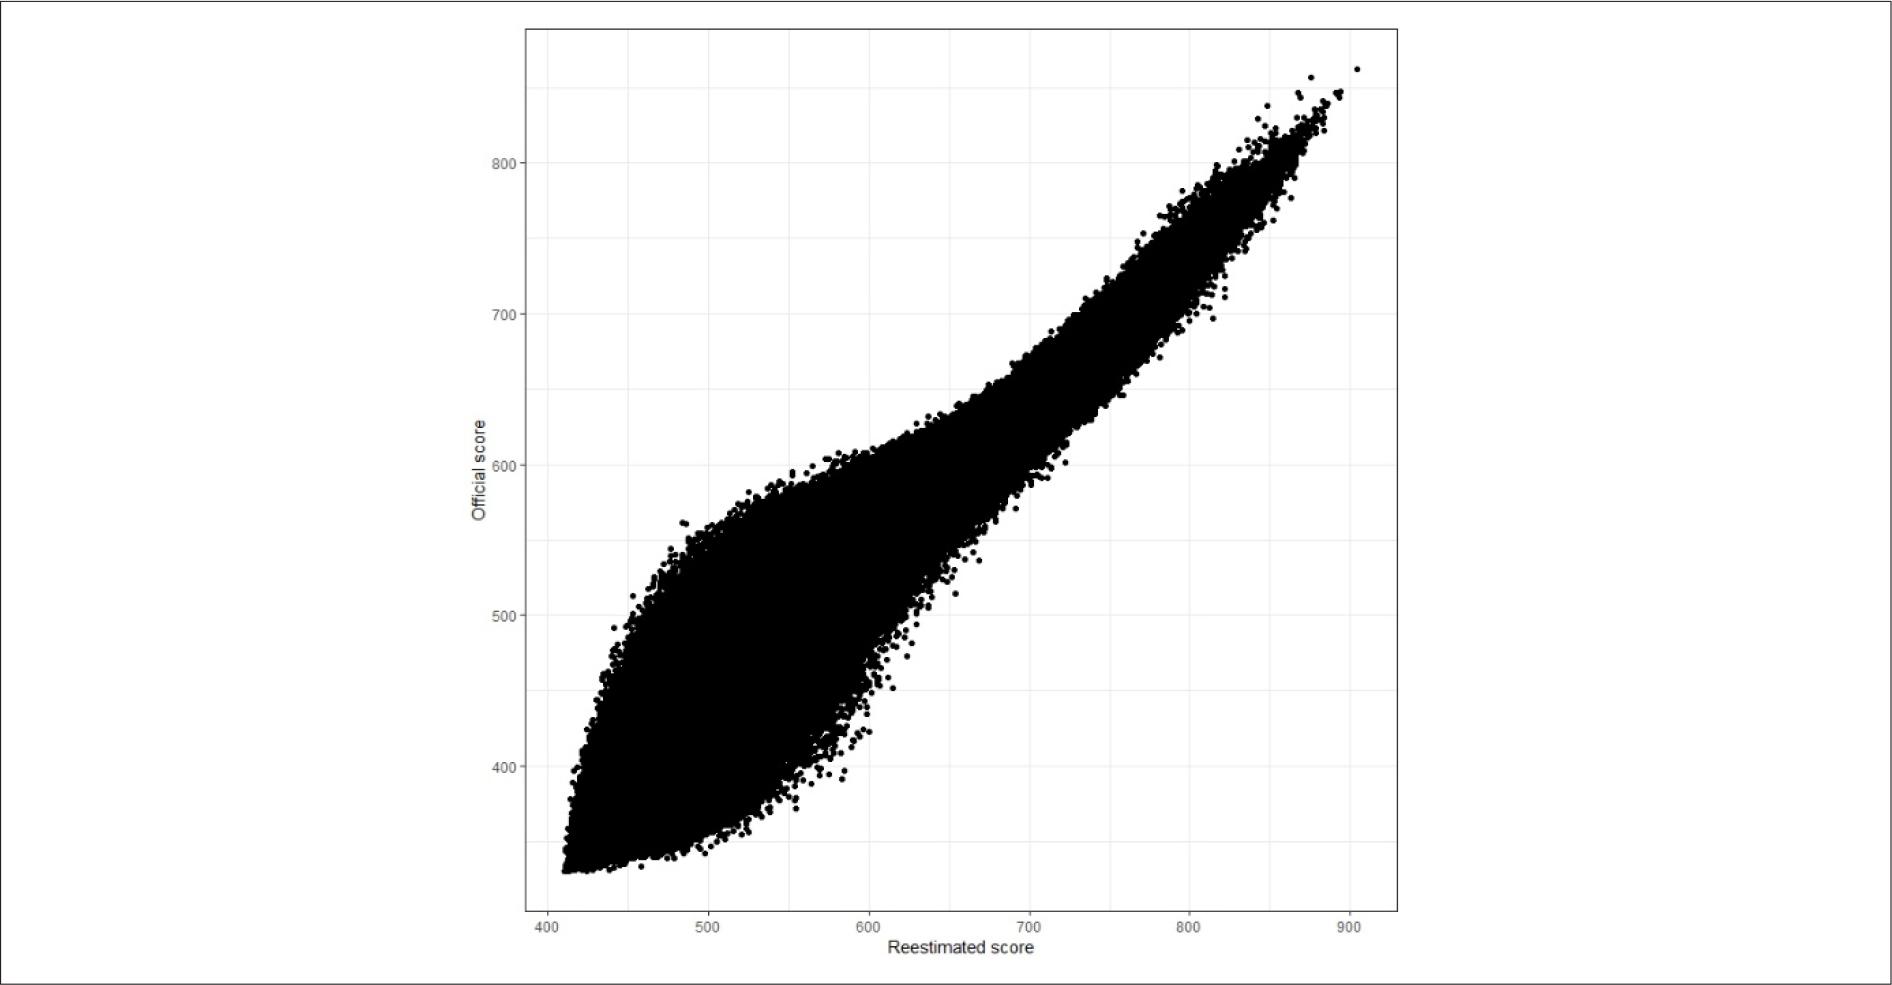
Correlations between the reestimated and the official scores were statistically significant (p < 0.001) and high. The lowest was 0.96, observed in NS (2nd application of 2009). High magnitude correlations show that variations in reestimated scores explain variations in official scores. This indicates that the calibration in this study produced item parameters comparable to the official ones. One might question why these values do not reach 1, and differ only in scale and origin. There may be several reasons for this, including the issue of estimating a guessing parameter. According to our observations, the most discrepancies between our results and the official results were observed for students with low ability. This can be attributed to differences between guessing parameters. A recalibration may show differences in guessing more than other parameters (Primi et al., 2018). Figure 1 shows the official scores as a function of the reestimated scores in the first application of HS 2014, the lowest correlation observed in a principal application.
Source: Authors’ elaboration.
FIGURE 1 Relationship between the official and reestimated scores in the first application of Enem 2014 (HS)
Table 1 uses all the correlation values between the reestimated scores and the official scores. Once we obtained reasonable estimates of the parameters of the items applied in the Enem, we moved on to Study 2. Due to the high correlations, we can say that the simulation of Study 2 has results comparable to the results published by Inep.
STUDY 2
The purpose of this study was to simulate the application of CAT, with items from all editions of Enem. To do so, we selected a random sample of participants from the 2019 edition to obtain an initial set of theta values. We then simulated responses from these subjects to all the items within the bank of items. Next, we applied the CAT algorithm using the measurement error and/or the number of items applied as a stopping rule.
Participants
A simple, random sample of participants from the 2019 edition of the Enem was drawn for each area. Unlike Study 1, we excluded no participant from this population, because the items had already been calibrated and the input from microdata to Study 2 was the participants’ ability estimates. We used the entire participant pool, reflecting a real-world testing scenario. The sample size was sufficient to guarantee a mean with a sampling error of 3 points on the Enem scale, which was equivalent to 0.03 standard deviation units. By adopting this procedure, we were able to generalize our results to the population of this edition of the Enem, which potentially brings our simulation closer to expected situations for future editions with similar characteristics. Descriptive statistics of the participants of the 2019 edition and of the samples drawn from each area are presented in Table 2.
TABLE 2 Descriptive statistics of the participants of the 2019 Enem and of their samples
| Area | N | Mean | Standard deviation | Range |
|---|---|---|---|---|
| Human Sciences | ||||
| Population | 3,917,245 | 508.0 | 80.1 | 315.9-835.1 |
| Sample | 2,738 | 509.0 | 79.9 | 321.5-771.1 |
| Natural Sciences | ||||
| Population | 3,709,827 | 477.9 | 75.9 | 327.9-860.9 |
| Sample | 2,457 | 478.1 | 75.1 | 329.2-737.0 |
| Languages and Codes | ||||
| Population | 3,920,058 | 520.9 | 62.5 | 322.0-801.7 |
| Sample | 1,667 | 522.1 | 62.0 | 325.6-688.0 |
| Mathematics | ||||
| Population | 3,709,686 | 523.2 | 108.8 | 359.0-985.5 |
| Sample | 5,055 | 522.4 | 107.8 | 359.0-929.2 |
Source: Authors’ elaboration.
The responses to the items were simulated using the generate_pattern function of the mirtCAT package (v1.10) (Chalmers, 2016); input values were the official sample scores (we called them true scores) and item parameters. As a result, we obtained four response banks, one for each area of knowledge. Each response bank contained the number of lines corresponding to the sample size for each area of knowledge, and the number of columns corresponded to the size of the item bank for each area. We produced a response bank, as if each subject had answered all items in an area.
Measures
We used the four item banks obtained in the previous study. The HS bank contained 765 items, the NS contained 674 items, the LC contained 839 items, and the MT contained 719 items.
Data analysis
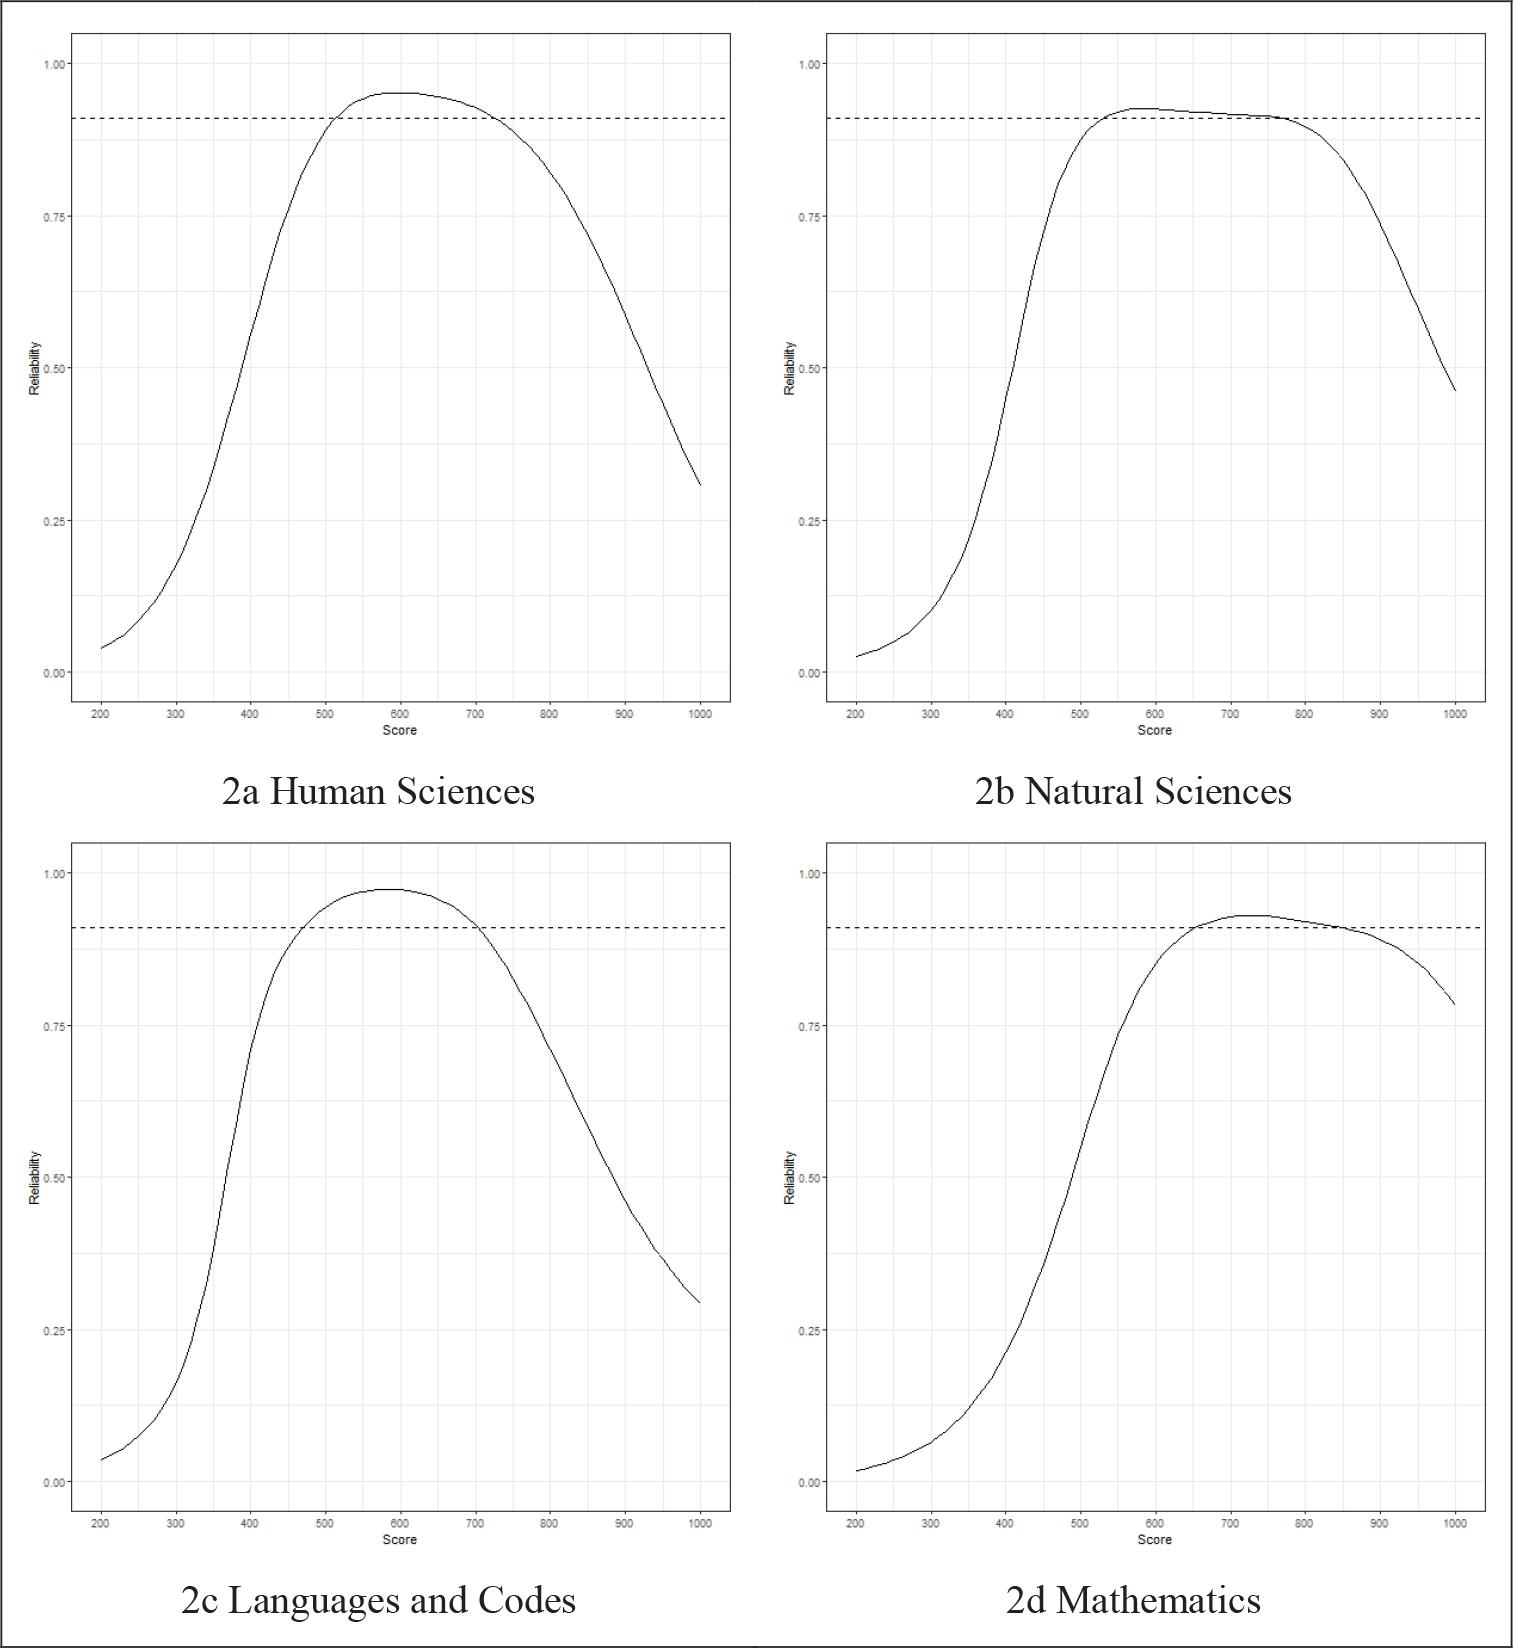
Data analysis for Study 2 consisted of the CAT simulation, which was performed using the mirtCAT package. Items were presented according to the maximum information criterion. The estimation method was the EAP. We called the scores estimated in the CAT simulation the estimated scores. Simulation ended when the standard error of measurement reached a value of 0.30 or when 45 items had been applied. This standard error value corresponds to a reliability of 0.91, since (Nicewander & Thomasson, 1999):
where
The criterion we used was more stringent than the highest marginal reliability found in the first application of the Enem in 2019 (HS = 0.78; NS = 0.74; LC = 0.84; MT = 0.53). Marginal reliability reflects the average precision across the whole scale (Ayala, 2009). The reliability of 0.91 also exceeds the precision on most of the scales of these tests. The precision at each point of the scale ρ(θ) was calculated based on information I(θ) from the test for this point (Nicewander & Thomasson, 1999):
Figure 2 shows the reliability as a function of the score in the tests of the first application of the Enem in 2019.
Results
We observed a reduction of at least 40% in test size for more than half of the participants, and a maximum error of 0.30, across all test areas. The HS test was reduced to a maximum of 20 items for 71.7% of the participants. The same reduction in the NS, LC, and MT tests was possible for 60.4%, 94.8%, and 39.8% of the participants, respectively. With 15 items, it was possible to estimate the score of more than half of the participants in the HS, NS, and LC tests, with a maximum error of 0.30. Around 30 items were needed in MT. Additionally, 90.3% of participants in HS, 79.6% in NS, 99.2% in LC, and 65.6% in MT reduced at least one item on their test. On average, 18.4 items were administered in the HS, 22.1 in the NS, 12.0 in the LC, and 29.2 in the MT tests. Table 3 shows the percentage of participants in each area that submitted to a maximum of 15, 20, 30, or 44 items.
TABLE 3 Results of simulation (correlation, error, applied items and percentage of participants)
| Human Sciences | Natural Sciences | Languages and Codes | Mathematics | |
|---|---|---|---|---|
| Correlation | 0.937 | 0.922 | 0.904 | 0.957 |
| Average standard error Highest standard error |
0.29 0.47 |
0.31 0.53 |
0.29 0.43 |
0.32 0.56 |
| Minimum number of applied items Mean of applied items |
8 18.4 |
8 22.1 |
7 12.0 |
11 29.2 |
| At last 15 items At last 20 items At last 30 items At most 44 items |
58.7% 71.7% 83.1% 90.3% |
52.3% 60.4% 70.9% 79.6% |
89.6% 94.8% 97.8% 99.2% |
25.8% 39.8% 54.0% 65.6% |
Source: Authors’ elaboration.
Notes: Correlation between estimated scores and true scores, mean standard error of measurement, highest standard error, the lowest number of applied items, mean of applied items and percentage of participants submitted to a maximum of 15, 20, 30, or 44 items. All correlation coefficients were statistically significant (p < 0.001).
We also found cases where the error was greater than 0.30 even with 45 items applied. The average standard error was 0.29 in HS and LC, 0.31 in NS, and 0.32 in MT. The largest error observed in HS was 0.47; in NS, 0.53; in LC, 0.43; and in MT, 0.56. Even though not all errors were below 0.30, the estimated scores showed significant correlation with the true scores. Using an optimized method of selecting items to create a test form tailored to each subject produced results similar to those that would have been achieved if all items had been answered. Table 3 shows the values of the errors and correlations, the minimum number and the average number of items applied in the simulation for each area.
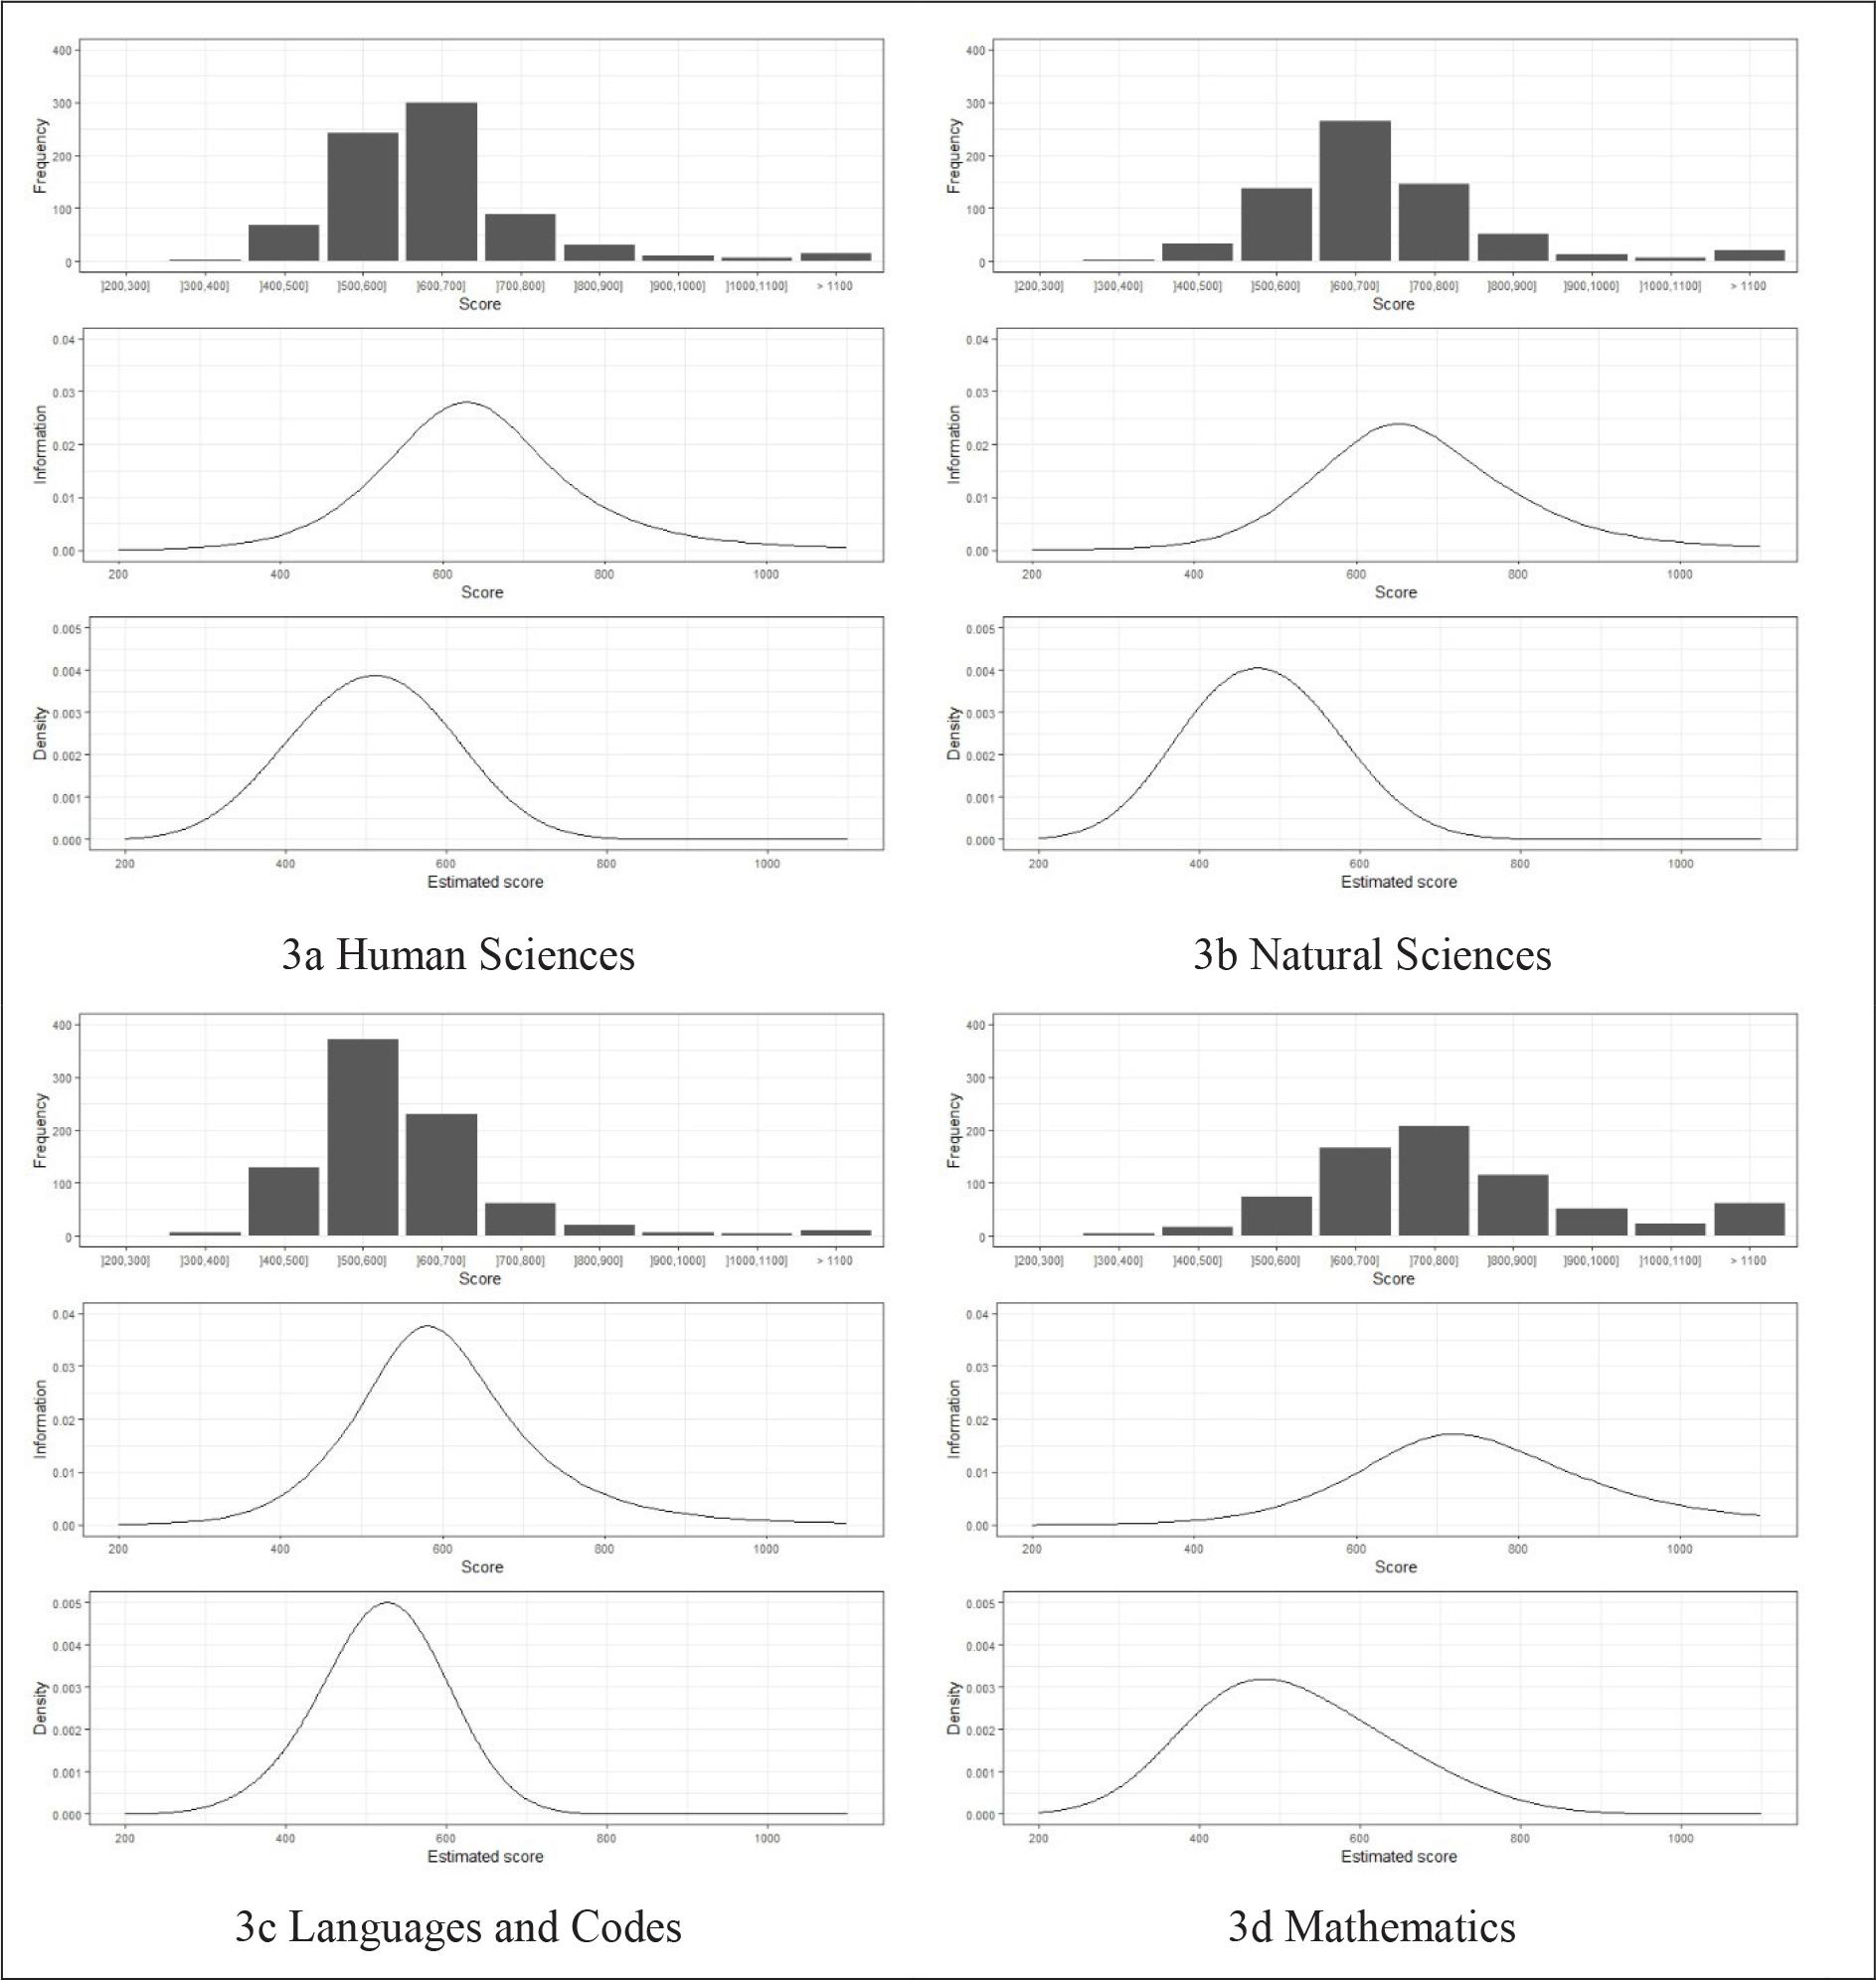
Figure 3 shows the number of items in the bank as a function of their location on the scale, the distribution of the estimated score, and the item bank information curve. Considering the location of the items on the scale: in LC, the region with the greatest number of items is close to the mean; in HS and NS, that region is close to one standard deviation unit above the mean; and, in MT, that region is close to two standard deviation units above the mean. Among the four areas, these are the regions with the most information. However, a significant portion of the theta distribution falls in areas with limited item information for HS, NS, and MT. This discrepancy arises from a lack of items targeted at measuring lower ability levels in these areas. Consequently, the current item bank has questionable precision in measuring the abilities of students with lower proficiency.
Source: Authors’ elaboration.
Note: In each quadrant, the upper figure shows the number of items as a function of its location in scale, the middle figure shows the item bank information curve, and the lower figure shows the distribution of estimated scores.
FIGURE 3 Frequency distribution of items, item bank information curve and distribution of estimated scores for all areas
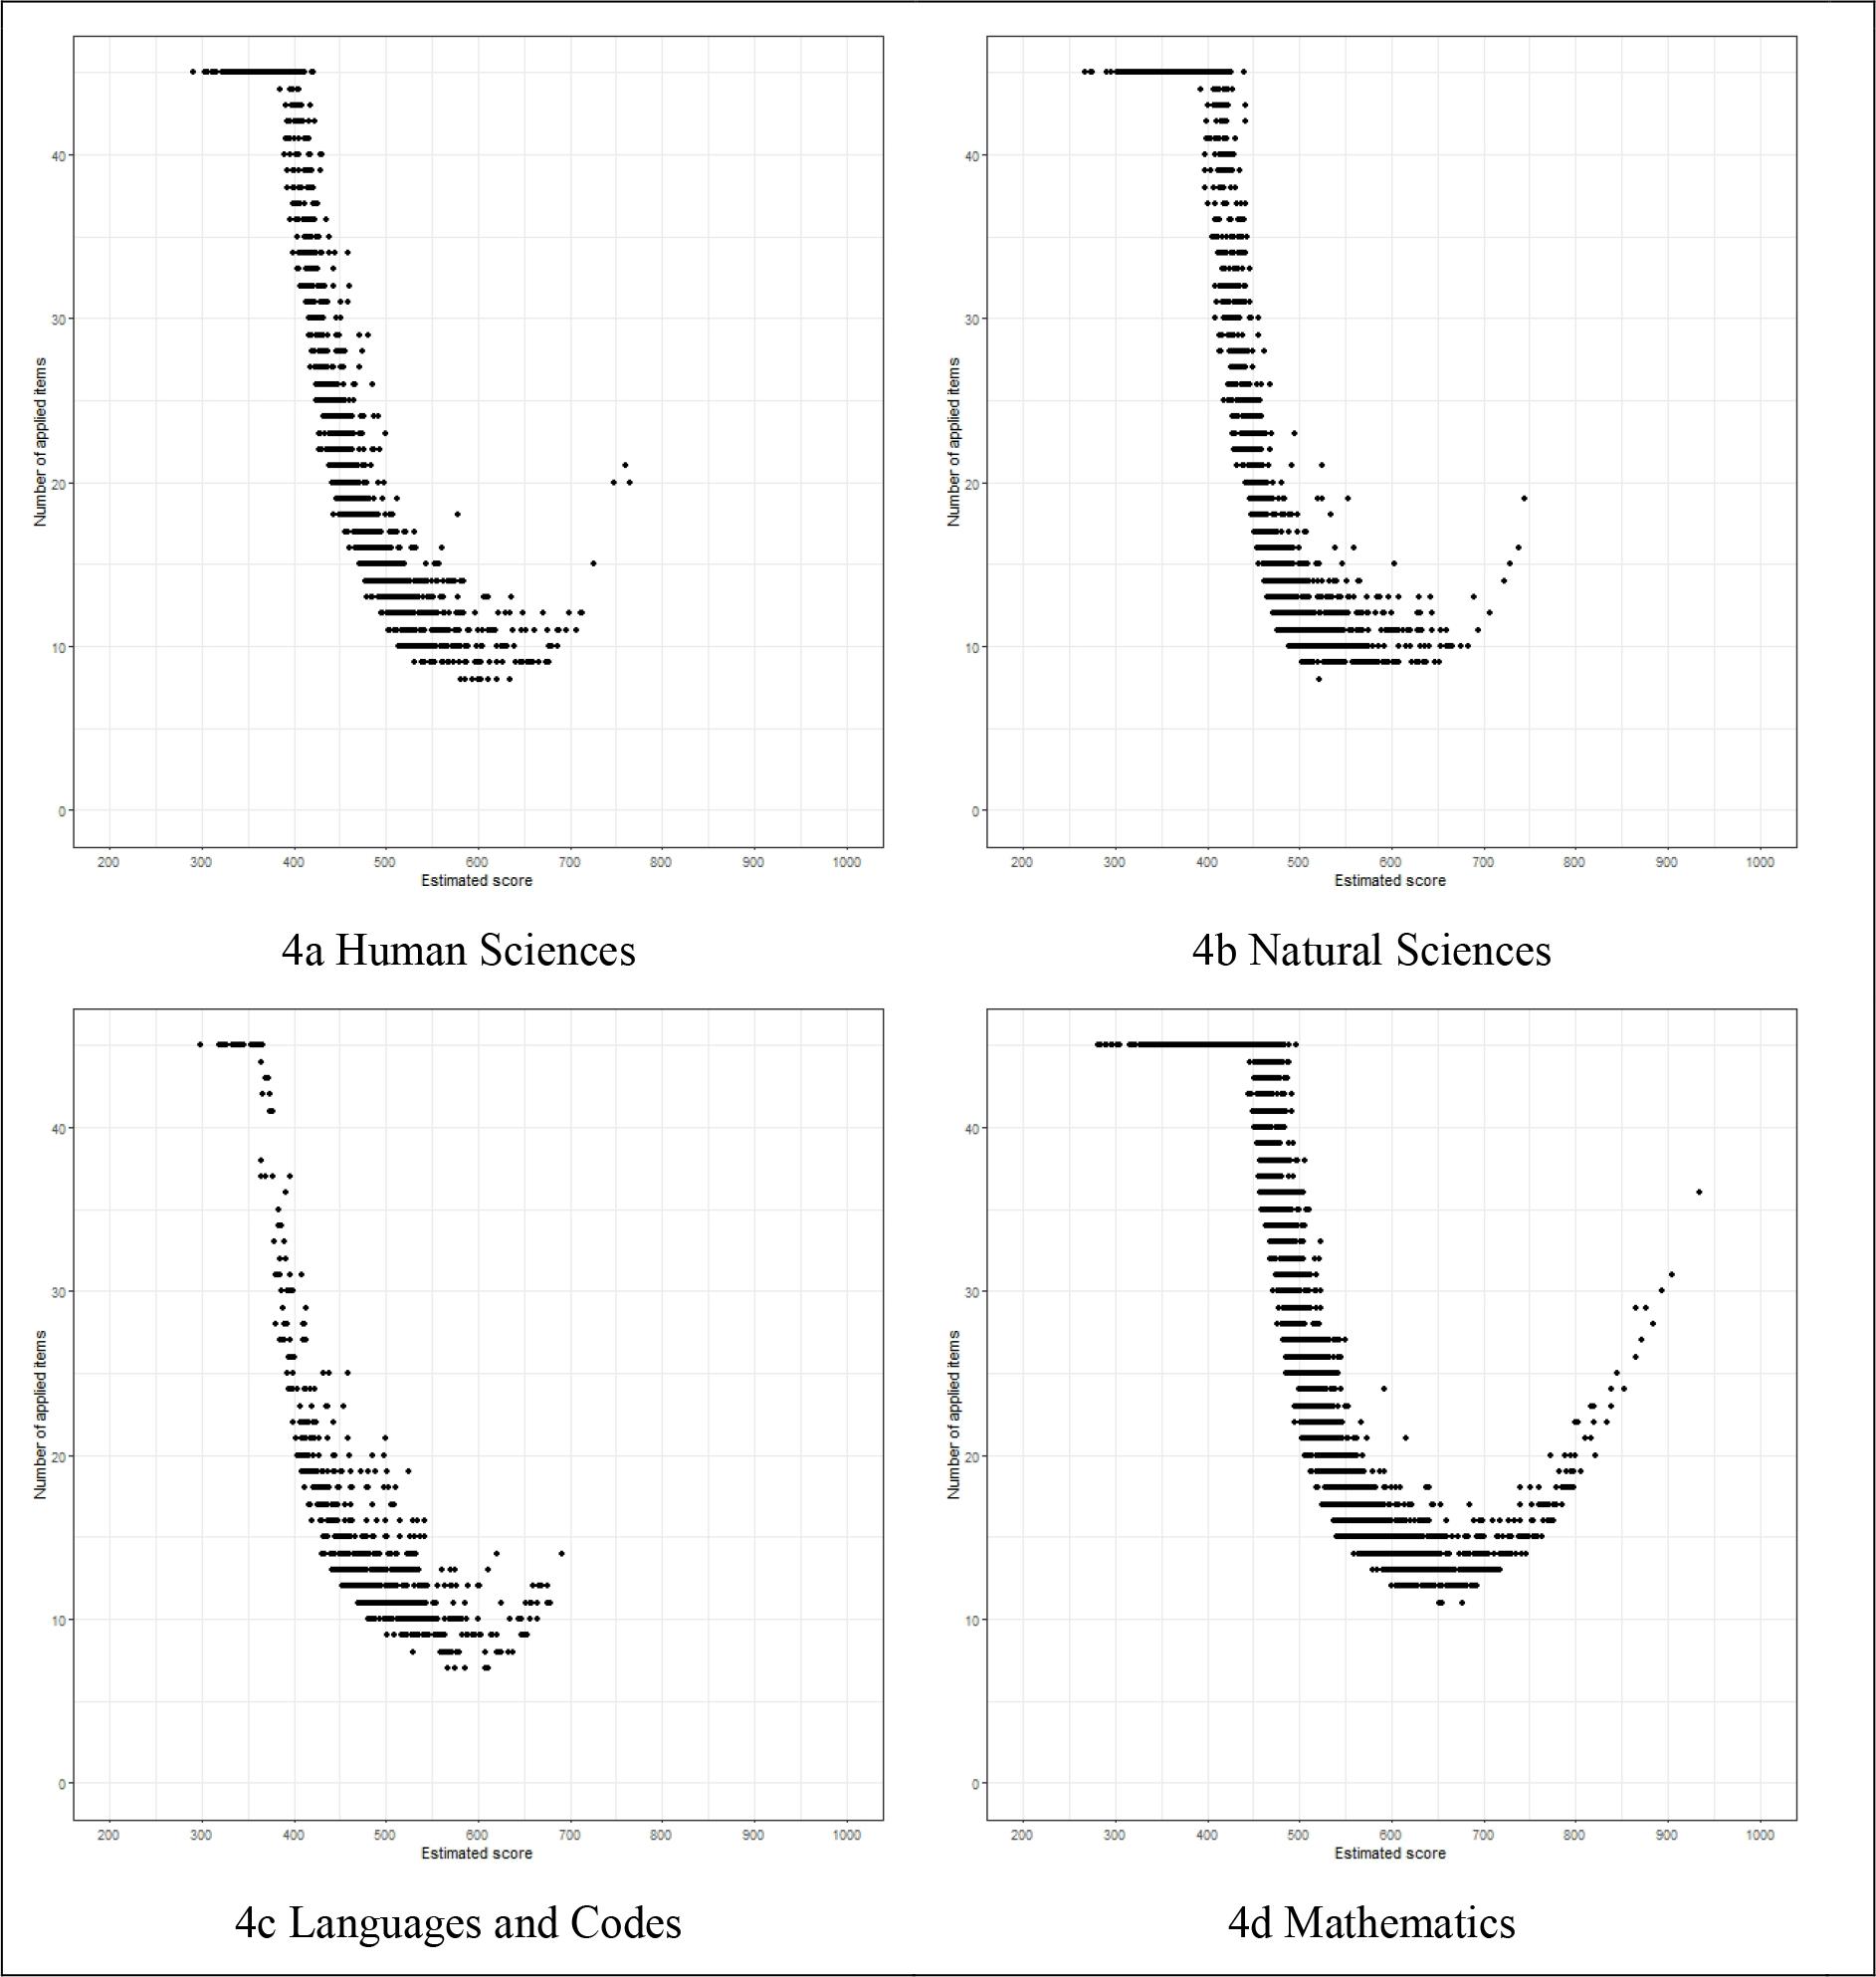
The CAT algorithm tended to give more items to participants located in regions with lower levels of information. In Figure 4, the number of items presented in the CAT is plotted against an estimated score. It is evident that 20 items were sufficient for participants with theta in the range of approximately: 500-750 (in HS); 525-750 (in NS); 500-700 (in LC); and, 615-800 (in MT).
Source: Authors’ elaboration.
FIGURE 4 Number of items presented according to the estimated score in each test
In the lower regions of the scale, the CAT algorithm administered more items. For example, in HS, all participants with theta less than 385.1 were presented 45 items; in NS, 393.6; in LC, 348.0; and in MT, 445.1. The highest theta of participants to receive 45 items in HS was 421.0; in NS, 439.3; in LC, 366.7; and in MT, 495.8. The test sizes of all participants with scores higher than these were reduced by at least one item.
DISCUSSION
In the present study, the goal was to determine whether it is possible to reduce the number of items in the Enem by using a CAT, without compromising reliability. Results show that, in the four knowledge areas assessed in the Enem, a reduction would be possible across a wide range of scales. The simulation ended with a maximum of 20 items in scale ranges that corresponded to 2.5 standard deviation units in HS; 2.2 standard deviation units in NS; 1.9 standard deviation units in LC; and 1.8 standard deviation units in MT. With a reliability of 0.91, 20 items could estimate 71.7% of participants’ scores in HS; 60.4% in NS; 94.8% in LC; and, 39.8% in MT. In all tests, for more than half of the participants the application did not reach 30 items.
In the present study, the average size of the HS application was close to that of the simulation conducted by Kalender and Berberoglu (2017) - 17 -, who used a 45-item bank from a Turkish higher education admission test, with accuracy as the stop criterion (0.30 error). They observed correlations between the CAT-based and original scores (linear test) ranging from 0.66 to 0.93. Our correlations all exceeded 0.90, which we expected, as we had a higher number of items in the bank.
We found that our simulation was more accurate than that of Spenassato et al. (2016), which simulated a CAT with 45 items of MT from the 2012 Enem. With a fixed application of 33 items, they observed a correlation of 0.99 between the CAT and the original scores (linear test), and a mean error of 0.35. In their linear application, the authors observed errors of up to 0.84. In our simulation, we found a maximum error of 0.56 with an average of 0.32 in MT. In contrast to their study, our item limit was 45. However, for 54.0% of the sample, 30 items were sufficient for an error of 0.30.
The article by Mizumoto et al. (2019) presented the possibility of reducing an English language vocabulary test consisting of three parts of 115, 73, and 56 items, for a fixed application of 20, 15, and 10 items, respectively. The proportion of samples with a measurement error of up to 0.33 ranged from 69.61% to 74.34%. HS (71.7%) with up to 20 items and NS (70.9%) with up to 30 items have similar proportions. Our proportion of LC applications, with 15 items or fewer, was higher (89.6%). In MT, 44 items were required to reach a similar percentage (65.6%).
It is important to highlight that our results indicate that the two tests with the most items (HS and LC), and with more targeted items (i.e., items whose difficulty distribution matches the theta distribution), provided the greatest reductions. This emphasizes the importance of a robust item bank for the CAT to reduce the test size effectively. A noteworthy point is, however, that the variation in the LC sample and population was the smallest among the four groups. Consequently, it is not necessary to cover more extreme regions of the scale. We conclude that in cases where the population has low variance, the item bank may be smaller than in cases where the population varies greatly. That is, the narrower the area where the population score is located, the fewer items one needs to estimate their score accurately. The smaller reduction in MT than in NS reinforces this point. The first area had a larger item bank, but the population variance was also greater. Future studies can verify the impact of the size of the variance on the need to increase the item bank.
In the present study, the results for all tests consistently show that the information curves peak to the right of the scale’s average (500). This indicates higher measurement accuracy for participants with above average ability levels. Consequently, the potential for test reduction is primarily limited to participants with theta scores above 500. These findings suggest a challenge in reducing the Enem across the entire range of the four scales.
It should be noted that the simulation bank had hundreds of items, and the algorithm selected those items that contributed the most to the accuracy of the participant’s score. However, for some subjects, even the 45 items (the same as on the Enem tests) could not achieve an error of 0.30. Therefore, even if the subject had answered the linear test, the error of their score would have probably been greater than 0.30. The CAT failing to reduce the test size for these subjects is not due to a limitation of the CAT algorithm but, rather, due to the limitation of the item bank to cover the lower theta levels equally.
Prior studies have also found limitations to limiting testing to certain ranges of the scale. For instance, Kalender and Berberoglu (2017) reduced the test to 25 items for scale intervals ranging from 2.8 to 4.3 standard deviations. In the present study, the reduction to 20 items occurred at intervals ranging between 1.8 and 2.5 standard deviations. Mizumoto et al. (2019) found that most scores with errors above 0.33 in their CAT simulation were above the scale mean. According to Spenassato et al. (2016), the region below the mean had the highest average measurement errors.
Given the small number of items (a maximum of 115) in the simulations described above, it is easier to understand the difficulties of achieving an adequate degree of precision. In our study, however, the item banks contained at least 674 items. Nevertheless, we observed a similar pattern. In light of this, there is a possible limitation of large-scale educational tests, which results in an excess of difficult items to discriminate high-ability students, but which do not have the same number of easy items which differentiate the lower-ability students better. With respect to the Enem, specifically, the low precision in the lower region of the scale may affect the selection of courses with low candidate-to-place ratio. Furthermore, it can also have a negative impact on the provision of public scholarships or funding. Consequently, the present study reinforces the need for developing easier items for the Enem.
Inep has developed guidelines for preparing and reviewing test items (Inep, 2010, 2012b). However, there are no objective guidelines on how to write items with predefined levels of difficulty. In order to support the orientation of their objective development, we recommend investigations into the factors associated with item difficulty. Some evidence has already been found that linguistic aspects of a large-scale educational assessment item may be related to its difficulty (Kan & Bulut, 2015; Masri et al., 2017).
It is a limitation of the present study that item exposure was not controlled, which would be crucial in a real field administration scenario. Moreover, the study did not consider the representativeness of the content of the knowledge areas (for example, curriculum topics and foreign language), as the only criteria for presenting the items was their information. Lastly, the present study used simulated responses that fit the models used. Therefore, our results might be biased towards an overly optimistic scenario. Additionally, the simulation relied on estimates from Study 1, rather than actual parameters of the Enem items. This could introduce further differences if CAT were to be implemented. Considering this, we recommend that future studies fill these gaps and include other criteria for stopping the application and selecting items in simulations.
A possible CAT implementation agenda in the Enem needs to include studies that identify how fatigue reduces measurement accuracy. Several studies have found a relationship between an item’s difficulty and its position in the test (Setzer et al., 2013; Ulitzsch et al., 2020). There are no studies using tests with characteristics similar to those of the Enem (i.e., high stakes and composed of four independent measures). First, although the present study has verified the possibility of reducing the Enem, we do not know if the reduction is sufficient to minimize the effect of fatigue on the answers. Second, the agenda should address the feasibility of large-scale CAT implementation in Brazil, considering factors like the availability of appropriate computer equipment and reliable internet infrastructure across the country.
CONCLUSION
The present study indicates that the Enem could be reduced to 20 items, for proportions ranging from 39.8% to 94.8% of participants, by using CAT. The reduction was most effective in domains where more items matched the distribution of proficiency skills in the population. By producing easier items in each of the four areas, the range of scale in which this reduction was possible can be expanded. We recommend that guidelines for producing items include objective aspects of the items related to their difficulty. We hope that the present study contributes to the improvement of large-scale educational assessments, particularly the Enem. Moreover, we expect the selection process for admission to universities to become increasingly cheaper, more efficient, and fairer, as well as to include people whose right to access to education is currently denied.

