


 Inglês (pdf)
 Artigo em XML
 Enviar este artigo por email
 Permalink
1 Introduction
The relationship between social and emotional skills or inattention, hyperactivity, and impulsive behavioral patterns and educational outcomes (such as school trajectory or learning) has been addressed by many studies in Brazil and internationally ( HECKMAN, 2012 ; MERRELL; TYMMS, 2001 , 2005 ; SANTOS; BERLINGERI; CASTILHO, 2017; SANTOS; PRIMI, 2014 ; TYMMS; MERRELL, 2006 , 2011 ). However, the discussion of this issue is still in its early days, particularly in Brazil, and requires further development with studies focusing on children at the beginning of pre-school, a mandatory stage of the schooling process 1 , and with longitudinal research design, which allows monitoring individuals’ learning over time.
This paper aimed to explore the potential of a questionnaire answered by teachers whose indicators of behavior and Personal, Social, and Emotional Development (PSED) were based on the criteria of the Diagnostic and Statistical Manual of Mental Disorders – Fourth Edition (DSM-IV, 1994) and their relationship with children’s cognitive development at the start of mandatory schooling. The questionnaire on PSED is divided into two parts. The first part comprises 16 items related to child behavior (which can be subdivided into inattention and hyperactivity-impulsivity), and the second part comprises 10 items related to PSED (including adaptation to the school environment and personal and social development).
This paper uses data from a longitudinal study that tracked 2,700 children during two years of pre-school. The study presents a probabilistic sample (with the school as its main unit) from a total of 46 schools and 132 class groups in the municipal Education system in the city of Rio de Janeiro. The study used an adaptation of the International Performance Indicators for Primary School (PIPS) instrument 2 for the collection of data about the children’s cognitive development (BARTHOLO et al ., 2020a). The analyses uses data on the children’s cognitive development collected in the first wave of the longitudinal study, when the children were in their first year of pre-school. In addition, they use data on behavior and PSED collected from a subsample of the children who participated in the longitudinal study through questionnaires administered to teachers of all the schools considered in the sample (132 class groups, 792 children) and contextual data on the children’s families taken from two sources: the questionnaire answered by parents/guardians and the Academic Management System (SGA) of the Municipal Education Department (SME). The study was approved by the Research Ethics Committee of the School of Philosophy and Humanities of the Federal University of Rio de Janeiro (UFRJ).
Apart from this introduction, the paper is divided into four parts. The first part presents studies addressing the behavior and socioeconomic development of students and their relationship to cognitive development and school trajectory as well as gaps in the findings of these studies in the Brazilian context. In the second part, the paper presents the study design and describes the sample, the cognitive instrument, and the questionnaire on behavior and PSED used. The third part describes the construction of the indicators of behavior and PSED, using bivariate and multivariate analyses, with a focus on the association between these indicators and the cognitive development of children entering the pre-school stage. This is followed by a discussion of the results as well as by possible convergences and divergences with the findings of national and international specialized literature on the issue. The implications of these results for educational policies are discussed at the end of the work.
2 The relationship between socioeconomic development, behavior, and cognitive development
Studies have shown that individuals with Attention Deficit and Hyperactivity Disorder (ADHD) tend to suffer from school violence and abuse, have eating disorders ( REINHARDT; REINHARDT, 2013 ), or face a significant risk of poor academic performance and failure, suspension, and drop-out as well as poor relationships with their family and peers, conduct and delinquency problems, and anxiety and depression, among others. Comorbidities must also be considered ( BARKLEY, 1997 ).
The DSM-IV divides ADHD into three subtypes: (i) predominantly inattentive; (ii) predominantly hyperactive/impulsive; and (iii) a combination of the two. For a clinical diagnosis to be made, it is necessary to meet various criteria, such as the prevalence of the behavior patterns over the last six months.
The causes of ADHD are constantly being studied, and results obtained in studies suggest that this disorder could be linked to genetic, environmental, or biological factors, such as fetal exposure to alcohol, drugs, or heavy metals, and problems during delivery ( BARKLEY, 1997 ). Moreover, some studies have suggested that the causes of each of the subtypes have different predictors, affecting individuals in different ways, including in the school environment.
Studies carried out by researchers at Durham University using PIPS instruments and methodology found a relationship between inattentive, impulsive, and hyperactive behavior patterns and academic results of children at the beginning of school life (MERRELL et al ., 2017; MERRELL; TYMMS, 2001 ; TYMMS; MERRELL, 2006 ). In these studies, teachers answer an instrument based on DSM-IV that measures such behavior patterns after at least six weeks of classroom activities.
Merrell and Tymms (2001) identified, in the first three years of schooling, a significant difference (effect size of up to -1.26) in the progress in language and mathematics between those who were severely inattentive, hyperactive, and impulsive and those who were not. The authors carried out an experimental study in England for measuring the impact of identifying children with severe symptoms of ADHD (but without a formal diagnosis) and advising schools, parents/guardians, and local Education authorities – LEAs ( TYMMS; MERRELL, 2006 ). The survey began with 73,367 children of around 4 years of age, 2,040 schools, and 24 LEAs (administrative regions). The schools were proportionally and randomly divided into quartiles and could receive materials on how to work with inattentive, impulsive, or hyperactive children and the names of the children; only the names of the children; only the materials; or none of these options.
The intervention that provided informative material to the teachers showed promising results. At the end of KS 1 (children aged between 5 and 7), the study compared the impact of each of the interventions for children with high scores on behavior scales and their peers. The dimensions “attitude toward reading/mathematics” and “behavior” of the children with severe symptoms of ADHD were positively impacted. Another result showed, for example, that the intervention combining the identification of the children and support materials worked better than merely the identification of inattentive, impulsive, or hyperactive children, which, in turn, did not show any significant effects on academic performance. On the other hand, an analysis of the whole sample of children, with and without characteristics of ADHD, showed a positive effect on reading for the whole group ( TYMMS; MERRELL, 2006 ).
The use of PIPS in South Africa suggests correlations of behavior with performance in reading and math of -0.34 and -0.35, respectively, suggesting that children who were inattentive, hyperactive, or impulsive could start their school activities with one standard deviation (SD) of difference from those who did not obtain low scores on the scale. The authors also carried out analyses with multilevel models, including several control variables, to estimate the development of language skills and math at the start of Grade 1. The results showed that children with characteristics of ADHD had lower development, in terms of mathematical and language skills, than their peers (effect size = -0.7, -0.8), which corresponded to a reduction of about 9 or 10 months of progress in terms of learning (TYMMS et al ., 2017).
On the other hand, there is a recent growing concern with understanding the relationship between socioemotional and cognitive development in children, especially in younger children, as social and emotional – or non-cognitive – skills can be better identified and developed while still in infancy (ALMLUND et al. , 2011; HECKMAN; STIXRUD; URZUA, 2006). These skills are also being investigated, with one of the objectives being to analyze their connection to students’ learning. Although these are factors largely related to individual children’s development, the interest of the studies is in investigating the extent to which social and emotional skills (for example, self-confidence or interpersonal skills) are malleable and whether they are good predictors of learning ( MERRELL; BAILEY, 2012 ).
With respect to the dimensions of social and emotional skills and their methods of measurement, the Collaborative for Academic, Social, and Emotional Learning (CASEL) has identified five interrelated competences for cognition, affectivity, and behavior. These are self-management, self-awareness, social awareness, relationship skills, and responsible decision making, listed as fundamental to being a good student, citizen, and worker and in reducing high-risk behaviors (CASEL, 2015). These elements, called the Big Five, or the Big Five Personality Traits, propose the dimensions of openness, agreeableness, conscientiousness, extroversion, and neuroticism.
In an extensive review of studies on the effects of non-cognitive skills in different moments of social life, Almund et al . (2011) found evidence that the Big Five personality traits have an important influence on academic performance and in standardized tests and on the likelihood of completing secondary Education and achieving good marks. The study showed that social and emotional skills may be just as or even more significant than cognitive skills, depending on the subject.
Along the same lines, Merrell and Bailey (2012) argued that, in an educational context, children with good interpersonal skills and control over their behavior or emotions tend to have better relationships with their teachers and peers. Working with a different scale from the Big Five and Casel, these authors used the three sections of PSED – adjusting to the school environment, personal and social development – and suggested that some of their items could indicate mental disorders or behavior problems, provided their scores remained high for a certain period, in agreement with the diagnoses proposed by the DSM-IV of ADHD, Opposer-Challenger Disorder (OCT), and autism spectrum disorder. In a model based on multilevel regression, PSED proved to be an excellent predictor of school performance at the ages of 4, 5, and 7, for both reading (0.564; 0.067; 0.042) and mathematics (0.549; 0.112; 0.100), controlling for sex and previous performance in both cases.
A longitudinal study performed in Serbia using PIPS methodology with 159 children aged between 5 and 8, found that the social skills section of PSED, measured at 5 years of age, could be a predictor of literacy skills at the age of 8 (B = 0.29), while controlling for gender and maternal Education (ALEKSIC et al ., 2019).
There are several high-quality Brazilian studies in the field of school effectiveness, which seek to understand school factors linked to academic performance, learning, or other results obtained by students, while controlling for individual characteristics (social background), student group composition, or other relevant factors. To understand differences between schools and within schools, such studies used measurement of internal factors (school input, educational processes, management, school climate, student input) and external factors (parents’ Education, place of residence, family income, ethnicity, and others) ( ALVES; FRANCO, 2008 ; FRANCO et al ., 2007; KARINO; LAROS, 2017 ). However, most studies of school effectiveness carried out in the Brazilian context used data from large-scale assessments with cross-sectional designs in their analysis, rather than focused on academic results at the start of compulsory Education. Therefore, they were unable to control for pre-existing differences between students or selection bias ( GODSTEIN, 1997 ) and the cross-section data do not allow for observation of inequalities already present at the start of school life (FRANCO; BROOKE; ALVES, 2008).
Furthermore, we identified only a few studies that sought to understand the relationship between behavior and socioemotional development and educational results/school trajectory. We noticed that previous research did not focus on the initial period of compulsory schooling and, in many cases, used a reduced number of cases.
Using the Social and Emotional Nationwide Assessment (SENNA) instrument 3 , in a project carried out in the state-run Education system of Rio de Janeiro, Santos and Primi (2014) sought to understand the relationship between socioemotional development and school learning (marks in Portuguese and Mathematics at SAERJINHO) based on a sample of 24,605 primary and secondary school students. The report concluded that conscientiousness, locus of control, and openness to new experiences were the most relevant attributes for results in mathematics and Portuguese ( SANTOS; PRIMI, 2014 ). Other studies, such as the work by Santos, Berlingeri, and Castilho (2017) used the SENNA instrument and reported similar results for students in their first year of secondary school in the Brazilian state of Ceará.
Different from the above-mentioned studies, the data considered in this article refer to the start of the process of mandatory schooling. There is extensive literature on the impact of pre-school on the school trajectory in the short and long terms ( MELHUISH, 2013 ; SYLVA et al ., 2004, 2006). This literature shows that access to a high-quality pre-school can have a positive impact on the growth and development of children at a lower socioeconomic level (TYMMS; MERREL; HENDERSON, 1997), reduce the risk of social vulnerability throughout life (SYLVA et al ., 2006), or interfere with cognitive and socioeconomic results well beyond the age of six (SYLVA et al ., 2004). On the other hand, children with high scores on a scale to identify behaviors characteristic of inattention, hyperactivity, and impulsivity tend to show slower development, when compared to their peers ( TYMMS; MERRELL, 2006 ).
This article seeks to help fill the gap in studies carried out in the Brazilian context, by trying to understand the relationship between behavior, socioemotional development, and cognitive development in children starting their compulsory schooling period, based on indicators of inattention, hyperactivity/impulsivity, and PSED. However, one must bear in mind that the purpose of this article is not to estimate prevalence rates for ADHD or discuss diagnosis and treatment, but to show empirical data of children who, even while lacking a formal diagnosis, are considered inattentive or hyperactive/impulsive by their teachers.
3 Methodology
The analyses use data collected in a longitudinal study performed in the municipal state-run Education system in the city of Rio de Janeiro. This was a research project to identify school factors (such as school input, organization of supply, qualifications of teachers, concepts of Education) and family/children characteristics associated with the cognitive, motor, and socioemotional development of the children (BARTHOLO et al ., 2020b).
The study presents a probabilistic sample by conglomerate (using the school as the primary sampling unit), stratified by characteristics of supply (only Pre-school x Pre-school + Primary School) and the administrative area of the SME. A total of 46 schools were selected to take part in the study, and all children in the first year of pre-school (PRE I) were eligible to participate (132 class groups and some 2,700 children). The first data collection was conducted when the children were entering the first year of pre-school.
The present study only used data from the first wave of data collected between March and April 2017. It used models based on multivariate regression to identify factors associated with the cognitive development of children when they start pre-school. The explanatory model has three main dimensions: a) the age of the child at the time of data collection; b) social and economic characteristics of the families; and c) indicators of behavior and PSED.
To measure cognitive development, this study used the PIPS instrument, adapted to Portuguese (BARTHOLO et al ., 2020a). PIPS is a methodology that uses an adaptive test with stopping rules to collect information on the development of language and mathematical skills (BARTHOLO et al ., 2020b). The language dimension is divided into five parts: vocabulary, phonological awareness, ideas about reading, identification of letters, and reading (words and sentences). The mathematics dimension has six parts: ideas about mathematics, counting of objects, identification of shapes, identification of numbers, addition and subtraction, and solution of formal arithmetic problems.
The results obtained by PIPS are expressed in items that are correctly answered, incorrectly answered, or not answered. To ensure the reliability of the comparison of results and avoid the non-linearity of the PIPS scale, the Rasch measurement, a subset of the groups of models known as Item Response Theory (IRT) is used ( BOONE, 2016 ; KHINE, 2020 ), which considers the difficulty of each item as well as the distribution of the answers. The scale was generated using the Winstep software, and the same technique was used in the construction of the indicator of socioeconomic status (SES) 4 .
For collection of information on the children’s behavior and PSED, six students were selected from each of the class groups in the schools in the sample. The instrument was filled in by the teacher, without the presence of the researchers, to show specific answers for each of the children included in the sample. In Wave 1, 792 questionnaires were sent, and the response rate was 81% (678 questionnaires).
Two scales were used to measure the children’s behavior and PSED. The first of these was based on the DSM-IV, with some adaptations in line with the Brazilian context. The results shown are based on a behavior scale comprising 16 items: seven in the construct of inattention; six related to hyperactivity; and three on impulsivity.
The Chart 1 shows the 16 items of the questionnaire used to prepare the indices of behavior related to inattention, hyperactivity, and impulsivity.
Chart 1 Items on the behavior scale based on DSM-IV
Source: Prepared by the authors (2020)
The second scale, known as PSED, had 11 items originally, while the Brazilian version (translated as DPSE) had only 10 items. This scale can be divided into three subscales: “adjusting to the school environment,” “personal development,” and “social development.” The combination of some of these items could suggest development impairment and even difficulties with social coexistence. The Chart 2 shows the items and their descriptors.
Chart 2 Items on the Personal, Social and Emotional Development (PSED) Scale
| Adjusting to the School Environment | |
|---|---|
| Comfortable | Investigates the extent to which the child feels comfortable when separated from their main guardian and the child’s skill in dealing with transitions between environments and activities during the day |
| Independence | Explores how dependent the child is on adults or other children, such as in daily activities like getting dressed or going to the bathroom |
| Personal Development | |
| Self-confidence | Measures the child’s desire to take part in group activities and related skills |
| Concentration on teacher-directed activities | Calculates concentration on teacher-led activities, meaning whether the child is able to maintain concentration, rather than being distracted by other activities |
| Actions | This item looks into a child’s impulsiveness. Do they act without thinking of the possible consequences, for self or others? Do they show appropriate behavior and good interaction with others? |
| Social | |
| Relationships to peers | Measures the child’s skill in communicating, making friends, or perceiving other children’s feelings |
| Relationship to adults | Measures the child’s skill in approaching and communicating with adults while interacting in an appropriate and confident manner |
| Social rules | Investigates the extent to which the child manages to obey rules and not distract their colleagues |
| Cultural awareness | Seeks to examine the extent to which the child understands that other people may have different ways of life and that this is something to be respected |
| Communication | Checks whether the child is able to communicate fluently and coherently, listen to what others have to say, respond appropriately, and know how to alternate the act of speaking within a conversation |
Source: Prepared by the authors (2020). Adapted from Merrell and Bailey (2012)
The behavior scale has six possible answers: never, rarely, sometimes, often, almost always, always; this entails point scores from 0 to 5, sequentially. This means that a score of “3” corresponds to “often,” which is considered the minimum score to be determined as a “high score.” The PSED score has an opposite logic to it. In this score, there are five possible responses, with point scores of 1 to 5, with the highest point score being considered the most appropriate behavior.
The indicators used in the following analysis were constructed based on factorial analysis, using the Statistical Package for the Social Sciences software (SPSS 20). All 16 items of the behavior scale were included in the principal component analysis, both for the scree plot and the component matrix. The former had factorial scores more associated with items J to R, and the latter to items A to I. It was decided not to rotate the matrix and to use the pairwise exclusion method.
For the items of the PSED scale, the same procedure was followed, resulting in two factors, the first associated with all items and the second significantly associated with items 5, 6, and 9 (with loads over 0.3).
It is important to note that the scales used were adapted to the DSM-IV and in relation to the methodologies proposed and used in some countries through PIPS, thereby presenting limitations for international comparability.
4 Analyses
Chart 3 shows the description of the variables used in the analyses and Table 1 can be seen for the identification and the descriptive statistics for the variables used in the models.
Chart 3 Descriptions of the variables used in the analyses
| Variables | Type | Description | Source |
|---|---|---|---|
| Dependent Variables | |||
| Language – Wave 1 | Continuous | Measurement of Language in Wave 1 | Longitudinal Study |
| Mathematics – Wave 1 | Continuous | Measurement of Mathematics in Wave 1 | Longitudinal Study |
| Explanatory Variables | |||
| Sex | Dichotomic | Shows the sex of the child (0 = girl, 1 = boy) | SGA/SME |
| Age | Discrete | Shows the age of the child in months | SGA/SME |
| Ethnicity | Dichotomic | Shows the child’s ethnicity, as declared by parents or guardians (0 = Nonwhite, 1 = White) | SGA/SME |
| NSE | Continuous | This is an indicator calculated based on possession of assets in the household, level of schooling of the people responsible, and participation in income transfer plans. | SGA/SME and Longitudinal Study |
| Inattention | Continuous | Indicator prepared based on factorial analysis – Factor 1 (items A to I) | Longitudinal Study |
| Hyperactivity/Impulsivity | Continuous | Indicator prepared based on factorial analysis – Factor 2 (items J to R) | Longitudinal Study |
| PSED | Continuous | Indicator prepared based on factorial analysis | Longitudinal Study |
Source: Prepared by the authors (2020)
Table 1 Descriptive Statistics for the Variables Used in the Analyses
| Variable | Mean | Standard Deviation | Min | Max |
|---|---|---|---|---|
| Language – Wave 1 | -0.30 | -0.98 | -4.8 | 2.7 |
| Mathematics – Wave 1 | -2.82 | 1.32 | -8.06 | 2.05 |
| Sex | 0.54 | - | - | - |
| Age | 4.43 | 0.33 | 3.92 | 5.89 |
| Ethnicity | 0.36 | - | - | - |
| Social and Economic Status - SES | 0.35 | 1.50 | -3.30 | 4.24 |
| Inattention | 0.00 | 1.00 | -1.33 | 2.96 |
| Hyperactivity/Impulsivity | 0.00 | 1.00 | -1.25 | 2.53 |
| PSED | 0.00 | 1.00 | -3.37 | 2.01 |
Source: Prepared by the authors (2020)
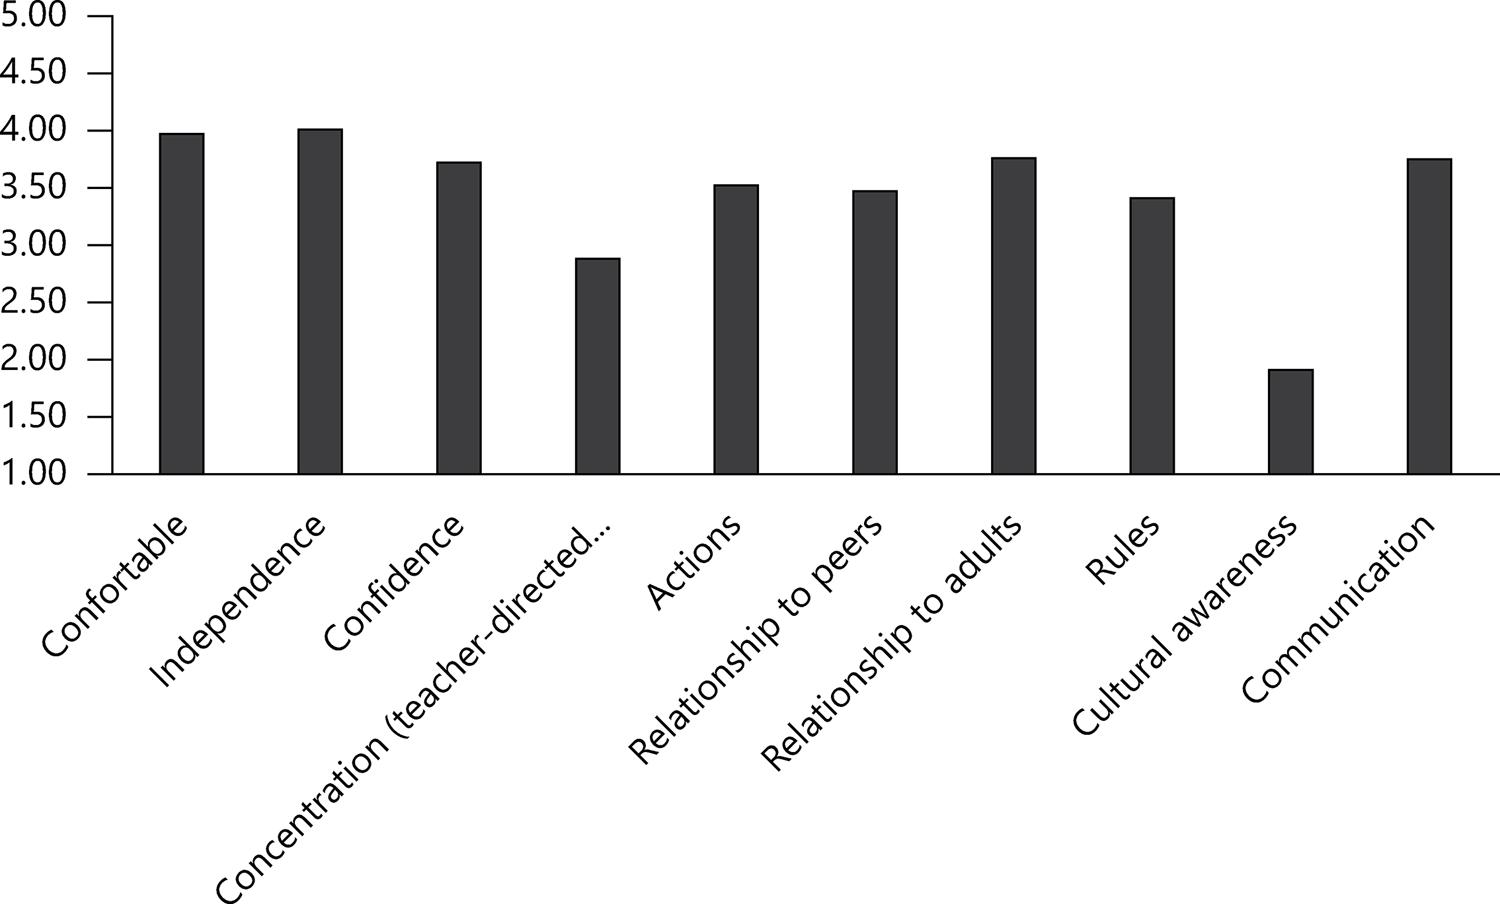
The first analyses carried out show a description of the behavioral scales and PSED, based on the mean scores (on a scale from zero to 5). All 678 cases were included at this time. Graph 1 shows how children, overall, scored on the 10 items that make up the PSED scale.
Source: Prepared by the authors (2020)
Graph 1 Mean scores obtained in personal, social, and emotional development (PSED), per item
According to the teachers’ reports, the children were comfortable within the school environment and managed to systematically deal with transitions between environments in a satisfactory way, showing themselves to be independent of an adult in common daily activities, with mean point scores between 3.97 and 4.01.
The lowest scores as observed were for the dimensions of cultural awareness (1.91); concentration on teacher-directed activities (2.88); compliance with social rules (3.41); and relationships to peers (3.76). A lower mean score suggests that the children are not very aware that they live in a society where several different cultures coexist and that all such cultures need to be respected. A score of less than 3.00 points in “concentration” would suggest that the students were not fully able to ignore distractions. It is also very important to remember that the children were about 4 years old and that many of the scores obtained were compatible with this age bracket (TYMMS et al ., 2017). Even so, the information as shown here presents the standard of PSED of the children at the start of their first year of mandatory schooling and suggests that some students may need additional support in areas such as concentration.
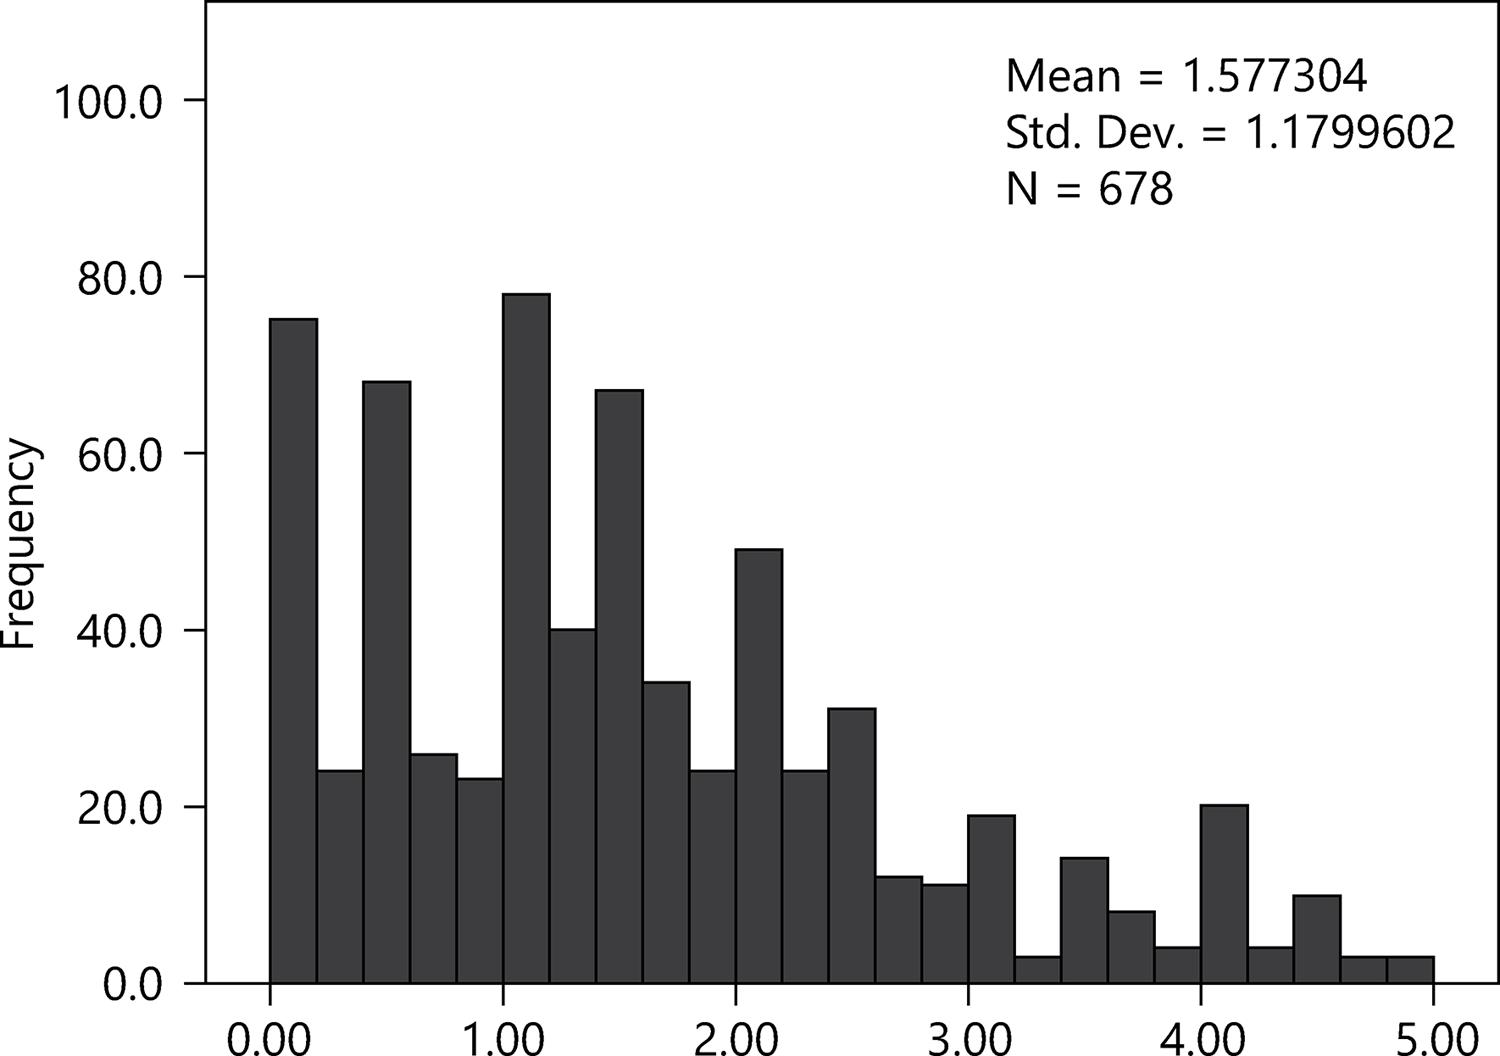
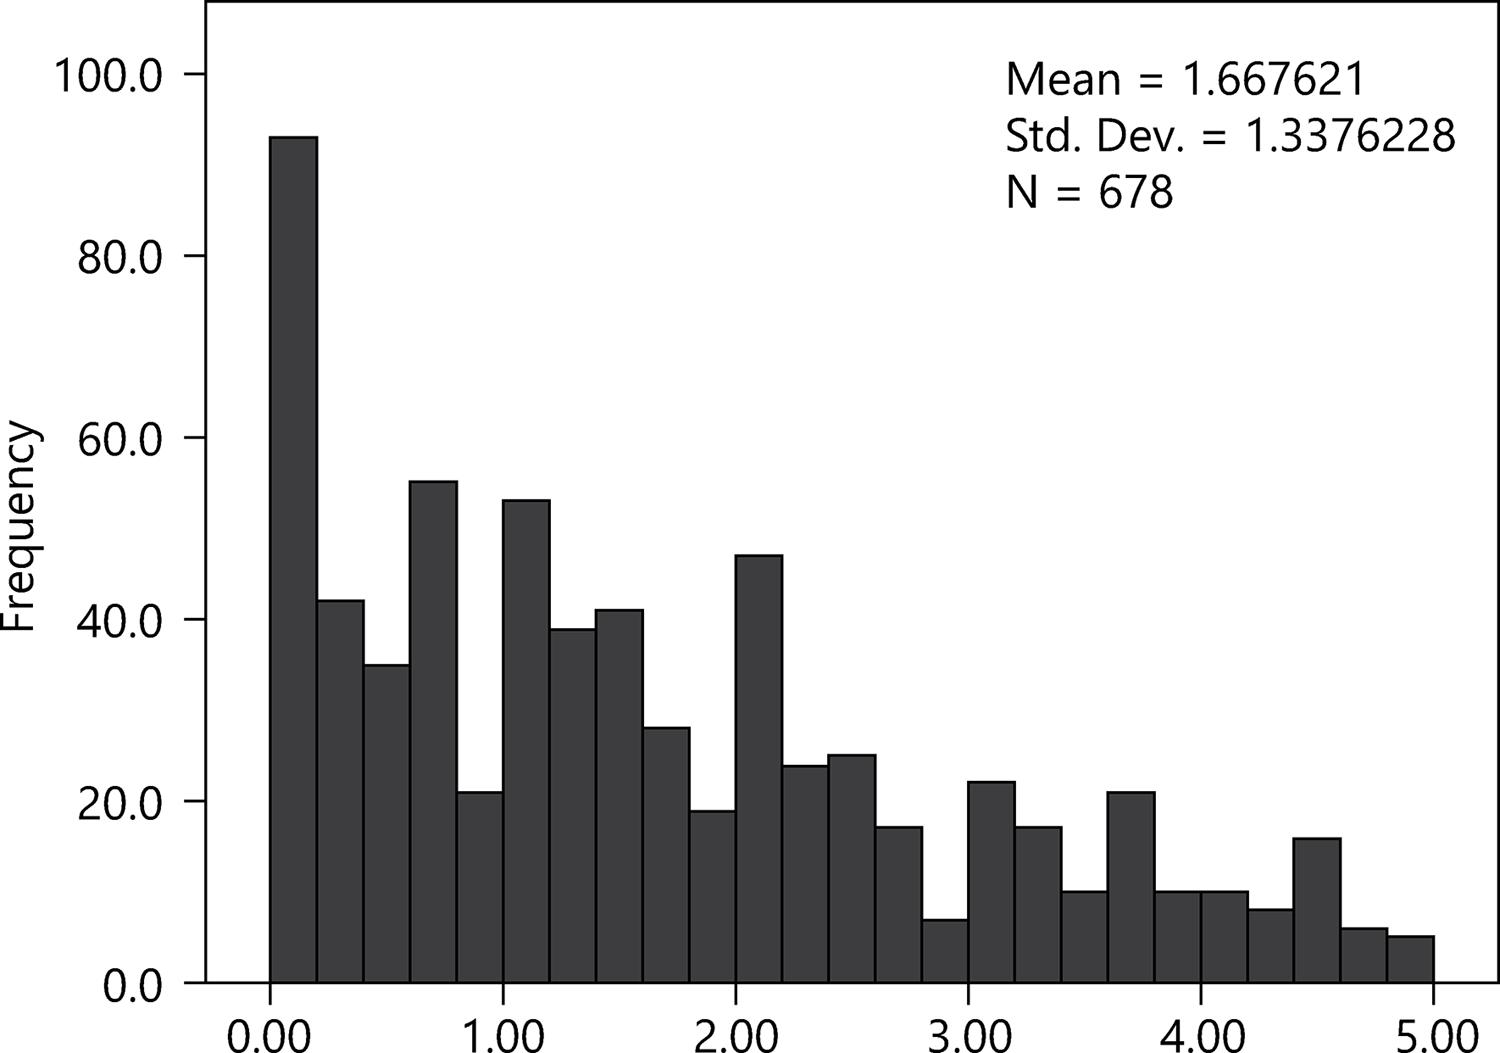
Graphs 2 and 3 show the distribution of the values as assigned to the children by the teachers concerning the dimensions of inattention and hyperactivity/impulsivity, respectively. The data suggests that most children obtained scores between zero and 2, which corresponds to the answers of “never” and “sometimes” for these behaviors. However, there was a significant number of children who were classified as 4 or 5, indicating that they “always” or “almost always” showed characteristics of inattentive behavior.
Source: Prepared by the authors (2020)
Graph 2 Distribution of the point scores obtained for inattention
Source: Prepared by the authors (2020)
Graph 3 Distribution of scores obtained in the dimensions of hyperactivity and impulsivity
Table 2 shows the correlations between behavior indicators and PSED, and the dependent variables within the multivariate regression model. The data suggest a negative correlation between the indicators of inattention and hyperactivity/impulsivity and the development of the child in language and mathematics. The more inattentive or hyperactive/impulsive the child, the lower their development in the two above-mentioned dimensions, which corroborates the literature on the subject ( MERRELL; TYMMS, 2001 ; TYMMS et al. , 2017; TYMMS; MERRELL, 2006 ).
Table 2 Correlation between dependent variables and indicators
| Language Wave 1 | Mathematics Wave 1 | Inattention | Hyperactivity/Impulsivity | PSED | |
|---|---|---|---|---|---|
| Language Wave 1 | 1 | - | - | - | |
| Mathematics Wave 1 | 0,574 ** | 1 | - | - | |
| Inattention | -0,333 ** | -0,287 ** | 1 | - | |
| Hyperactivity/Impulsivity | -0,118 * | -0,70 | 0,607 ** | 1 | |
| PSED | 0,394 ** | 0,274 ** | -0,730 ** | -0,437 ** | 1 |
Source: Prepared by the authors (2020)
Note: * p < 0.05, ** p < 0.01
The PSED indicator showed a positive correlation with the indicators of cognitive development. Once again, the findings corroborated other international studies on the matter. Children who are better adapted, follow the rules, and have good concentration, normally achieve better results in development tests in language skills and mathematics.
Table 3 shows the correlation between the behavior indicators and those of PSED, and the model’s control variables. The results show that the variables of ethnicity and SES had non-significant correlations with the three indicators. The variable of “sex” as significant for all indicators, being weak, yet positive for inattention and hyperactivity/impulsivity and negative for PSED. The bivariate correlations suggest that, on average, boys tended to be more inattentive and had less social and emotional development, compared to girls.
Table 3 Correlation between indicators and control variables
| Inattention | Hyperactivity/Impulsivity | PSED | Sex | Ethnicity | Age | SES | |
|---|---|---|---|---|---|---|---|
| Inattention | 1 | .597 ** | -.724 ** | .214 ** | .006 | -.123 ** | -.070 |
| Hyperactivity/Impulsivity | - | 1 | -.428 ** | .229 ** | .031 | .028 | -.036 |
| PSED | - | - | 1 | -.283 ** | -.013 | .113 ** | .061 |
| Sex | - | - | - | 1 | - | - | - |
| Ethnicity | - | - | - | - | 1 | - | - |
| Age | - | - | - | - | - | 1 | - |
| SES | - | - | - | - | - | - | 1 |
Source: Prepared by the authors (2020)
Note: ** p < 0.01
Tables 4 and 5 show the estimated coefficients for the five different models of linear regression.
Table 4 Models of linear regression estimating language skills on entering pre-school
| Model 1 | Model 2 | Model 3 | Model 4 | Model 5 | |
|---|---|---|---|---|---|
| Age | 0.298** | 0.259** | 0.298** | 0.250** | 0.251** |
| Sex (male) | -0.107 | -0.055 | -0.083 | -0.064 | -0.013 |
| Ethnicity | 0.048 | 0.045 | 0.050 | 0.042 | 0.051 |
| SES | 0.260** | 0.246** | 0.256** | 0.246** | 0.234** |
| Inattention | - | -0.262** | - | -0.314** | - |
| Hyperactivity/Impulsivity | - | - | -0.102** | 0.087 | - |
| PSED | - | - | - | - | 0.323** |
| R2 | 0.165 | 0.230 | 0.175 | 0.234 | 0.259 |
| N | 424 | 424 | 424 | 424 | 424 |
Source: Prepared by the authors (2020)
Note: ** p ˂ 0.01
Table 5 Models of linear regression estimating mathematical skills on entering pre-school
| Model 1 | Model 2 | Model 3 | Model 4 | Model 5 | |
|---|---|---|---|---|---|
| Age | 0.276** | 0.245** | 0.276** | 0.231** | 0.247** |
| Sex (male) | -0.032 | 0.009 | -0.024 | -0.007 | 0.027 |
| Ethnicity | 0.040 | 0.038 | 0.041 | 0.034 | 0.042 |
| SES | 0.251** | 0.240** | 0.251** | 0.240** | 0.235** |
| Inattention | - | -0.207** | - | -0.297** | - |
| Hyperactivity/Impulsivity | - | - | -0.031 | 0.148* | - |
| PSED | - | - | - | - | 0.201** |
| R2 | 0.137 | 0.177 | 0.138 | 0.190 | 0.173 |
| N | 424 | 424 | 424 | 424 | 424 |
Source: Prepared by the authors (2020)
Note: ** p ˂ 0.01, * p ˂ 0.05
Model 1 shows the variables related to the social and demographic characteristics of the children, namely age, sex, and SES. Model 2, apart from the control variables as previously mentioned, also included the indicator for inattention. Even after controlling for the above-mentioned variables, the inattention indicator shows a strong to moderate association in the models that estimated language and mathematical development (effect sizes of 0.61 and -0.47, respectively). The insertion of this indicator contributed to the adjustment of both models.
Model 3 included the control variables as well as the indicator for hyperactivity/impulsivity. Once again, we note a negative correlation between the indicator and the development of language and mathematical skills; however, the size of the effect was larger in the case of language skills (effect size of -0.23) and was not statistically significant for mathematical skills.
Model 4 included the two behavior indicators as well as the control variables. It is interesting to note that the indicator of inattention continued to show a strong and moderate negative association with language and mathematical skills, respectively. However, when controlling for inattention, the indicator of hyperactivity/impulsivity began to show a positive association with the children’s cognitive development. This association was statistically significant in the case of mathematical skills. This result corroborates the findings of international studies that used the same instruments in England ( MERRELL; TYMMS, 2005 ; TYMMS; MERRELL, 2011 ).
Finally, Model 5 included the PSED indicator, which showed a strong positive correlation with the development of children in terms of language skills (effect size 0.76) and a moderate correlation in mathematical skills (effect size 0.46). As seen in the models, the insertion of this indicator helps to improve the adjustment of the model if compared with Model 1, particularly in the case of language skills (R 2 increases from 0.165 to 0.259).
Table 6 below presents a summary of the effect sizes 5 calculated based on the parameters as estimated for models 2, 3 and 5 in both language and mathematics skills.
Table 6 Effect size of the indicators for behavior and Personal, Social, and Emotional Development (PSED)
| Model 2 | Model 3 | Model 5 | ||||
|---|---|---|---|---|---|---|
|
| ||||||
| Language | Mathematics | Language | Mathematics | Language | Mathematics | |
| Inattention | -0.606** | -0.474** | - | - | - | - |
| Hyperactivity/Impulsivity | - | - | -0.228** | -0.069 | - | - |
| PSED | - | - | - | - | 0.761** | 0.459** |
Source: Prepared by the authors (2020)
Note: ** p ˂ 0.01
5 Discussion and Conclusions
The coefficients as estimated in the models suggest a moderate and negative correlation between inattention and cognitive development; a weak and negative correlation between hyperactivity/impulsivity and cognitive development; and a strong and positive correlation between PSED and cognitive development. Model 4, with indicators for inattention and hyperactivity/impulsivity, had a negative sign for the former and a positive sign for the latter. This result corroborates the findings of Merrell et al . (2017), Merrell and Tymms (2005) and Tymms and Merrell (2011) , which suggest that hyperactivity/impulsivity does not have a negative association with cognitive development, when controlling for the inattention indicator.
These results have important practical implications for teachers and other professionals working in schools. Inattention, according to the preliminary results of the study, is the dimension that should be carefully observed by teaching staff and other school professionals who work with children and their families, as there is an important negative correlation with children’s cognitive development. There exist simple and low-cost strategies that have already been tested to help with the development of students who show moderate to high levels of inattention ( TYMMS; MERRELL, 2006 ).
The present study found a stronger correlation for language skills than for mathematics skills, both for behavior and for PSED, not in line with Pastura, Mattos and Araújo (2005) findings. One point that could elucidate this apparent divergence is the age bracket of the children in the present study, which, overall, involved younger children than other studies.
The model that included the indicator for PSED for language skills was the best adjusted (R 2 ) and had an effect size larger than the coefficients of behavior indicators and variables widely studied and discussed within the educational field, such as the SES of the family unit. This difference shows the importance of social and emotional skills, as increasingly reported in the literature ( ALEKSIC, 2019 ; ALMLUND et al ., 2011; (HECKMAN; STIXRUD; URZUA, 2006). Once again, what is noteworthy in the results presented is the age bracket studied (children enrolled in pre-school) and the consistency of the results when compared with other findings in national and international studies that reinforce an association between social and emotional skills and cognitive development ( CASEL, 2015 ; SANTOS; PRIMI, 2014 ). It is important that other studies replicate this study with other samples and instruments to confirm the results in other contexts.

