


 Inglês (pdf)
 Artigo em XML
 Enviar este artigo por email
 Permalink
Introduction
In Mozambique, traditional methods of teaching are used, with no technological aids (such as the internet, computers, projectors, interactive whiteboards, tablets and mobile phones) being used. This hinders the implementation of new technological methodologies that facilitate teaching. As stated by António and Coutinho ( 2012 , p. 1), the integration of information and communication technologies (ICTs) into general secondary education (GSE) in Mozambique is still in its infancy. The reality of internet access or computer use remains a distant prospect for many students. Nevertheless, the Mozambican government’s initiatives to promote the use of ICTs in education have been implemented with the objective of integrating ICTs into Mozambican schools. Since 1998, the Mozambican government has implemented various initiatives to provide some schools with computer equipment. However, these efforts have not yet yielded the desired outcomes. It has been observed that the computer equipment donated to schools becomes obsolete without being used, frequently due to a lack of in-house technical capacity to operate it. In remote areas, where access to basic services is limited, the introduction of technology is often perceived as an unattainable goal. This is compounded by the country’s ongoing challenges with hunger, natural disasters and war (terrorism), which have collectively made the integration of technology in education a low priority.
It is not possible to utilize technological resources (TR) in the classrooms, as there are insufficient spaces for their integration, the switches are in a state of disrepair, and there is a dearth of interactive whiteboards, projectors, computers, tablets, and smartphones. The majorities of classrooms are equipped with desks and chairs for students, a table and chair for the teacher, and a blackboard and chalk. The classrooms are only prepared for traditional teaching, without the integration of infrastructure for technology. This is particularly problematic when considering the abstract content of Technical Drawing (TD) and Descriptive Geometry (DG), which requires a different approach to teaching.
Given that traditional Mozambican teaching does not employ the use of TR to facilitate 3D representation and promote 3D spatial visualization (SV), which represents the greatest difficulty for GSE students, the two technological applications (TA) selected for this research are Qubism 3D Modelling (Q3DM) and the dynamic geometry software GeoGebra (Geogebra). The research question is therefore:
Does the 3D modelling software Qubism and the dynamic geometry software GeoGebra adapted for smartphones improve spatial visualization in the study of Orthogonal Projections and Cylindrical Sections?
Technology
Technology has brought a range of resources and applications that can be used in education as a didactic means of learning various contents in all areas of knowledge. Gil ( 2014 , p. 89, our translation) argues that “in an increasingly digital society in which any service requires citizens to use digital platforms or devices to exercise their civic duties”. According to Gil ( 2014 ), in this digital age, teachers have not been left out of this dynamic, and it is imperative that they equip themselves with technological platforms to benefit their activities.
The term technology is widely used in business and science, and it is defined as the process of transforming basic knowledge into a useful application. In this context, technology is defined as a set of skills for a specific functionality (Singo, 2018). According to Singo (2018), this science is applied to a single activity, but with various techniques. Furthermore, technology can be defined as a technique developed to solve a specific problem in an efficient manner. This can be conceptualized in two different ways: firstly, through the existing relationship of techniques and equipment; and secondly, through new technologies, considering the concept of innovation (Kenski, 2012 apud Assis, 2015 ). For Kenski (2012 apud Assis, 2015 ), technology can be realized through resources with specific procedures and through an innovative tool, with the objective of providing benefits.
Technology in Mozambican education
In Mozambique, the teaching process is traditional and lacks the use of technological resources. All the initiatives, including SchoolNet Mozambique, NEPAD (Partnership for Africa’s Development), SchoolNet Mozambique, MoRENet (Mozambique Research and Education Network), and One Laptop per Child (António; Coutinho, 2012 ), are focused exclusively on the ICT subject. It is imperative that the Ministry of Education and Human Development acknowledges the pervasive integration of ICT across all curricular subjects. In particular, in subjects with a practical component, technology can be employed as a pedagogical tool to overcome the difficulties of abstract content and allow computer simulations in practical lessons at a low cost. Even in the ICT subject, the programs are not widely mastered in the Mozambican school environment. If the objectives of the various initiatives mentioned above had been fulfilled, some of the problems posed by online classes as a result of the Covid-19 pandemic would have been reduced (Cossa, 2022 ). The technological revolution presents an opportunity for education to integrate these resources into its context, particularly by training teachers who can interact with assimilating and benefiting from these new technological tools. In the context of GSE and the subjects of TD and DG, it is evident that there is a need for curricular reform at the Pedagogical University of Maputo, specifically in the Visual Education and DG course.
It is recommended that future teachers are trained in the use of various technologies suitable for teaching. The introduction of computer simulations in accessible resources is intended to facilitate the practice of experiments at a low cost but with a high level of quality. It is important to reiterate that technologies in GSE in Mozambique should not be confined to the ICT subject alone. There are numerous applications for all curricular subjects. TAs facilitates the construction of knowledge among students and teachers, enabling the rapid development of collaborative intelligence. In the TD and DG subjects, technological applications provide an opportunity to construct three-dimensional geometric elements and their relationships in space without cost.
Technological applications suitable for the study of orthogonal projections and cylinder sections
In the field of education, the use of apps in the subjects of TD and DG facilitates the resolution of activities through the use of interactive simulations in the classroom, thereby encouraging collaborative learning among students. Computer simulations are activities whose objective is to obtain a digital model in the software interface that represents the shapes and movements of a given phenomenon in reality (Castilho et al. , 2020 ). Technical drawing, as a subject, encompasses the precise graphic representation of content that adheres to technical standards and scales. The spatial reconstruction of the shape of solids, sections and orthogonal views is possible through the use of standardized representation. Descriptive geometry is a subject that falls within the field of applied mathematics and focuses on the study of 3D spatial geometric shapes on planes according to their dimension and position.
The implementation of TA as a teaching tool can provide a range of alternatives for the teacher to deliver content more easily, as well as stimulating the student’s curiosity to learn. They offer a significant quality of teaching as students are stimulated to think critically and logically, putting them at the center of attention as opposed to traditional teaching where the teacher is at the center of attention. The teacher now has a different teaching dynamic, becoming a digital researcher and mentor.
The advantages of TAs are many: they are easy to manipulate; allow discovery and exploration of new information; allow construction of 3D elements; stimulate and encourage creativity in drawing; allow clear visualization, facilitating comparisons and analysis; allow computer simulation of TD and DG content and guarantee meaningful learning with quality.
Qubism 3D Modeling
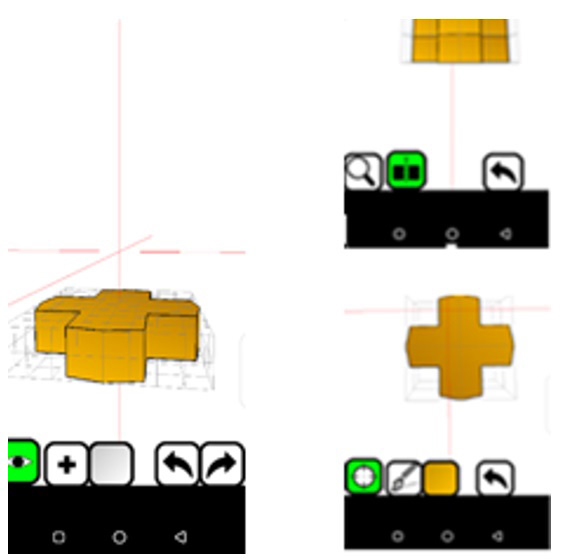
Q3DM version 0.9.6 is a free application created by Jonathon Quinn and updated on 02 February 2016. It allows for the simulation and building of simple 3D models using a touchscreen device. Its construction in digital blocks called Qubes allows you to model, edit, color, add, delete, move, stretch and rotate ( https://play.google.com/store/apps/details?id=jquinn.qubism.android&hl=en&gl=US ). It has been adapted for smartphones and can be combined with the content of Orthogonal Projections (OP) as it shows a 3D visualization of solids. It improves the understanding of complex abstract parts (behind, below) of solids and the perception of orthogonal views (OV). Q3DM includes several tools with specific tasks suitable for studying OPs (see Figure 1 ).
Source: Own elaboration.
Figure 1 . 3D representation of the solid and its orthogonal views (front and top) projected using Qubism 3D Modeling
Q3DM helps to quickly and interactively transform complex theory into simple practice by promoting students’ SV of the abstract parts of solids (Chivai et al. , 2022a ).
Orthogonal projections
The topic of OP is of interest within the field of TD, which concerns the representation of an object on a projection plane. A projection comprises a set of elements, represented on the corresponding planes through a procedure that allows the observer to view the same object from different positions. This enables a complete view of the object through the OVs. The topic of OP was first addressed by Gaspard Monge (1746-1818). Rabasa ( 2011 , p. 715) asserts that Monge “systematized the procedures, reducing tracing to two projections, enunciating the rules and establishing a vocabulary for abstract geometric elements, i.e. points, lines and planes.” The systematization referred to by Rabasa pertains to the procedures applied to two projections through straight lines perpendicular to the projection planes, which contain the abstract geometric elements that compose the shape. The projection of an object is based on the process of drawing straight lines from the observer to the vertices of the object, which then intersect a surface called the plane of projection. This representation process is defined as the method of projecting objects onto specific planes (Lopes, 1991 ). Lopes ( 1991 ) defines it as the graphic representation of any object or figure in the plane of projection. Projection entails the depiction of objects by their views or constituent parts. This entails the representation of what can be observed in an object from different positions, thereby facilitating a comprehensive view of the object. The construction of the object on a plane can be compared to the shadow of that same object at the time when the sun is at its highest point (12 o’clock). The lines start from the point of the observer, pass through the vertices of the solid to the surface of the projection plane to project the OV (see Figure 2 ).
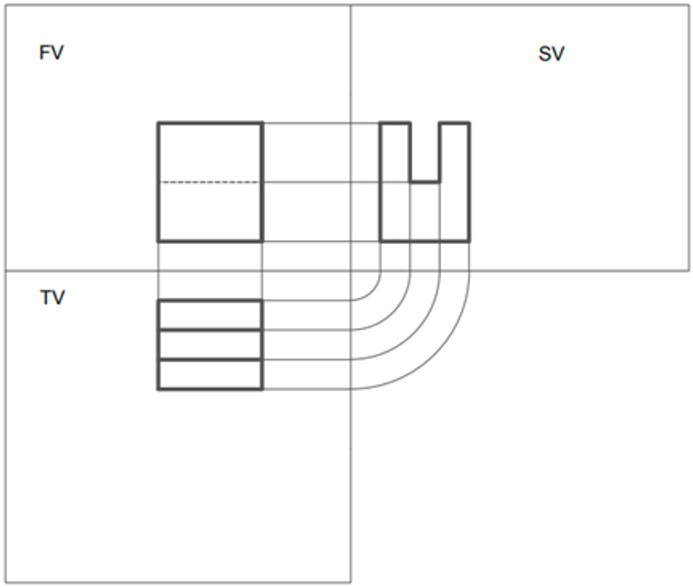
The solid of Figure 2 was projected in three orthogonal views (OVs), namely the top view (the observer point of view positioned above the solid), the side view (the observer positioned sideways) and the front view (the observer positions himself looking frontally at the solid). The aforementioned OVs can be projected orthographically using the Mongean method, which is represented in two projection planes, namely the horizontal plane and the vertical plane. The two planes are positioned perpendicular to each other, and the solids are projected onto them. In the vertical plane, the front view is represented, while in the horizontal plane, the top view is represented. These representations are collectively referred to as orthographic projection (see Figure 3 ).
Source: Own elaboration.
Figure 3 . Orthographic views (FV- front view, TV- top view and SV - side view)
In addition to the Q3DM, which employs the Qubes construction tool to facilitate the assembly of the desired solid shape, it also incorporates other tools that permit the sectioning, addition, and coloring of different colors and shades, as well as the movement and rotation of the model to align with the OVs. This enables the student to analyze the relationship between the 3D and 2D representations and, through rotation, to visualize the hidden parts. This facilitates the transfer of the represented solid from the 3D smartphone to the plane of the 3D drawing sheet.
GeoGebra dynamic geometry software
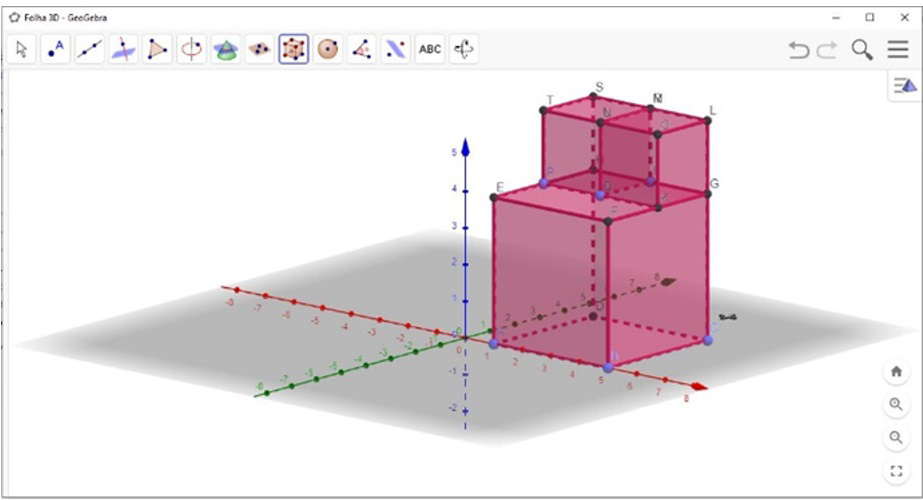
The GeoGebra dynamic geometry software version 5.0.721.0 is a free TA created in 2001 by Markus Hohenwarter to be used in the classroom environment. It utilizes minimal memory but yields satisfactory outcomes in the context of algebra and geometry-focused teaching and learning. As it is an app with accessible language, it is recommended for all levels of education (Silva; Victer, 2017 , p. 205). The GeoGebra app can be utilized in both standalone mode and online via the mobile internet ( www.geogebra.org ) (Kramarenko et al ., 2020 , p. 706). The application enables the 3D visualization of all fundamental elements of DG. In the context of the study of cylinder sections (CSs), the application enables the user to manipulate the construction of the geometric solid and the figure derived from the secant plane on the smartphone screen. The application enables students to observe the dynamics of changes in the figure resulting from the position of the sectional plane in all the OVs and the relationships between the geometric elements in space. GeoGebra contains several tools that enable the construction of all the elements of the DG. The user can construct the geometric elements in a logical and sequential manner, progressing from the simplest to the most complex (from point to line). GeoGebra facilitates the reinforcement of learning by enabling the construction of geometric elements in order to spatially realize the dynamics of modelling the geometric elements. Please refer to Figure 4 for further details.
Source: Own elaboration.
Figure 4 . Solid projected onto the GeoGebra dynamic geometry software interface
Oliveira and Stormowski ( 2021 , p. 582, our translation) argue that “We emphasize that our findings indicate that GeoGebra has contributed to the development of spatial visualization skills. The aforementioned conclusion was reached as a result of the analyses conducted in front of the students’ production.” This positioning indicates that GeoGebra may be an appropriate educational resource for the study of CS.
Solid sections
CS is one of the DG subjects that aim to understand the shape of the figure resulting from the section in the cylinder and every detail of the elements that make up the section from the section plane. Sections are included in the DG subject (Anamova et al ., 2020 , p. 1186). The goal is to gain a comprehensive understanding of the external composition of the figure resulting from the section. This sectioning depends on the position of the secant plane, and this depends on two different scenarios: firstly, when the secant plane is parallel to the axis of the surface, and secondly, when the secant plane is not parallel to the axis of the surface. The need for sectioning arises when the external configuration of the section prevents the internal structure of the cylinder from being perceived. Sectioning makes it possible to see in detail the cut made by the secant plane on the hidden edges.
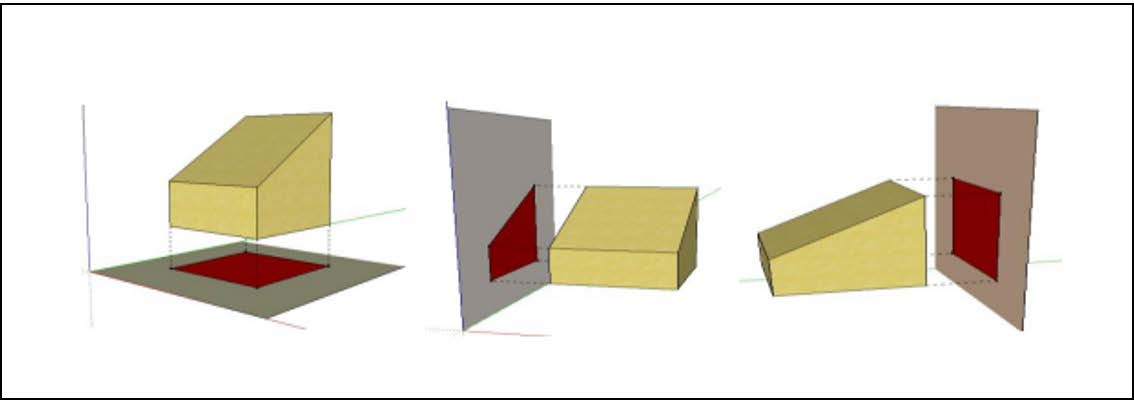
Figure 5 illustrates the consequences of the position of the cutting plane for four cases: the first is a circle, resulting from the cut made by a plane parallel to the bases; the second is an ellipse, resulting from a plane oblique to the bases; the third is a quadrilateral, caused by a plane parallel to the generatrices; and the last, shown on the left, is a variant of the second, in which the secant plane cuts one of the bases, resulting in a section formed by an elliptical arc and a line segment. In addition, it is possible for the plane to catch both bases, resulting in a section formed by two-line segments and two elliptical arcs (Chivai et al ., 2022b ), as illustrated in Figure 5 .
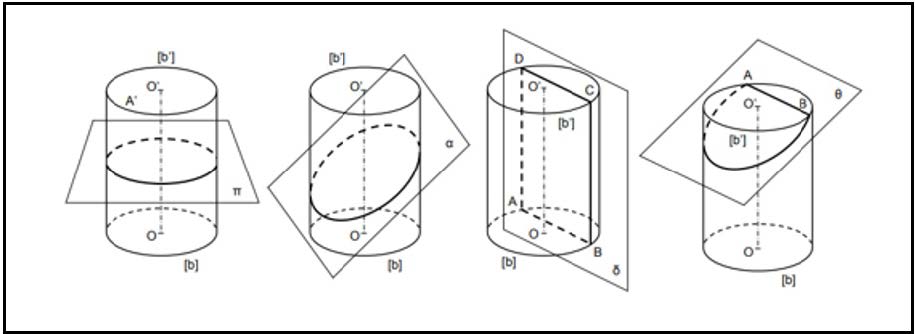
In the initial representation of Figure 5 , we present the section of the cylinder by a level plane, resulting in a circle. The second representation depicts the section of the cylinder by a top plane, which originated an ellipse. The third representation portrays the section of the cylinder by a profile plane, which created a rectangle. Finally, the fourth representation illustrates the section of a cylinder by an oblique plane, which originated a parabola. In all cases, the cylinder section figure generated was a consequence of the position of the secant plane.
Spatial visualization
Spatial visualization requires an abstract reasoning in concordance with the relation of objects according to their shape, position, size, location, and direction in space. Prieto and Velasco (2002, p. 12, our translation) posit that “visualization ability is, along with those of spatial relations and spatial orientation, one of the most representative factors and it is defined as the ability to mentally manipulate complex three-dimensional figures”. The human capacity to recognize graphic representations is referred to as spatial ability or SV ability (Suzuki, 2002 , p. 224). The authors’ positions can be unified by defining SV as the ability to spatially visualize all details of an object, including its color, shape, and position. It can also be considered as the ability to mentally manipulate objects in space to visualize SVs. The spatial ability of students allows for a more comprehensive understanding of TD and DG content through the visualization of objects prior to the resolution of 2D problems on the drawing sheet. The spatial ability that the student is intended to have, is a result of mental exercise. Even if the student does not possess SV ability, with training from progressive and systematized exercises, they can acquire SV ability. The subjects of TD and DG are predicated on the development of visual ability in the student, with the objective of enabling them to solve problems.
Therefore, the student needs this ability to mentally perceive the shapes and relationships of geometric elements spatially. The capacity to visualize objects in space from the representations on the drawing sheet plane, necessitates a mental exercise of rotating the solids in the projection planes, this therefore requires three skills: the ability to mentally rotate the solids in the projection plane; the ability to visualize every detail of the solid’s shape; and the ability to perceive the relationship of the elements that will interact with the solid. These skills contribute to the development of spatial cognition. Given the difficulty that secondary school students experience with SV, it can be assumed that this is due to the absence of the ability to mentally manipulate the objects in order to perceive the OVs and spatial relationships. Baranová and Katrenicová ( 2018 , p. 22), posit that “in our conceptualization, spatial ability is the capacity to solve visually assigned problems in the mind.” It is widely acknowledged that spatial visualization skills and mental rotation abilities are of critical importance for technical and engineering professions. Therefore, this skill in SV is the foundation for comprehending the abstract domains of TD and DG.
Spatial visualization tests
These are traditional psychometric spatial ability tests that involve general domain stimuli and are related to engineering tasks (Cohen; Bairaktarova, 2018 ). The objective of these tests is to assess the ability to record in the mind the visual shapes of solids in all projections. The process assesses the student’s reasoning in mentally memorizing the shape of objects according to their color and position. For Ma’rifatin et al. ( 2019 , p. 1), the test enables the subject to “compile and decipher the form to create a new shape”. Tests of this kind are also employed for the purpose of job aptitude. In accordance with Piaget’ ( 2004 ) theory of psychology, elementary school students are at the formal operations stage, which allows them to think abstractly. It is challenging for teachers to identify their students’ SV abilities and skills. One approach is to administer a test to assess students’ SV levels. Tests typically include optional questions. Each question presents a picture that prompts students to think logically. Students must mentally manipulate the solid according to color, shape, direction in space, and position to select the correct answer. Cognitive psychology presents SV tests in numerical format for ease of identification. In these tests, students are required to discern the logical meaning of several solutions, each of which illustrates deductive reasoning, employing the terminology provided in the problems (Vygotsk et al ., 1988 ).
In this study, two SV tests were applied; the first is the Cube Test (CT) because it fits in the study of OP, allowing the assessment of spatial reasoning in solving geometric problems that pose challenges for the construction of the unfolded cube as a whole. The second is the Santa Barbara Solids Test (SBST) because it fits the study of CSs, assessing the level of perception of the shape of the figure originated by the cutting plane in the cylinder.
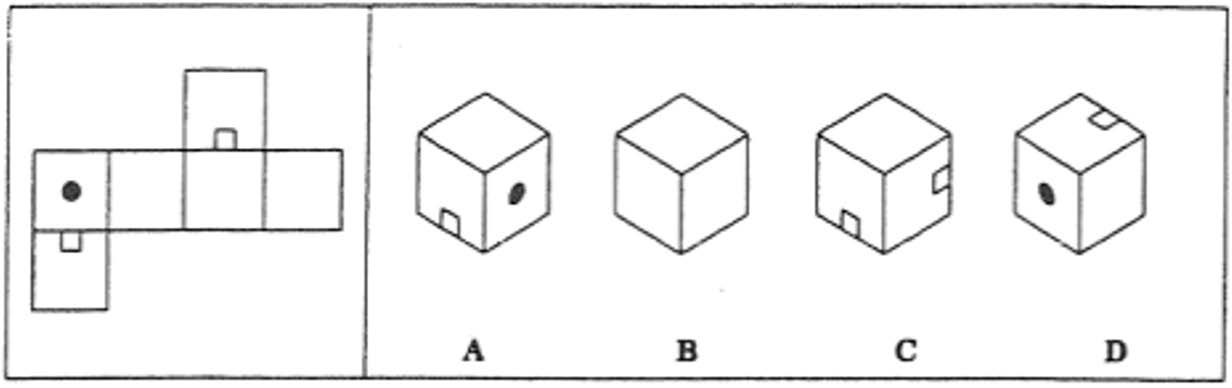
The CT is applied to the SV skill with the objective of measuring the ability to mentally manipulate complex 3D figures. Complexity begins with the perception of unfolding the cube in 2D so that the same cube can be assembled in 3D. This process imposes the representation of mentally rotating the solids quickly and accurately in various positions and is accompanied by optional questions. For the study, the CT contains three folded cubes in which each cube has five options (A, B, C, D) of which the correct answer logically takes the form of the pattern assembled in 3D as used in Triutami ( 2021 ) and Dere and Kalelioglu ( 2020 ) studies (see Figure 6 ).
The SBST was created by Cohen and Hegarty in 2007 and further developed by Uygan in 2011. The test is comprised of 30 questions designed to measure visualization ability. Each question contained four possible answers with 3D figures (Dere; Kalelioglu, 2020 ). The SBST serves to measure the level of ability to perceive the shape of the figure, of the true magnitude of the part sectioned in the solid by the secant plane. Dere and Kalelioglu ( 2020 , p. 1) further state that “the Spatial Visualization Test, the Mental Rotation Test and the SBST, which simultaneously measure spatial orientation and spatial relations, have been used as tools to measure the different components of spatial ability”. The figure of the sectioned part is contingent upon the type of sectioning plane and its position within the solid. The SBST enables the measurement of the student’s level of perception for each position of the secant plane within the solid. The SBST necessitates the acquisition of three skills: the capacity to mentally visualize the solid, the ability to develop reasoning on the position of the secant plane, and the capacity to describe the figure of the shape of the cut produced by the secant plane in the solid. The SV test measures the ability to relate the interacting elements in the solid to the resulting product of the section. Cohen and Bairaktarova ( 2018 , p. 2) point out that they tested “the utility of a relatively new spatial visualization test (Santa Barbara Solids Test) to identify the challenges and problem-solving strategies of low spatial FYE students”.
The SBST encompasses several processes, including the encoding of a three-dimensional stimulus and the visuospatial construction derived from the rotation of a three-dimensional image sectioned by a plane. For the research, the SBST was composed of four cylinders sectioned by different planes. In the studies of Cohen and Bairaktarova, ( 2018 ) and Dere and Kalelioglu ( 2020 ), the test was applied with the goal of determining which figure was created by the sectioning of the secant plane.
Methodology
The research presents a quasi-experimental interpretive case study, inductively developing conceptual categories to examine the initial assumptions, intentions, and meanings of students’ actions and expressions (Amado, 2017 ). The interpretive understanding is sustained by the detailed account of student interaction in the classroom (Coulon, 1995 ). The interpretive view is characterized by the rigor of the natural sciences and the concern of the social sciences, which is to describe and explain human behavior, emphasizing how people interact with both natural and inanimate phenomena (Cohen et al. , 2017 ). This approach allows for the description and interpretation of student actions in a classroom environment, as well as the meanings of these actions within the context of the entire research process (Coutinho, 2011 ). The approach was mixed because it recognizes that the world is not exclusively quantitative or qualitative, but is a mixed world, even though the researcher may find that the research has a predominant disposition toward numbers or qualitative data (Cohen et al ., 2011 ). The proposal presented here is of a mixed nature, resulting from the qualitative and quantitative. The mixed methodological approach aims to explore a qualitative and quantitative in data interpretation. Both quantitative and qualitative methods are important for interpretations in Education (Ponce; Maldonado, 2015 ).
The technique employed was that of participant observation, note-taking and photographic recording. The instruments employed were SV tests, specifically the CT for the subject of grade 9 OPs and the SBST in the study of CSs in grade 12. The process of data collection was meticulously detailed using a multitude of data collection procedures, which were then applied to secondary school students. For the Q3DM study, the data were derived from the research of Chivai et al. ( 2022a ), while for the GeoGebra study, the data utilized were derived from the study of Chivai et al. ( 2022b ). The research was conducted in a classroom setting, with the teacher randomly selecting the groups (control and experimental) for the study. The comparison between the treatments of students was done in non-equivalent groups in terms of OP and CS content skills.
A simple random sampling was used for the research in a GSE school in southern Mozambique. The sample consisted of 100 students, distributed across groups. In both the Q3DM study and the GeoGebra study, 25 students were allocated to the control group and 25 students to the experimental group, respectively. Please refer to Table 1 for further details.
Table 1 . Distribution of the sample by intervention, Cycle, Class and gender
| Intervention | Cycle | Class | Boys | Girls | Total |
| Q3DM | 1.º | 9ª | 27 | 23 | 50 |
| GeoGebra | 2.º | 12ª | 32 | 18 | 50 |
| Total | 59 | 41 | 100 |
Source: Chivai et al. ( 2022a ) and Chivai et al. ( 2022b ).
To address the research question and objectives of the study, two classroom interventions were implemented. For the Q3DM study, the data were sourced from the study by Chivai et al . ( 2022a ), while for the GeoGebra dynamic geometry software study; the data were sourced from the study by Chivai et al. ( 2022b ).
About the OP topic, the Q3DM application was deemed appropriate because it permits SV of the views of the solids and the CT. This is because it enables the measurement of the SV level of the assembly of three unfolded cubes of varying difficulty levels (low, medium, and complex).
To study CSs in grade 12 students, the GeoGebra software was employed, as it allows for the visualization and construction of the cylinder and its section. SBST was suitable because it allows evaluating the ability to visualize the figures resulting from the CS. The evaluation also consisted of three levels: low, medium and complex.
Sequence of application of the research instruments
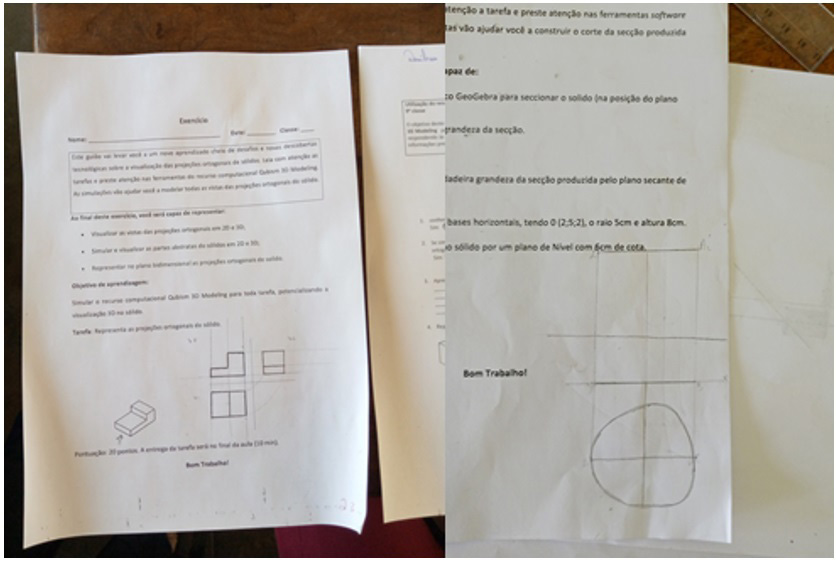
In both studies (Q3DM and GeoGebra), the instruments were applied in the following sequence: in the initial phase of the study, all students and groups were administered the same pre-test to assess their baseline knowledge of orthogonal views for the study of POs and the subject of CS to represent the section caused in the solid by a Level plane with a 7.5cm dimension (please refer to Figure 7 for further details).
Subsequently, the students were provided with a lecture in separate groups. The control groups were instructed in the traditional model, without the use of any technology. In contrast, the experimental groups were permitted to simulate the exercises with the aid of the TA, which had been adapted for use on smartphones.
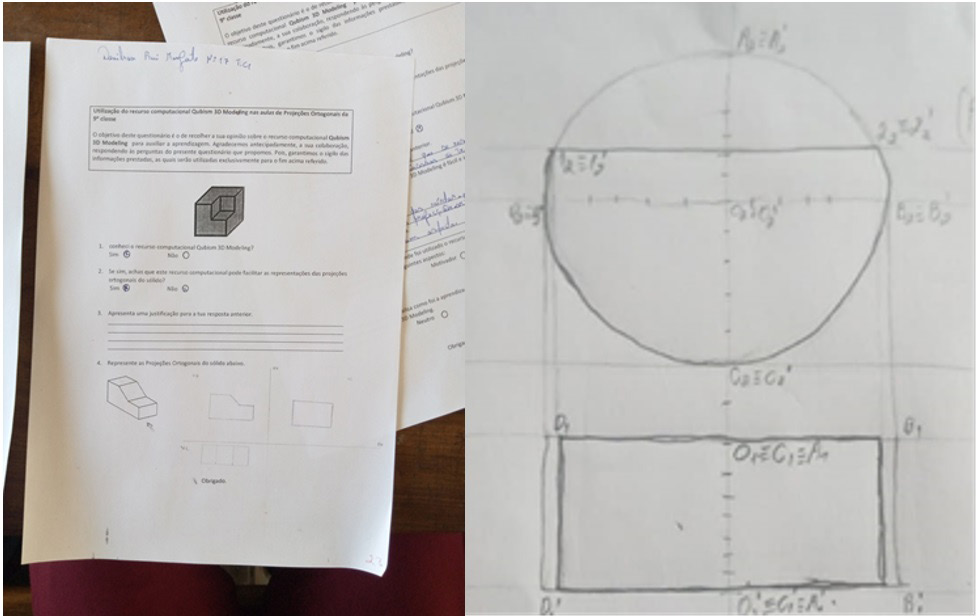
Subsequently, following the mediation of the groups separately, the post-test was conducted. The exercises were identical for all groups, according to class, with the objective of enabling a comparison with the pre-test exercises. The exercise on Orthogonal Projections consisted of representing the Orthogonal Projections views of the solid in Figure 8 . The activity on conic sections involved the representation of a cylinder with horizontal bases, coordinates (0, 2, 5, 2), radius 5 cm and height 8 cm. This is illustrated in Figure 8 .
Source: Own elaboration.
Figure 8 . Post-test of the orthogonal projections and cylinder sections study
Subsequently, following the conclusion of the post-test, all groups underwent assessment of their VS level via the Cube Test and the Santa Barbara Solids Test. The objective, as previously stated, was to ascertain whether the TAs had developed SV skills. Please refer to figures 8, 9, 10, 11, 12 and 13 for further details.
The Q3DM application represents a pioneering research study in the field of OPs, while the GeoGebra app has already been validated by several authors as a tool capable of promoting 3D SV skills. This is evidenced by the studies of Jesus et al. ( 2019 ), Silva and Victer (2019), Klemer and Rapoport ( 2020 ) and Kramarenko et al . ( 2020 ). It is important to note that the two apps used in this study were specifically adapted for use on smartphones. This makes the research particularly noteworthy, as in Mozambique, the use of smartphones and TAs in the classroom is not yet permitted in GSE.
Qualitative analysis of the groups’ interventions
In both groups, students initially encountered difficulties in comprehending the content of OPs. However, after the teacher presented the topic of OPs of different solids, they demonstrated notable gains in learning the topic. As the groups were separated, the control group received the traditional model of intervention, which did not utilize technology. In contrast, the experimental group was able to apply the Q3DM, which had been adapted for use on smartphones, in practical activities. The students in the control group exhibited a lower level of motivation, which had a detrimental effect on their SV test results. The students in the experimental group demonstrated a greater ease in handling the Q3DM tools, which facilitated the development of SV of three-dimensional solids and the perception of OV, in comparison to the control group. Consequently, the students in the experimental group exhibited a more positive behavioral response than those in the control group. In both groups, the students demonstrated that the exercises were highly complex and required logical reasoning, involving an SV rotation of the cubes to solve the problem (Chivai et al ., 2022a , p. 434).
The CSs and GeoGebra software were introduced at the outset of the class, and initially, the students demonstrated difficulty in grasping the theoretical aspects. The groups were also divided, with the control group receiving instruction in a traditional manner, while the experimental group benefited from the use of GeoGebra. In both groups, at the outset of the research, the students exhibited a fear of learning. However, in the experimental group, there was a noticeable shift in behavior following the introduction of GeoGebra. The students demonstrated a swift connection with the tools, as well as a motivation to simulate the cylinder sections on their smartphones. In contrast, the control group’s lesson lacked motivation and interaction, which negatively impacted the SV test results. This positioning was observed in the practical activities that took place in the classroom (Chivai et al ., 2022a , p. 15). The observed difference in behavior between the groups suggests that software with 3D models contributes significantly to students’ SV, as was also found in Dere and Kalelioglu’s ( 2020 , p. 417) study.
Comparison between boys and girls
A comparison of the percentage of boys and girls in the experimental group of the Q3DM (Chivai et al.,2022a , p. 435) and GeoGebra (Chivai et al ., 2022b , p. 11) studies revealed that the average level of SV could be measured. This assessment was conducted by applying the SV test scores to both studies. The students demonstrated higher scores on the low and medium level responses, as evidenced by the data presented in Table 2 and Table 3 .
Table 2 - A comparison is presented in percentage form between boys and girls in the experimental group in relation to the levels of difficulty encountered in the Cube Test
| Levels of difficulty of the Cube Test | Boys | Girls | ||
| Correct answers % | Wrong answers % | Correct answers % | Wrong answers % | |
| Low | 100.0 | 0.0 | 94.0 | 6.0 |
| Medium | 87.5 | 12.5 | 74.5 | 25.5 |
| High | 37.5 | 62.5 | 42.0 | 58.0 |
Source: Chivai et al. ( 2022a ).
Table 2 presents the approximate scores for both genders in a balanced manner. In the low level, the male students had 100% of correct answers, while the female students achieved a 94% of correct answers. At the medium level, the boys demonstrated 87.5% correct responses, while the girls achieved 74.5% of those responses. Finally, for the high level, the proportion of correct answers obtained by boys was 37.5%, while that obtained by girls was 42%.
Table 3 . A Comparison is presented in percentages form between boys and girls in the experimental group regarding the levels of difficulty presented in the Santa Barbara Solids Test
| SBST Difficulty Levels | Boys | Girls | ||
| Correct answers % | Wrong answers % | Correct answers % | Wrong answers % | |
| Low | 73.3 | 26.7 | 50.0 | 50.0 |
| Medium | 60.0 | 40.0 | 70.0 | 30.0 |
| High | 53.3 | 46.7 | 10.0 | 90.0 |
Source: Chivai et al. ( 2022b ).
Table 3 also presents the scores like those presented in the previous table, but at the medium level. In comparison to girls, boys demonstrated superior performance at both the low and high levels. At the low level, boys demonstrated 73.3% accuracy, while girls achieved 50% accuracy. At the medium level, boys achieved 60% correct answers, while girls achieved 70% of those answers. Finally, for the high level, boys achieved 53.3% correct answers, while girls achieved only 10% of those answers.
It is notable that in both groups, boys exhibited superior performance compared to girls. This discrepancy in scores is also evident in the study conducted by Fiantika et al. ( 2018 ), which suggests that girls are more proficient at visualizing in 2D, while boys are more adept at visualizing in 2D and 3D. Furthermore, Fonseca et al. ( 2022 ) highlight significant differences in learning between boys and girls. The authors posit that boys demonstrate superior performance in learning contexts through problem-solving game challenges, whereas girls exhibit this advantage only in relation to the study habits factor (Fonseca et al. , 2022 ). These gender differences in VE skills can be observed as early as childhood (Silva et al ., 2022 ). Similarly, Szabó et al . ( 2023 ) observed slightly higher average scores for boys in both the pre- and post-test.
Comparison between the control and experimental groups regarding the Qubism 3D Modeling and GeoGebra dynamic geometry software studies
A comparison was made between the control and experimental groups in relation to the Q3DM (Chivai et al ., 2022a , p. 434) and GeoGebra studies ( Tables 4 and 5 ). The experimental group demonstrated superior performance compared to those in the control groups. The students in both groups were evaluated for average levels. Please refer to Tables 4 and 5 for further details.
Table 4 . A comparison is presented in percentage form between control group and experimental group regarding the levels of difficulty encountered in the Cube Test
| Levels of difficulty of the Cube Test | Control Group | Experimental Group | ||
| Correct answers % | Wrong answers % | Correct answers % | Wrong answers % | |
| Low | 55.5 | 44.5 | 92 | 8 |
| Medium | 21 | 79 | 87 | 13 |
| High | 21 | 79 | 29 | 71 |
Source: Chivai et al. ( 2022a ).
Table 4 demonstrates that the experimental group achieved higher scores. In the low level, the control group achieved a correct answer rate of 55.5%, while the experimental group achieved a rate of 92%. For the medium level, the control group demonstrated 21% correct responses, while the experimental group exhibited 87%. At the high level, the control group achieved 21% correct answers, while the experimental group obtained 29%.
Table 5 . A comparison is presented in percentage form between the control group and the experimental group regarding the levels of difficulty encountered in the Santa Barbara Solids Test
| SBST Difficulty Levels | Control Group | Experimental Group | ||
| Correct answers % | Wrong answers % | Correct answers % | Wrong answers | |
| Low | 64.0 | 36.0 | 76.0 | 24.0 |
| Medium | 60.0 | 40.0 | 64.0 | 36.0 |
| High | 36.0 | 64.0 | 48.0 | 52.0 |
Source: Chivai et al. ( 2022b ).
Table 5 presents the approximate scores, with the experimental group exhibiting the highest scores. Regarding the low level, the control group demonstrated a 64% accuracy rate, in comparison to the 76% accuracy rate exhibited by the experimental group. For the medium level, the control group achieved 60% of correct answers, while the experimental group attained 64%. For the high level, the control group obtained 36% of correct answers, while the experimental group achieved 48%.
These results can be attributed to the fact that the experimental groups benefited from the assistance of Q3DM and GeoGebra in their practical activities. Baranová and Katrenícová ( 2018 ) also confirm the significant positive effect of DG on students’ spatial skills using software (Baranová; Katrenícová, 2018 ). In their research, Lavicza et al. ( 2023 ) found that providing specific interventions, such as guidance on equations and GeoGebra commands, helps students overcome challenges.
Overall, the SV tests demonstrated superior performance at the low and medium levels in both studies (Q3DM and GeoGebra), indicating that students were assessed at the medium level, in accordance with the findings of previous studies by Chivai et al. ( 2022a ) and Chivai et al. ( 2022b ), which substantiate that the computer simulations of the apps selected for the smartphone research promote SV in the topics of OPs and CSs. In their study, Prieto and Velasco ( 2006 , p. 18) also concluded that the Visualization test is a more efficient and specific predictor of achievement in TD than the Inductive Reasoning test. The Inductive Reasoning requires students to examine the similarities and differences of specific stimuli to extract general characteristics, properties, and rules.
Conclusion
Technologies play a foundational role in the three-dimensional visualization of geometric solids. They facilitate the exploration of the three-dimensional environment in a variety of TD and DG topics by providing simulations of virtual experiences in a timely and cost-effective manner. In recent years, these technologies have developed at a rapid pace, resulting in a wide range of 3D modelling equipment and software. A significant number of researchers have advocated for the necessity of reforming curriculum and teaching methods to ensure adequate incorporation of these technological innovations (Omar et al ., 2019 ). Considering the research question, namely whether the Qubism 3D Modelling software and the GeoGebra dynamic geometry software, adapted to the smartphone, enhance spatial visualization in the study of orthogonal projections and sections of cylinders, the results indicate that they do. This is evidenced by the fact that they obtained a superior performance in solving questions of low and medium difficulty. The CT and the SBST enabled the assessment of each student’s SV level through the administration of medium-level practice tasks. A comparison of the scores obtained by boys and girls in the two studies revealed that boys achieved better results in all levels of the administered tests, suggesting that they may possess superior visualization skills. The tests demonstrated that the experimental groups exhibited superior performance on problems requiring more complex cognitive skills than the control groups. The study suggests that the SV tests used in this study could be applied to other content taught in the subjects of DT and DG.
During the research, there were limitations in finding Mozambican literature that dealt with 3D technology in the teaching and learning of Orthogonal Projection and Cylinder Section. Furthermore, there was a lack of universal literature that presented research on the content of Cylinder Section in the study of Descriptive Geometry.

