


 Inglês (pdf)
 Artigo em XML
 Enviar este artigo por email
 Permalink
INTRODUCTION
Compulsory education policies have undergone significant changes in many countries. In England, at least two key topics have been active since the 1980s. The first relates to trends in the country’s spending system that, according to government authorities, aim to equalise per-pupil spending disparities between primary and secondary schools across the nation. These trends have led to several funding system changes since the 2000s, including the development of the National Funding Formula (NFF) in 2016 and its implementation in 2018. The second ongoing issue is the transfer of compulsory educational provision from public to private and third-party providers. A policy central to this transfer has been the academisation of schools, which has been discussed and addressed by several governments’ educational agendas since the 1980s. Academisation in England involves political, economic, and philosophical intentions to shift the management and provision of education from Local Authorities (LA) and Local Education Authorities (LEA) to private non-profit stakeholders. This article describes how the current state of England’s education funding reflects these two movements.
Brief historical overview
One of the main characteristics of England’s education funding is that no fixed legislation earmarks public funds or establishes a consolidated education budget. Instead, the incumbent government decides the total education budget based on its plans for the sector and historical and notional factors (PERERA; ANDREWS, 2020). This sets England apart from other countries that dedicate a share of public revenue to education. In Brazil, for example, the Federal Constitution mandates a minimum percentage of public revenue be spent on education and specific educational areas. As Pinto (2018) suggests, the main problem with not earmarking revenues to social sectors is the difficulty of ensuring sufficient resources for public services when they are most needed. As explained below, especially in the early 2000s and after 2010, the revenue allocated to education decreased sharply in England, and as of the time of writing, it still falls short of the expenditure levels observed during that period.
Historically, once the government determined the overall budget, including expenditure in various education activities (e.g., schools, higher education, student support, administration costs), it specified its allocations through the education funding system based on specific rules and notional blocks1. In the 2000s, however, this system began to face challenges as an overall reduction in funding allocation to LAs2 created pressure on the school budget nationwide and increased inequalities in school funding among different regions (PERERA et al., 2017).
The first change to this historical system occurred in 2003, when a minimum annual increase in school funding per pupil was introduced (PERERA; ANDREWS, 2020). In 2006, the DfE implemented the Dedicated School Grant (DSG), which proved to be a significant earmarked allocation for compulsory schools since it served as the primary source for teacher and staff salaries, teaching materials, and various school equipment for all schools (SIBIETA et al., 2008). One year later, the DfE announced that no local authority would receive less per-pupil funding than its existing expenditure level plus an annual increase based on the number of pupils in the schools (PERERA et al., 2017).
To support these new regulations, the government increased the total education funding during the second and third New Labour terms in Parliament3. According to Sibieta et al. (2008, p. 8), the average annual growth in education spending was 6.1% between 2001 and 2005 and approximately 3.8% between 2005 and 2009. These increases had a notable impact on school grants. In comparison, the long-term trend prior to the New Labour terms (1953-1997) saw a cumulative growth of 4% in the educational budget, while the educational budget only grew by 1.4% during the conservative government from 1979 to 1997.
Subsequent changes in the school funding system were implemented by the new coalition government in 2010, led by the Conservatives, but with a different focus. The new government asserted that the total expenditure was not the problem but the administration and distribution of funds. Thus, the newly formed government focused its criticism on the grants historically provided to LEAs, claiming that they distorted allocation decisions since attachment areas changed over time. Complicating the problem further, LEAs distributed funding to individual state schools based on a separate, and sometimes conflicting, locally determined formula (BELFIELD; SIBIETA, 2016).
The common argument to demonstrate the “administration problem” was the widening disparity in education funding. For instance, in 2011-12, the disparity between the highest and lowest local funding was £3,623 per pupil (PERERA; ANDREWS, 2020), while the average expenditure was £5,270. At the same time, the DfE argued that the problem lay in schools with similar characteristics receiving different budgets. Based on the above arguments and 2009 financial crisis backdrop, the government was announcing constraints on educational expenditure in the 2010s, a period marked by budget cuts in social sectors and austerity discourse (BLYTH, 2013).
To rearrange the education budget, two initiatives were implemented. Firstly, multiple individual grants for deprived areas (e.g., those with high proportions of Black and minority ethnic pupils and pupils with English as an additional language) were consolidated into a single School Standards Grant (SSG). Secondly, a funding formula was developed to include pupil-led, school-led, and historical and notional factors. The idea was to build a funding strategy considering the needs of each school while also having national applicability, thereby replacing the LEA-specific formulae.
The implementation of the national funding formula (NFF) faced significant challenges, leading to delays in its adoption. The main issue was the “short blanket” problem in education financing (ARELARO, 2004). Given the cuts in public investment in education, for some LEAs to receive adequate funds based on pupil and school factors, others would have to face reduced investment in their schools. This created political tension, as the NFF was perceived as creating new ‘winners’ and ‘losers’ among LEAs (BELFIELD; SIBIETA, 2016). It was not until the financial year 2018-19 that the NFF began to guide the allocation of education resources. Coincidentally (or not), this was a year after public education investments started to grow again.
However, the shift in funding systems from a notional to a general model was not the only trend in England’s educational system. The country also experienced a radical education reform, including programmes to transfer education provision to non-profit private actors through academy schools. As this paper will demonstrate, academy schools now account for 37.4% of all primary schools and 71.8% of secondary schools in the compulsory education stage.
According to West (2014), although the formal programme to convert state schools (community schools) into academy schools began in the 2000s, conservative governments started seeding this idea in 1979. During these conservative administrations, neoliberal ideas influenced many areas of public service management, including educational policy. The neoliberal ethos puts a strong emphasis on market competition and criticises public services for having one dominant provider (FRIEDMAN, 1966; 1977)4.
In a challenging political landscape for the opposition, where left-wing ideas and parties were struggling with the liberalisation of the global economy and political violence against them (HARVEY, 2005), the government implemented two reforms: the Education Act and the Reform Education Bill of 1988. The general idea behind these reforms was to ensure greater “diversity, parental choice, school autonomy, and greater accountability” (WEST, 2014). The policies were designed to “allow” parents to choose schools for their children and foster competition among schools. In line with Friedman’s view, the government had the ideological belief that introducing quasi-market mechanisms in the educational system would enhance “quality” (LE GRAND; BARTLETT, 1993).
That political-ideological mindset persisted into the 1990s and 2000s, with governments proposing some school models to privatise the provision of public education. The first school model adopted in the country was city technology colleges (CTCs), private institutions led by non-profit entities but funded by the central government, ultimately outside of local authorities’ control and financing (WALFORD, 2000). However, the most critical policy came under the “new” Labour government formed in 1997 with the introduction of the academy school model5, designed to be managed by non-profit bodies and sponsored by businesses or individuals with support from the central government (WEST, 2009). However, in 2009, the government removed the requirement for private sponsorship, making academy schools privately managed and publicly funded.
The privatisation of educational provision continued in the early 2010s under the conservative government6. In 2010, the Academies Act set the government’s intention to convert all state schools into academies. The most crucial aspect of the Act was the permission for state schools to convert into academies either voluntarily (if they met certain academic standards) or by force if they did not (EYLES; MACHIN, 2019). The Act also allowed the creation of a new school model, Free Schools, which could be set up by a group (e.g., religious, charities, teachers, private schools) upon evidence of parental demand.
In summary, the type of educational privatisation initiated in the 1980s and continued over the next two decades aligns with what Adrião (2018) called “parental choice policies”. Although they can take many forms, the primary format of these policies in England relates to the charter school model, where “privately managed schools operate under contracts and are publicly funded” (ADRIÃO, 2018, p. 11). To this end, however, the legal framework of education funding needed to change, i.e., LEAs needed to be removed from the administration of educational provision (DfES, 2005). Accordingly, the budget ceased to be allocated solely to LEAs, with “autonomous” academy schools being funded directly by the central government. Thus, these schools gained authority to make critical decisions on strategic issues, such as staff hiring, pay, performance goals, curriculum, and school day length, outside the control of democratically elected local governments (WEST, 2009).
In this context, significant problems remain unaddressed. As their proponents assert, the credibility of parental choice policies relies on the population having accurate information and hard evidence regarding each academy school, which has not been the case. Despite the growing body of academic work comparing school types and analysing educational outcomes in different types of schools, there is limited information and transparency primarily designed and made available to the general society regarding academy schools management, practices, and educational outcomes (WEST; WOLFE, 2019; BERTONI; GIBBONS; SILVA, 2020). Also, teachers’ unions (National Education Union) have intensively argued that the evidence cited in the recent government’s supporting documents for the schools’ academisation are ‘extremely weak’ and ‘highly misleading’ (WEALE, 2022).
In short, we observed that the public-school funding system needed to change to facilitate the establishment of autonomous schools and a quasi-market logic. One of the key transformations in this regard was the direct allocation and distribution of grants to academy schools. Therefore, despite the complexity of these two trends in England’s educational system, they can be interconnected through the crucial concept of granting funding autonomy to academy trusts while bypassing the role of LEAs. Given the importance of this issue, this paper will explore the current state of education financing in the country and describe the impact of these two trends using available data on enrolment, school types, education funding, and allocation of funds by school type.
METHODOLOGY
This paper focuses specifically on compulsory education funding in England, rather than the broader context of the United Kingdom. When conducting research on education economics and policy in the United Kingdom, particularly for an international audience, it is important to distinguish the semi-autonomous nations such as Wales, Scotland, Northern Ireland, and other Crown dependencies from the central power of the United Kingdom. These nations have the authority, depending on their level of political autonomy, to determine the allocation of education funding. Since the primary focus of this paper is on England, the data collection solely reflects the funding situation in England.
In terms of methodology, this article relied on a descriptive analysis of the data. This approach is suitable for initial exploration and understanding of a phenomenon, observing general trends (DENSCOMBE, 2009). The research began with a review of available literature and a comprehensive analysis of official documents and datasets from the Department for Education (DfE) to discuss trends in education funding. Economic data is compiled from Her Majesty’s Treasury Office (HMT Office), Public Expenditure Statistical Analyses (PESA) reports, and the GDP Deflator released by the HTM to calculate inflation-adjusted funding figures. Education data is based on publications from the DfE, which are publicly accessible online. Two main documents are essential to this study. The first is the ‘School Census’ (DfE, 2022), which explores the number of schools and students in England, along with their respective characteristics. The second document is the School Funding Statistics (DfE, 2023a) and the dataset “Financial year 2022 to 2023 Revenue Funding for Schools and Academies at provider level” (DfE, 2023b). It is worth noting that the second source contains funding allocation data for each compulsory-aged pupil (5-16) attending school in England and breaks down the funds by NFF factor, plus temporary allocations (such as COVID-19-related funding).
Finally, the core funding articles presented in the data show the overall funding received by schools in 2022-23, which may vary from the actual amounts applied in each LEA. This is because the NFF still calculates notional school allocations only. As explained by Roberts (2022, p. 22), allocations are provided to local authorities, who set their local funding formulae and distribute the funds locally, including any potential self-generated income. Currently, England employs a “soft NFF”, with the DfE intending to shift towards a direct NFF model for schools by 2027-28 (DfE, 2022a).
The compulsory educational school system in England: enrolment and schools
The current format and enrolment data
Since 1870, education in England has been compulsory for children from the age of five, and the school-leaving age has been raised over time. Historically, compulsory education covered ages 5 to 16. However, under the Education and Skills Act of 2008, post-secondary became part of compulsory schooling, making education or training compulsory until the age of 18.
The typical pathway through compulsory education in England begins with primary school, specifically Key Stage (KS) 1 and KS2. KS1 (Years 1 to 2) covers children aged 5 to 7, and KS2 (Years 3 to 6) includes children aged 7 to 11. At this point in the pupil pathway, other state-funded schools exist, such as lower and middle schools, but these are rare, with only 23 schools in the UK in 2021/22 (DfE, 2023b). Considering only state-funded schools, KS1 enrolment has shown a gradual decline in recent years, from 1.29 million students in 2015 to 1.27 million in 2022. According to the 2021 Census by the Office for National Statistics (ONS, 2021), the population between 5 and 15 years old increased between 2011 and 2021. Nonetheless, the population between 0 and 4 years old decreased significantly in the last decade, which may explain why the drop in KS1 only started to have effects from the 2017 school year onwards.
The KS2 is the most populous stage, as it covers the majority of compulsory education ages. According to official statistics, state-funded school enrolment increased from 2.45 million in 2015 to 2.62 million in 2022. Following the pathway of compulsory education, there are KS3 (Years 7 to 9) for 11 to 14-year-old students and KS4 (Years 10 to 11) for 15 to 16-year-old adolescents, both considered secondary schooling in England. According to official statistics from the DfE, secondary school enrolment has been slowly increasing since 2015, from 2.75 million students at these stages to the current figure of 3.12 million students in state-funded schools. Examining the specific stages, KS3 had 1.66 million students in 2015, rising to 1.91 million in 2022, while KS4 had 1.09 million students in 2015, increasing to 1.20 million by the end of the period. Besides the population growth in these year groups (ONS, 2021), another possible explanation for the growth in secondary school enrolment is the continuous influx of students.
Then, in the post-16 stage, the next step for students is KS5 (Years 12 to 13), encompassing 16 to 18-year-old students. Considering all the educational pathways, it has the highest number of variations to choose from, although attending college is the most common option. Some colleges are educational institutions attached to secondary schools, where students continue their training in the same institution, while “Sixth form” refers to a college independent from a secondary school. In state-funded schools, enrolment in post-16 stages slightly increased from 0.44 million in 2015 to 0.45 million in 2022. At this stage, the possible explanation for the increase in enrolments is the influx of students since, according to the 2021 Census, the population between 16 and 19 years of age has decreased in the last decade (ONS, 2021).
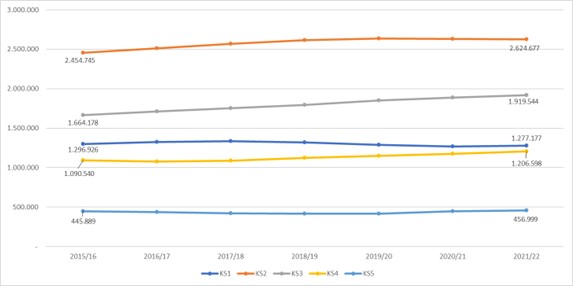
Source: The authors based on DfE (2022b). Note: European number format.
Figure 1 Enrolment in state-funded schools in England - 2015 to 2022
State-funded school types in England
The Education Act of 1944 deeply marked the national education system. Firstly, it established the legal framework for the provision of schooling by dividing it into two main stages: primary and secondary school, which remains in place to this day. Secondly, it placed schools under the control of local education authorities (LEAs), which were responsible for funding all such schools for a significant period of time (WEST; WOLFE, 2019). Thirdly, the Act emphasised the establishment of different school types, initially three: grammar schools, technical schools, and secondary modern schools.
With many modifications in the system during the second half of the 20th century, the concept of having multifaceted school types expanded significantly (WEST; BAILEY, 2013; WEST, 2014). Since the 2010s, there have been at least seven typical forms of state-funded schools in England (EYLES; MACHIN, 2019). These include community schools, academy schools, free schools, grammar schools, and city technology colleges. In terms of religious involvement in education, most faith schools in England are typically voluntary-aided or controlled schools that combine public funding with support from religious organisations. Table 1 shows the main characteristics of these schools in their current situation:
Table 1 Characteristics of state-funded schools in England with no fee charging
| School type | Characteristics | Compulsory National Curriculum | Admits nonpublic board |
|---|---|---|---|
| Academy School | Academy schools are run by not-for-profit academy trusts and are independent from the local authority. They have more freedom to change how to run the school. However, they must follow the same rules for pupil admissions as other state schools. Academies receive funding directly and are inspected by the central government. Some schools choose to become academies, or if a different school type funded by the local authority is judged as ‘inadequate’ by Ofsted, then it must become an academy. There are two types: converters (which had good or outstanding Ofsted grades and have opted to convert to academy status) and sponsored academies (mostly underperforming schools that have been encouraged to convert to an academy run by sponsors). | No | Yes |
| Free School | Free schools are funded by the government but are not run by the local authority. They can be run on a not-for-profit basis and can be set up by charities, universities, other private schools, faith groups, community groups, teachers, parents, and businesses. Also, they cannot use academic selection processes. The most common formats of free schools are: university technical colleges (UTCs), which specialise in subjects like engineering and construction and teach these subjects along with business skills and using IT, and studio schools, which are small (usually with around 300 pupils) teaching mainstream qualifications through project-based learning (working in realistic situations as well as learning academic subjects). | No | Yes |
| City technology college | City technology colleges and ‘the city college for the technology of the arts’ are independent schools in urban areas that are free to go to. They are funded by the central government, and companies can also contribute. City technology colleges emphasise teaching science and technology. Also, the city college for the technology of the arts teaches technology in its application of performing and creative arts, e.g. by offering interactive digital design courses. | No | Yes |
| Voluntaryaided (foundation school) | Voluntary-aided schools are maintained by the local authority. The foundation (generally religious) appoints most of the governing body, which is responsible for admissions and employing the school staff. Trustees usually own the land and buildings at voluntaryaided schools. | Yes | Yes |
| Voluntarycontrolled (foundation school) | Voluntary-controlled schools are a cross between community and voluntary-aided schools. They may share the governing body. These schools are also maintained by the local authority. However, the land and buildings are owned by a charity or religious group, which also appoints some governing body members. | Yes | Yes |
| Community school | Community schools are the typical state schools, sometimes called local-authority-maintained or comprehensive schools. They are not influenced by business or religious groups, and the local authority appoints the governing body, usually based on civil servants in the education sector. | Yes | No |
| Grammar school | Grammar schools are state funded, academically selective senior schools. They can be run by the local authority, a foundation body or an academic trust. These schools can select their students based on academic ability, and there is a test to get in. | Yes | Yes |
Source: The authors based on DfE (2023b); WEST, BAILEY (2013); WEST, WOLFE (2018); EYLES, MACHIN (2019).
In addition to the current variety of schools shown in Table 1, it is worth noting that most school types can have non-profit administrators, which have varying degrees of independence in managing the school depending on the school type. According to West and Wolfe (2018), this aspect, along with the variety of state-funded schools, is a key trend in the English educational system. In this sense, it was possible to establish autonomous bodies to manage schools, especially in the late 1980s, when they could act on most school decisions, such as finances and appointments, instead of being solely under the control of elected local authorities (BERTONI et al., 2020). As shown in Table 1, only Community Schools remain totally linked to a managing body controlled by the local authority.
In terms of the total of schools in England and the weight of each type in the national system, Table 2 shows the number of schools per type and number of pupils for the 2022-23 financial year. Academy converter schools (31%) currently have the highest number of state-funded schools, followed by community schools (29%), voluntary-aided (13%), and academy-sponsored schools (12%). In terms of enrolment per school type, academy converters (38%) receive the highest number of pupils, followed by community (25%), academy-sponsored (15%), and voluntary-aided schools (9%). Given that academies were introduced in the early 2000s, these figures highlight the system’s trend of rapid conversion of community schools into academies rapidly.
Table 2 - Number of state-funded schools and pupils per school type in 2022-23
| School Type | Schols | Pupils | ||
| nº | % | nº | % | |
| Academy converter | 6287 | 31,16 | 2887173 | 38,36 |
| Academy sponsored | 2413 | 11,96 | 1159525 | 15,4 |
| City technology college | 1 | 0,02 | 391 | 0,01 |
| Community school | 5973 | 29,6 | 1933798 | 25,69 |
| Foundation school | 705 | 3,49 | 307836 | 4,09 |
| Free schools | 457 | 2,26 | 214763 | 2,85 |
| Studio schools | 21 | 0,1 | 3246 | 0,04 |
| University technical college | 48 | 0,24 | 10526 | 0,14 |
| Vonluntary aided school | 2621 | 12,99 | 700658 | 9,31 |
| Voluntary controlled school | 1651 | 8,18 | 309330 | 4,11 |
| Total | 20177 | 100 | 7527246 | 100 |
Source: The authors based on DfE (2023b). Note: European number format.
School funding in England: trends and figures
Financing education appropriately is one of the most important items on the public agenda, but how much to spend and how to manage the budget are highly contentious topics. Accordingly, education expenditure in England has been a matter of great political debate. The line of reasoning in these discussions is marked by two related facts: the first issue is the decline in education spending since 2010, when public cuts started to affect the sector after nearly a decade of budget increases. Secondly, education spending as a share of the total public budget has declined over time, reaching the same low point seen in the 1980s (BOLTON, 2021; DRAYTON et al., 2022).
To begin the analysis, it is relevant to examine the rise of the share of public spending relative to government revenues over time. Figure 2 shows the total government revenue as a percentage of the Gross Domestic Product (GDP). Overall, following a period of decline and stagnation in tax revenue from 2009 to 2017, which started with the economic crisis in 2008, the government has gradually increased its revenue, as is evident from the total spending and its share of the GDP. Currently, as shown in the graph, the budget allocation within the government has reached its highest levels in terms of revenue and its share of the GDP. Considering inflation, the financial year of 2004 started with approximately £520 billion and reached £914 billion in 2022. In terms of the GDP, it increased from 36% to 39% in almost two decades.
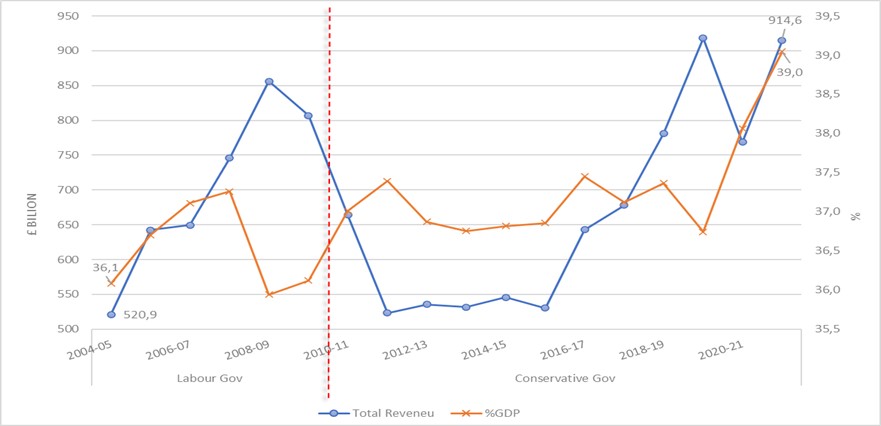
Source: The authors based on IFS TaxLab (IFS, 2022). Note: European number format
Figure 2 England’s total public revenue and its share of the GDP - in real terms up to 2022
To analyse the public expenditure in more detail, Figure 3 shows data from the HMT, dividing public expenditure by areas and presenting it as percentages from 2004 to 2021. Five areas stand out in Figure 3, providing a ranking of investment. The largest investment is in social protection, which includes sub-functions such as pensions, unemployment social services, and social housing. However, investment in this area has been falling since 2012 and more dramatically in the last two years. Health ranks second, which has been steadily growing over time, reaching 25% of the total public budget in 2021. Historically, education has been the third largest area of public investment. However, unlike health, the education sector has been receiving less funding each year, decreasing from about 16% of the total public budget to only 10% in 2021. Economic affairs have also received considerable attention from governments, especially after 2012. During the COVID-19 pandemic, the government chose to allocate additional funds to this area, making it the third largest area of expenditure instead of education. The increased spending on economic affairs was mainly directed towards the Job Retention and Self-Employment Income Support Schemes and supporting businesses across the country (BRIEN, 2022). Lastly, the fifth area that stands out is public order and security, which covers police services, law courts, prisons, and other aspects. Although it carries significant costs, investment in this area has also declined over time.
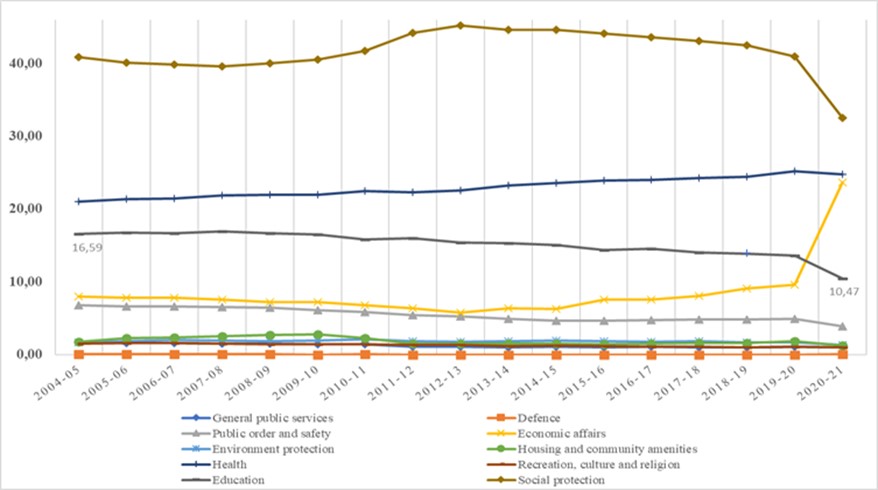
Source: The authors based on HM Treasury, Public Expenditure Statistical Analyses (PESA, 2022); previous PESAs. Note: European number format
Figure 3 Public spending across different areas as a share of the total public budget
Focusing on the decline in the educational budget, the conservative governments’ cost-cutting strategy in the education sector is reflected in several sub-functions. According to Britton et al. (2020) and Bolton (2021), part of the decrease reflects a general decline in capital spending center after 2010. Also, there has been an increase in private funding for higher education through graduate contributions later in life via the student loan system (DRAYTON et al., 2022), negatively impacting the overall public investment in tertiary education.
Figure 4 shows public spending on compulsory education sub-functions in relation to total education expenditure from 2004 to 2021.
When examining the total expenditure in real terms up to 2022, there was a significant decline over the period, with some recent attempts to recover. As highlighted in the literature review on education financing (BOLTON, 2021), education spending has risen notably in real terms until 2010, particularly during the late 1990s and late 2000s under Labour Governments. The peak was reached in 2009-10 with approximately £104.5 billion. After that, public education faced cost pressures, reaching the lowest spending in 2016-17 with £60.7 billion. It is possible to observe growth in total spending until the 2019-20 financial year, with levels close to 2007-08, at around £82 billion. Based on the figures in Figure 4, education spending has fallen by over 15% in real terms since 2010.
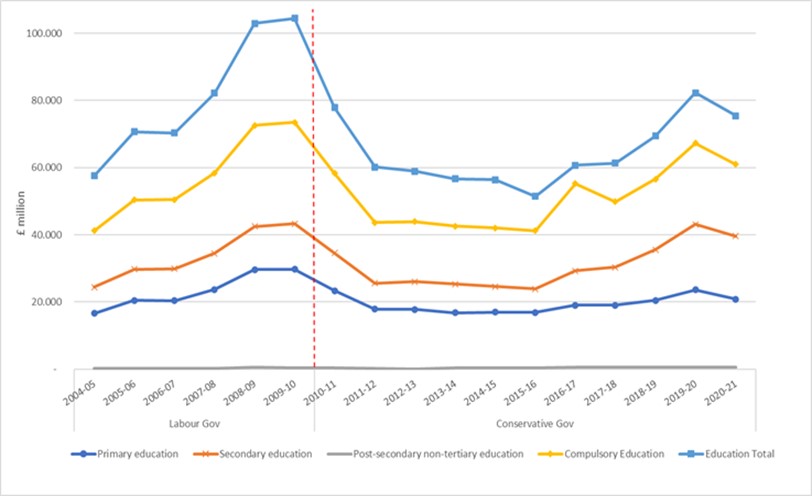
Source: The authors based on HM Treasury, Public Expenditure Statistical Analyses (PESA, 2022); previous PESAs. Realterms figures calculated using GDP deflators provided by the Office for National Statistics (ONS) and the Office for Budget Responsibility (OBR) from November 2022. Note: European number format
Figure 4 England’s public spending on education - in real terms up to 2022
Investment in compulsory education in England has been the primary cost of the education budget. In Figure 4, compulsory education (including primary, secondary, and secondary non-tertiary costs) closely aligns with the total trend over time. At the beginning of the period, it accounted for 72% of the total, close to the average across OECD countries (OECD, 2022), and escalated to 81% in 2020-21. According to the literature, this shift in the relative numbers can be attributed to a) additional funding allocated to the Dedicated Schools Grant (DSG) by using Minimum Funding Levels across a range of pupil and school characteristics, especially in 2016-17 (PERERA; ANDREWS, 2020), b) the decline in public funding for higher education (DRAYTON et al., 2022).
Secondary education received the most generous funding during the period, with an increase from around £24.4 to £40 billion in 2020-21. During the depression and stagnation in the educational budget, secondary schools lost almost £20 billion in real terms until 2015-16. However, it is worth noting that spending on secondary schools almost reached £42.2 billion in 2010, which did not occur with any other sub-functions of the education budget. Interestingly, this stage is primarily run by private trusts in England. As we will discuss further in this paper, for instance, academy schools account for 72% of all secondary schools in compulsory education.
In the primary stages, there was a period of growth during the Labour Government, with funding increasing from £16.5 to £30 billion in 2010-11. However, the general budget decline brought primary school spending back to 2004 levels by 2015. With the additional budget for DSG in 2016, there was a slight expansion, reaching £20.8 million by the end of the period. On average, expenditure on primary schools accounted for 30% of the total education budget, which aligns with practices in most OECD countries. It is worth noting that the level of expenditure on primary schools varies widely across nations, ranging from 20% in countries with shorter duration and fewer students, such as Austria and Germany, to nearly 40% in countries like Canada, Sweden, and Mexico (OECD, 2022).
The post-secondary non-tertiary (post-16) sector accounts for a small fraction of the total funding, from £0.25 billion to £0.5 billion in the last financial year, as shown in Figure 4. These figures represent less than 0.5% of the total budget. While considered part of compulsory education in England from 2008 onwards (unlike other OECD countries and even within the UK), this stage has not received as much financial attention from different governments.
Current criteria for allocation and distribution of resources: the national funding formula (NFF) for schools
The Department for Education is responsible for determining the core revenue funding for all state-funded schools in England through the NFF. Since 2018, there has been a single national funding formula for compulsory-aged schools, replacing the previous formulae used by 152 LAs with one based on pupil-led factors, school-led factors, premises, and historical factors (DfE, 2021). The formula uses pupil, school, and historical funding data from the School Census and official funding sources to determine the amount for each school, including all types of state-funded schools.
Table 3 shows the NFF figures and factors for primary and secondary schools in 2022-23, while separate formulae are used for the other stages of education (ROBERTS, 2022). The total budget for schools in the 2022-23 financial year was set as £53.8 billion according to the government’s official statement (HMT, 2021), and the funds allocated through the NFF and other costs such as Pupil Premium amounted to approximately £45.1 billion (DfE, 2023b). Thus, the budget in Table 3 represents almost 84% of the total allocation to the education sector in England. In the table, most of the funding is allocated based on pupil-led factors, meaning that the characteristics of pupils attending each school have more weight in allocating the funds (81.5%) in the NFF. This is followed by High Needs funding (10.1%), school-led grants (6%), and premises and historical factors (1.75%), which together form the school-level costs.
The most significant factor in 2022-23 is the basic entitlement set for different ages (66%), where secondary school pupils receive higher funding compared to primary school (£3,217). The secondary school’s basic entitlement is divided into KS3 (£4,536) and KS4 (£5,112). These differences will undoubtedly affect the per-pupil revenue attracted by schools, as this basic entitlement forms a substantial portion of the per-pupil funding.
Aligned with the goal of closing education gaps for disadvantaged students (DfE, 2021), the NFF apportions extra funding to schools with more disadvantaged pupils to address a range of circumstances. These pupil-led costs are divided into stage levels for a minimum per-pupil cost, as shown in Table 3. For 2022-23, the formula includes eligibility for free school meals (FSM) (1.8%) and pupils who have ever been eligible for FSM in the past six years (FSM6) (3%). In addition, the NFF considers students living in deprived neighbourhoods based on the Income Deprivation Affecting Children Index range (IDACI bands A to F) (3.1%). In terms of pupil achievement, the formula allocates grants based on lower prior attainment (pupils identified as not achieving the expected level of development) (5.6%) and whether they have English as an additional language (EAL) (1%).
The government formula for school-level costs includes nine factors. The government must grant a lump sum to primary and secondary schools in recognition of the fixed costs they face. In the current financial year, every school receives £121,300 through the formula, representing 5.6% of the total funding directly provided to schools. Other issues, such as pupil mobility (schools receiving a significant number of new students), sparsity (to protect remote and small schools), and London fringe (schools close to London and facing higher costs), represent 0.4% of the total grant. Moreover, several other factors are set based on historical terms and are outside the control of schools, such as non-domestic rates (0.6%), costs of running a split-site school (0.1%), ongoing Private Finance Initiative (PFI) costs (0.4%), minimum funding guarantee (MFG) (0.6%), and exceptional circumstances (less than 0.1%).
Lastly, the High Needs Funding is also a significant component of the total. It is not a factor but a national formula for allocating SEN (special educational needs) pupil provision to school-attending children and young people with special needs and disabilities. For 2022-23, there are twelve elements to the formula, ranging from the basic entitlement (£4,660) per pupil with area cost adjustment (ACA), historical spend factors, disadvantage factors (e.g., FSM, FSM6, IDACI), low prior attainment, and other factors and adjustments considering pupils’ health conditions (DfE, 2021). In the 2022-23 data, the High Needs spend amounted to £4.5 million, representing approximately 10% of the school budget. For 2022-23, the High Needs Funding was allocated to 10,432 schools (almost 50%) across the country, supporting about 7.4 million pupils.
Table 3 National funding formula allocation (2022-23)
| Factors | Primary amount per pupil [£] |
Secondary amount per pupil [£] |
Total allocated [£] | Percentage allocated (%) |
|
|---|---|---|---|---|---|
| Pupil-led factors | |||||
| Basic Entitlement |
Minimum Per Pupil Level | £3217 | KS3: £4.536 | £ 29.803.311.381 | 66,1 |
| KS4: £5.112 | |||||
| Addicional need funding | |||||
| Eligible for Free School Meal (FSM) | £470 | £470 | £ 830.888.325 | 1,8 | |
| Eligible for FSM in past 6 years | £590 | £865 | £ 1.356.975.557 | 3,0 | |
| IDACI band A | £640 | £890 | £ 183.567.251 | 0,4 | |
| IDACI band B | £490 | £700 | £ 278.420.337 | 0,6 | |
| IDACI band C | £460 | £650 | £ 254.766.864 | 0,6 | |
| IDACI band D | £420 | £595 | £ 220.423.949 | 0,5 | |
| IDACI band E | £270 | £425 | £ 278.259.711 | 0,6 | |
| IDACI band F | £220 | £320 | £ 202.325.771 | 0,4 | |
| Minimum level of per-pupil funding | £4265 | £5525 | £ 383.522.163 | 0,9 | |
| Lower prior attainment | £1.130 | £1.710 | £ 2.543.219.259 | 5,6 | |
| English as an additional language | £565 | £1.530 | £ 408.925.772 | 0,9 | |
| Pupil-led factors' total | £ 36.744.606.340 | 81,5 | |||
| School level costs | |||||
| School-led funding | |||||
| Lump sum | £121.300 | £ 2.543.504.019 | 5,6 | ||
| London fringe (for eligible authorities) | £91 | £115 | £ 29.085.097 | 0,1 | |
| Pupil Mobility | £925 | £1.330 | £ 43.902.629 | 0,1 | |
| Sparsity | up to £55.000 | up to £80.000 | £ 89.693.733 | 0,2 | |
| Premises and historical factors | |||||
| National Non Domestic Rates Funding | £ 275.502.946 | 0,6 | |||
| Private finance initiative (PFI) | £ 193.493.773 | 0,4 | |||
| Split sites | £ 28.166.494 | 0,1 | |||
| Minimum funding guarantee (MFG) | £ 269.673.758 | 0,6 | |||
| Exceptional circumstances | £ 20.770.521 | 0,05 | |||
| School level costs | £ 3.493.792.970 | 7,7 | |||
| High Needs Funding | |||||
| High Needs NFF |
£ 4.555.459.646 | 10,1 | |||
| Total* | £ 45.088.231.340 | 100,0 | |||
Source: The authors based on the DfE (2023b). Note: in this table, the Total* considers resources that are not part of the NFF, such as ‘pupil premium 22/23’, ‘universal infant free meals grant’, ‘PE & sport premium 22/23’, ‘Coronavirus (Covid-19) recovery premium’, ‘school-led tutoring’, and ‘school supplemntary grant 22/23’. European number format.
Per-pupil expenditure in primary and secondary state-funded schools in England
In light of the preceding discussion, it is crucial to focus on per-pupil expenditure in England. Researchers commonly use per-pupil expenditure to examine education funding because it can offer a more accurate view of the needs in the educational sector. For instance, calculating per-pupil expenditure addresses methodological issues associated with funding by considering both the number of pupils requiring public sector support and their educational stage. These factors are pivotal in determining funding levels. Such precision is unattainable when analysing funding figures or the share of the GDP alone. Moreover, public per-pupil expenditure serves as an indicator for assessing equal educational opportunities and enables meaningful comparisons between different regions of the country or with practices in other countries. As in the case of this paper, this parameter is treated to highlight disparities in expenditures across different school types.
Historically, the average state per-pupil expenditure in basic education has decreased since 2010 as a potential result of the fall in total education expenditure and the increase in enrolment, as noted earlier. As highlighted by Sibieta (2023a), from 2010 to 2020, school spending per pupil in England decreased in real terms by about 8%. In the author’s study, for the 2022-23 financial year and considering all school stages except tertiary education, England’s school spending per pupil is about £7.200. The Department for Education (2023) reached different figures by analysing only primary and secondary schools, where the average per-pupil funding decreased by about 2%, from £6.680 in 2010 to £6.540 in 2020. Considering the COVID-related additional expenditure from 2020 to 2022, the average increased from £6.540 to £6.830 in real terms.
Table 4 shows the level of school spending per pupil across all the compulsory state-funded types of schools, broken down into primary and secondary schools, according to government data. It should be noted that the dataset used does not include post-secondary school and pupil data. It presents the number of pupils and schools, total funding allocated, and per-pupil expenditure for the 2022-23 financial year by school type.
Table 4 Per-pupil funding in compulsory state-funded education in English schools (2022-2023 financial year)
| Number of pupils | Number of schools | Total funding allocated | Per-pupil stipend | |||||||||
|---|---|---|---|---|---|---|---|---|---|---|---|---|
| Primary (a) | Secondary (b) | Total (a+b) | Primary (c) | Secondary (d) | Total (c+d) | Primary (e) |
Secondary (f) |
Total (e+f) |
Primary (e/a) | Secondary (f/b) | Total (a+b)/ (e+f) |
|
| Academy converter | 1.267.947 | 1.617.876 | 2.885.823 | 4.647 | 1.640 | 6.287 | £6.736.239.347 | £10.324.173.433 | £17.060.412.780 | £5.313 | £6.381 | £5.912 |
| Academy sponsor led | 445.270 | 714.255 | 1.159.525 | 1.631 | 782 | 2.413 | £2.563.274.898 | £5.150.434.414 | £7.713.709.312 | £5.757 | £7.211 | £6.652 |
| City technology college | 391 | - | - | 1 | £2.699.072 | £6.903 | £6.903 | |||||
| Community school | 1.641.429 | 292.369 | 1.933.798 | 5.669 | 304 | 5.973 | £9.124.080.578 | £2.032.616.257 | £11.156.696.835 | £5.559 | £6.952 | £5.769 |
| Foundation school | 153.854 | 153.982 | 307.836 | 542 | 163 | 705 | £823.836.175 | £1.053.091.045 | £1.876.927.220 | £5.355 | £6.839 | £6.097 |
| Free schools | 63.218 | 151.545 | 214.763 | 239 | 218 | 457 | £342.885.559 | £1.027.613.296 | £1.370.498.855 | £5.424 | £6.781 | £6.381 |
| Studio schools | 3.246 | 3.246 | - | 21 | 21 | £26.486.344 | £26.486.344 | £8.160 | £8.160 | |||
| University technical college | 10.526 | 10.526 | - | 48 | 48 | £80.938.431 | £80.938.431 | £7.689 | £7.689 | |||
| Voluntary aided school | 523.510 | 177.148 | 700.658 | 2.420 | 201 | 2.621 | £2.868.044.473 | £1.218.061.690 | £4.086.106.163 | £5.478 | £6.876 | £5.832 |
| Voluntary controlled school | 284.181 | 25.149 | 309.330 | 1.624 | 27 | 1.651 | £1.549.690.249 | £164.066.061 | £1.713.756.310 | £5.453 | £6.524 | £5.540 |
| Total | 4.379.409 | 3.146.096 | 7.525.896 | 16.772 | 3.405 | 20.177 | £24.008.051.279 | £21.077.480.971 | £45.088.231.322 | £5.482 | £6.700 | £5.991 |
Source: The authors based on School funding in England: Revenue funding to state-funded schools, 2022-2023 (DfE, 2023b). Note: in this table, the ‘total funding allocated’ considers the following resources: ‘pupil premium 22/23’, ‘universal infant free meals grant’, ‘PE & sport premium 22/23’, ‘Coronavirus (COVID-19) recovery premium’, ‘school-led tutoring’, and ‘school supplementary grant 22/23’. Therefore, the ‘per-pupil funding’ column might differ from the ‘per-pupil allocation’ figures in the source. European number format.
Before delving into per-pupil funding, it is important to consider the total allocation by school type, especially pondering the academisation process in England. Approximately 58% of the total education budget (£26 billion) flows to academy trusts, which run academies and other school types. Only 25% (£11 billion) remains available for community schools, which are fully state-regulated. These figures clearly indicate the ongoing privatisation process in England’s compulsory education system. In terms of stages, community schools receive about £9 billion for primary education, followed by academy converter schools (£6.7 billion), and voluntary-aided schools (£2.8 billion). For secondary schools, academy converters and academy sponsor-led schools receive £10 billion and £7 billion, respectively, followed by community schools with about £2 billion from the central government. This also shows that the privatisation of schooling is more prevalent in the secondary stage, although it is also expanding to primary stages.
Focusing on per-pupil expenditure, only three school types have a higher per-pupil expenditure than the average reported by the DfE (2023) on their website (£6.830). It is also interesting to observe that the three highest expenditures are in secondary schools with fewer students. Studio schools, which are all run by private trusts and only offer secondary stages, have the highest total expenditure at £8.160. They are followed by university technical colleges (£7.689), which are also run by trusts, and the sole city technology college, with £6.903 per student.
In general, Table 4 shows that all primary schools receive fewer per-pupil resources than secondary schools. The difference ranges from approximately £1.000 per student in academy converter and voluntary controlled schools to about £1.450 in academy sponsor-led and foundation schools. This contrast is expected as secondary school students weigh more on the distribution of funds from the NFF. As mentioned above, all the pupil-led and some school-led NFF factors are influenced by stage, accounting for about 82% of the total funding in 2022-23.
According to Table 4, no primary school students in England receive resources close to the average per-pupil expenditure announced by the DfE, regardless of the school type they attend. This contrast is clear when ranking expenditure by school type: community schools have the highest expenditure (£5.559), as they are responsible for the majority of students and cover more regions with primary education across the country, while academy converter schools have the lowest (£5.313), which controversially are the second most common type of school for primary students.
In contrast to primary schools, as shown in Table 4, per-pupil expenditure for secondary schools is generally higher than the average calculated by the DfE. Apart from the previously mentioned studio schools and university technical colleges, academy sponsor-led schools rank third with £7.211 per pupil. The school types that are close to the DfE per-pupil average are community schools (£6.952), foundation schools (£6.839), and voluntary-aided schools (£6.876). Below the DfE average are academy converter schools (£6.381), free schools (£6.781), and voluntary controlled schools (£6.524).
CONCLUSIONS
Since the 1980s, the school system has been influenced by neoliberal agendas pursued by different governments in England. The outcomes have been radical changes in the provision of state-funded education, including increased involvement of private actors and shifts in the funding strategy to bypass the administrative capacities of LAs and LEAs. The first result has been the proliferation of school types operated by non-public bodies, leading to an academisation of schooling in England. The second is that the school funding strategy has moved towards direct funding from the central government, calculated based on a single nationwide formula. A significant portion of the public budget (currently 58%) flows to private actors, strengthening their ways of thinking, administrating, and providing education within a quasi-market context.
In different words, the introduction of the national funding formula (NFF), and more recent development of the ‘direct NFF’, limit the general capacity and agency of LAs to determine the distribution of school funding. Furthermore, academy schools - and the less-common ‘free schools’ in England - are funded directly by the government, without influence of any LA. Thus, the expansion of academy schools in England, referred to as ‘academisation’, continues to reduce both the financial and legislative control of LAs over schools.
School attendance has seen a general increase in compulsory education enrolment and has created pressure to expand funding, especially for secondary education enrolment, which requires higher funding in the NFF calculation. However, compulsory education funding experienced a decline and stagnation in England during the 2010s after unprecedented levels of growth in previous years. This decline in funding was a conservative government response to the financial crisis that began in 2008, leading to a decrease in total public revenue and increased costs, when the government implemented austerity policies in social sectors, again in line with neoliberal principles (BLYTH, 2013).
As a result, education funding has not been able to reach the same expenditure levels as in 2010, despite recent efforts to increase the budget and the government’s plans and promises. This has been a central concern for people involved in publicly-funded education, especially school staff and teachers whose salaries have suffered due to budget cuts and inflation (SIBIETA, 2023b). School worker unions are currently undertaking industrial actions for better work conditions and pay increases to address the rapidly rising cost of living in England (ROBERTS; LONG, 2023).

