


 texto em
  Inglês (pdf)
 Artigo em XML
 Enviar este artigo por email
 Permalink
The Teacher Well-Being Scale (Ebed) was built taking into consideration the teacher well-being / state of malaise analysis model posited by Rebolo (2005, 2012a, 2012b, 2014) and its finality is to measure the teachers’ degree of satisfaction concerning the objective dimension factors of labor.
In this analysis model the teachers’ well-being is a dynamic process, built during the professional experience and it presents itself in the intersection of two dimensions, an objective one (portraying socioeconomics, relationships, aspects of the labor activity and infrastructural of the working environment) and a subjective one (concerning the teachers’ education, life plans, needs and expectations). The possibility of building the teachers’ well-being (or a state of malaise) presents itself in the intersection of the objective and subjective dimensions.
Said intersection is called symbolic dimension and refers to the correspondences (or non-correspondences) between the personal characteristics and the aspects of the objective labor dimension. The teachers’ self-evaluation (both cognitive and affective) and the evaluation of the work that is performed as well as the existent conditions to perform the labor will form this dimension and will be the starting point so that the impact of the objective dimension factors in the teachers’ well-being will be known. When the results of this evaluation are positive (a greater number of factors being evaluated as satisfactory) the possibility of labor well-being will be present; and when it is negative (a greater number of factors being evaluated as unsatisfactory) there might be labor malaise, a state of discomfort, resultant from dissatisfactions and conflicts, and might even result in the worker falling ill. Figure 1 shows this model in schematics.
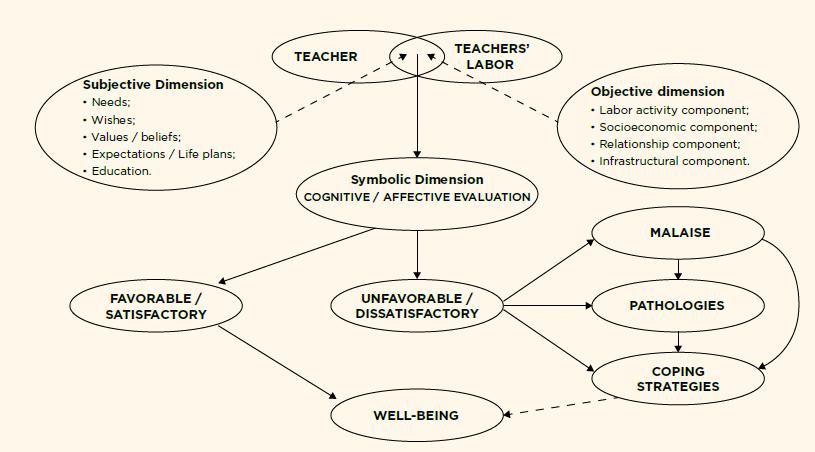
Source: Rebolo (2012b, p. 33).
FIGURE 1 SUMMARY OF THE MODEL POSITED BY REBOLO TO THE TEACHER WELL-BEING / MALAISE ANALYSIS
SUBJECTIVE AND OBJECTIVE DIMENSIONS OF TEACHER WELL-BEING / MALAISE ANALYSIS
The subjective dimension is related to the teacher’s personal characteristics and entails both their acquired competencies and skills as well as their needs, wishes, values, beliefs and life plans and, also, their formation and professional knowledge needed to perform tasks. Beyond these, it also entails those aspects pointed out by Ryff (1989) and Ryff and Keyes (1995) as essential to the well-being, namely: self-acceptance, life purpose and personal growth.
The subjective dimension and its impact in the teacher well-being development can be revealed upon data collected through the semi structured interviews o focal groups and the narratives of teachers’ professional life stories, analyzed using content analysis (BARDIN, 2011) or thematic content analysis (SCHÜTZE, 2007a, 2007b).
The objective dimension is related to the characteristics of the labor itself and to the conditions presented for its performance. Taking the aspects cited by Csikszentmihalyi (1992, 1999) as essential so as everyday life activities result in satisfaction, and the environmental characteristics that, according to Peter B. Warr (1987), must be present in labor activities and make up the basis of well-being and, also, taking into account the model posited by Richard Walton (1973, 1975), which is made of eight specific criteria to the analysis of the quality of life in the labor environment, the teacher labor analysis is posited through four aspects, namely:
Labor Activity Aspect: related to the sum of tasks the teachers’ labor entails and to the specificities of said tasks regarding their diversity and identity they have among themselves, to the autonomy degree they allow, to the challenges they propose, to the skill and focus requirements, to the sensation of time shift and to the possibility of controlling the situations. The factors related to this aspect are: Relatability to the accomplished tasks; Pace of work; Task diversity; Autonomy and Use of creativity.
Relationship Aspect: related to how the labor is managed, namely entails the relationships between teacher and labor activity and the interpersonal relationships in the school institution. It includes the following factors: Freedom of expression; Repercussion / acceptance of one’s ideas; Collective work / groups of work / experiences exchange; Privacy / preserved personal life; Interpersonal relationships in the work environment; Recognition of the accomplished work / feedback; Absence of prejudices; Treatment equality; Hierarchical relationships; Social-emotional support; Participation in decisions regarding goals / objectives / strategies; Data flux / means of communication.
Socioeconomic Aspect: ranges from social to economic aspects, which directly affect the teacher’s work and life. The factors related to this dimension are as follows: Working hours; Salary; Variable Salary (bonuses, gratifications, overtime, etc.); Proceeds (both material and non-material); Acquired rights; Predictable hours; Free time for leisure and family; Job Stability; Career plan; Professional development / trainings / continuous education; Knowledge of school’s goals; Relatability to the social objectives of teaching; The internal image of the school and the educational system (between students, teachers, employees and management); The public image of the school and the educational system (between the community and society at large); School’s communal / social responsibilities; Students’ interest levels.
Infrastructural Aspect: entails the material and/or environmental conditions in which the work is performed and included the following factors: Cleanliness / comfort in the work environment; Safety in the work environment; Pedagogical tools / equipment / materials; Adequate facilities and general infrastructural conditions.
The teacher satisfaction/dissatisfaction degree regarding the aspects and factors of the labor objective dimension can be known by applying the Teacher Well-being Scale (Ebed).
The model presented above makes a global vision of the well-being acquirement process possible by the teacher in their work and can direct the teacher well-being/malaise investigation in a clearer and more systematic way and, also, can provide assets to motions and interventions in the school and in the educational system that aim to develop the quality of work life and the teacher well-being in the teaching experience.
THE TEACHER WELL-BEING SCALE (EBED)
The Teacher Well-being Scale (Ebed) is a tool that aims to evaluate the teachers’ satisfaction degree with the 37 variables from the four labor items (labor activity, socioeconomic, relationship and infrastructural), sourced from the theoretical reference cited above. In Chart 1 the variables that correspond to each labor item are detailed.
CHART 1 VARIABLES FROM THE FOUR LABOR ITEMS INCLUDED IN THE EBED
| Labor Items | Definition | Corresponding Variables* |
| Infrastructural | Regards the material and/or environmental conditions in which the work is performed. | (4 variables) (02) Cleanliness/comfort in the work environment; (03) Safety in the work environment; (04) Pedagogical tools / equipment / materials; (05) Adequate facilities and general infrastructural conditions. |
| Labor Activity | Regards the sum of tasks which the teaching labor comprises and the specificities of said tasks. | (5 variables) (06) Relatability to the accomplished tasks; (07) Pace of work; (08) Task diversity; (12) Autonomy; (13) Use of creativity; |
| Socioeconomic | Regards the social and economic aspects that affect the teacher directly. | (16 variables) (01) Work hours; (09) Salary; (10) Variable Salary (bonuses, gratifications, overtime, etc.); (11) Proceeds (material and non-material); (17) Acquired rights; (19) Predictable hours; (20) Free time for leisure and family; (23) Work stability; (24) Career plan; (25) Professional development / trainings / continuous education; (30) Knowledge of the school’s goals; (33) Relatability to the social education goals; (34) Internal image of the school and the educational system; (35) Public image of the school and the educational system; (36) School’s social/communal responsabilities; (37) Students’ level of interest. |
| Relationship | Regards how the labor is managed, namely entails the interpersonal relationships in the school institution. | (12 variables) (14) Freedom of expression; (15) Repercussion/acceptance of the teachers’ ideas; (16) Collective work / groups of work / experiences exchange; (18) Privacy / preserved personal life; (21) Interpersonal relationships in the work environment; (22) Recognition of the accomplished work / feedback; (26) Absence of prejudices; (27) Treatment equality; (28) Hierarchical relationships; (29) Socio-emotional support; (31) Participation in the decisions regarding goals/objectives/strategies; (32) Data flux/Means of communication. |
Source: Developed by the authors based on Rebolo (2012b).
*The numbers to the left of the variables correspond to the order in which said variables are presented in the Scale.
METHODOLOGICAL PROCEDURES
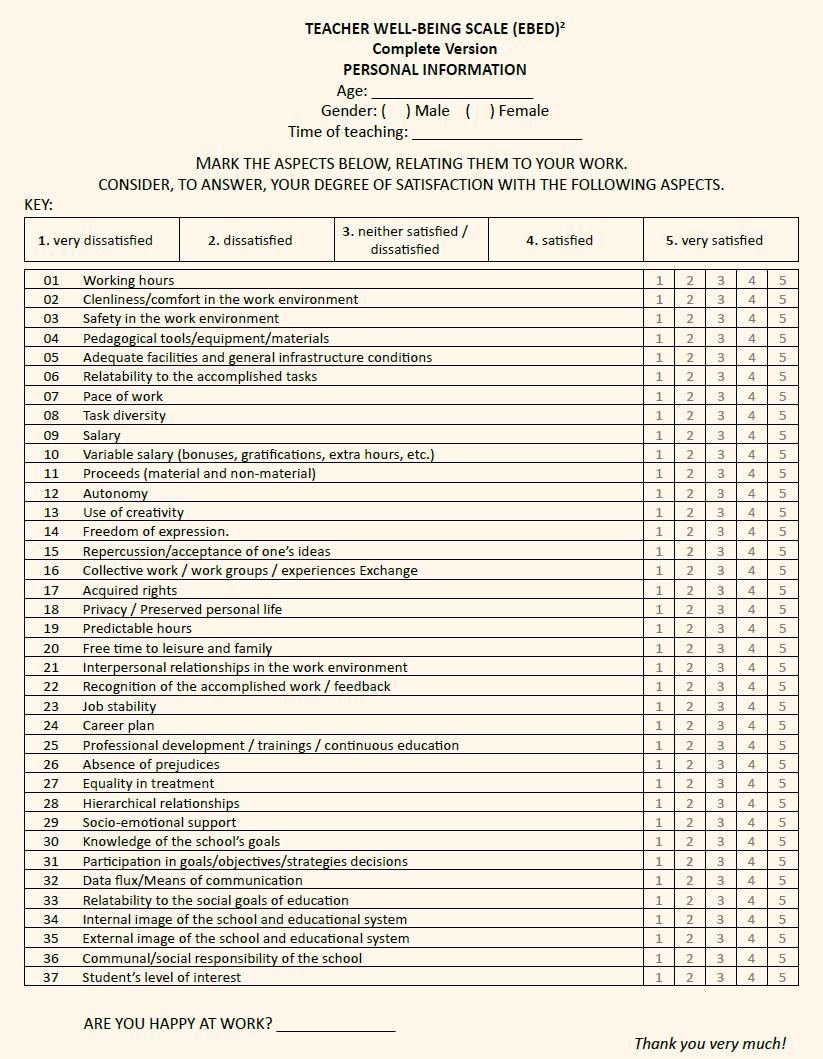
Ebed is a tool divided in three parts: the first part, made out of items regarding personal data (age and gender) and professional data (length of service in teaching); the second part, made out of 37 variables which correspond to the fours items of the objective dimension of labor (labor actibivity, socioeconomic, relationship and infrastructural), was built following the Likert scale model with five categories of answer (very dissatisfied, dissatisfied, neutral, satisfied, very satisfied), which allows teachers to express their degree of satisfaction/dissatisfaction regarding each variable; the third part, is made out of the question: “Are you happy at work?”, taking into consideration that the well-being is a phenomenon that cannot be measured externally and its existence can only be affirmed or denied by the own person, thus, this question seeks to find each teacher’s feelings towards their work so that the relationship between the variables evaluated as satisfactory/dissatisfactory and the self-perception of happiness could be delineated.
The investigated universe was comprised of a group of teachers from the Basic Education (elementary and high schools), from school systems ranging from state, municipal and private from a city in the State of São Paulo’s countryside. 829 surveys were sent of which 353 returned filled in. Of the 353 teachers who answered the survey, 67 (19%) did not answer the last question “Are you happy at work?” Of the 286 (81%) who answered this question, 152 teachers answered that they are happy at work; 98 answered that they are not happy at work; and, 36 answered that they are either happy sometimes or most of the time.1
The data analysis was performed using the Pearson Correlation, aiming to assess the linear bivariate correlation degree, and the Principal Component Analysis (PCA), aiming to identify the variables with greater proportion of fluctuation in relation to the others, pointing out which Principal Components (PCs) raise the well-being level.
RESULTS
CORRELATION ANALYSIS
The Pearson Correlation Coefficient was used in the analysis of correlation,
where (𝑥i, 𝑦i) are the analyzed bivariate. The Pearson Correlation Coefficient is represented by 𝝆, which allows values ranging from -1 to 1. When 𝝆=𝟏 it means a perfect positive correlation between two variable, and 𝝆= −𝟏 means a perfect negative correlation between two variables, meaning, when one raises, the other one always decreases (CONSTANTINO et al., 2017).
VARIABLES OF THE INFRASTRUCTURAL ITEM
The correlation coefficients shown in Table 1 reveal that all four variables of the Infrastructural item, which are detailed in Board 1, have a high degree of linear association amongst themselves in the same direction (an average of 0,57). That indicates, for instance, that the teachers that are content with the “Cleanliness/comfort of the work environment” tend to also be content with the “Safety in the work environment” and, likewise, that the teachers that are not content with the “Cleanliness/comfort of the work environment” tend to also not be content with the “Safety in the work environment” (0,64). The correlation coefficients among the variables of the Infrastructural item and the “Happy” variable (defined by the question: Are you happy at work?) are, also, positive and the one that associates the most with the “Happy” variable is “Cleanliness/comfort in the work environment” (0,38). The others show a lower correlation coefficient (0,29; 0,23 and 0,21). However, any one of them can be confirmed as a factor in the scale.
TABLE 1 PEARSON CORRELATION COEFFICIENTS REGARDING THE VARIABLES OF THE INFRASTRUCTURAL ITEM OF THE OBJECTIVE WORK DIMENSION AND THE “HAPPY” VARIABLE
| Variables: Infrastructual item | 03 | 04 | 05 | Happy |
| (02) Cleanliness/comfort in the work environment | ,64 | ,49 | ,56 | ,38 |
| (03) Safety in the work environment | ,54 | ,44 | ,29 | |
| (04) Pedagogical tools / equipment / materials | ,75 | ,23 | ||
| (05) Adequate facilities and general infrastructural conditions | ,21 |
Source: Authors’ elaboration.
VARIABLES OF THE LABOR ACTIVITY ITEM
The correlation coefficients shown in Table 2 reveal that the five variables of the Labor Activity item have a high degree of linear association amongst themselves (an average of 0,62). That indicates, for instance, that the teachers that claim to be content with the “Pace of work” tend to be content with the “Task diversity” and, likewise, the one that are not content with the “Pace of work” tend to not be content with the “Task diversity” (0,72). The correlation coefficients among the Labor Activity item and the “Happy” variable are also positive, especially “Pace of work” and “Autonomy” (0,42). Whilst the lowest correlation coefficient (0,27) occurs between the “Task diversity” variable and the “Happy” variable.
TABLE 2 PEARSON CORRELATION COEFFICIENTS REGARDING VARIABLES OF THE LABOR ACTIVITY ITEM OF THE OBJECTIVE WORK DIMENSION AND THE “HAPPY” VARIABLE
| Variables: Labor Activity item | 07 | 08 | 12 | 13 | Happy |
| (06) Relatability to the accomplished tasks | ,71 | ,72 | ,61 | ,60 | ,36 |
| (07) Pace of work | ,72 | ,52 | ,57 | ,42 | |
| (08) Task diversity | ,55 | ,59 | ,27 | ||
| (12) Autonomy | ,71 | ,42 | |||
| (13) Use of creativity | ,41 |
Source: Authors’ elaboration.
VARIABLES OF THE SOCIOECONOMIC ITEM
The socioeconomic item lists 16 variables, a wide arrange of data to the participants’ reality investigation.
As with the two previous items (Infrastructural and Labor Activity), the Socioeconomic item’s variables present positive correlation coefficients amongst themselves and to the “Happy” variable (Table 3). In this arrange of variables, variables that are strongly associated in the same direction can be highlighted (correlation coefficients both high and positive), namely: “Working hours” and “Free time” (0,57); “Working hours” and “Relatability / social goals” (0,55); “Salary” and “Proceedings” (0,74); “Relatability / social goals” and “Internal and external image” (0,67; 0,61) and “Responsibilities” and “Internal and external image” (0,70; 0,72).
Regarding the degree of association between the variables of the socioeconomic item and the “Happy” variable, the ones that can be highlighted present correlation coefficients around 0,40, which are: “Working hours” (0,43), “Variable salary” (0,37), “Participation in decisions about goals” (0,40), “Relatability/social goals” (0,40) and “Internal image” (0,42).
Even though all the variables of the socioeconomic item have presented positive correlation coefficients, some variables do not seem to reveal any impact over the “Happy” variable, namely: “Acquired rights” (0,06); “Stability” (0,02) and “Career plan” (0,17).
TABLE 3 PEARSON CORRELATION COEFFICIENTS REGARDING THE VARIABLES OF THE SOCIOECONOMIC ITEMS IN THE OBJECTIVE WORK DIMENSION AND THE “HAPPY” VARIABLE
| Variables: Socioeconomic item | 9 | 10 | 11 | 17 | 19 | 20 | 23 | 24 | 25 | 30 | 33 | 34 | 35 | 36 | 37 | Happy |
| (01) Working hours | ,33 | ,45 | ,25 | ,05 | ,44 | ,57 | ,07 | ,31 | ,34 | ,44 | ,55 | ,48 | ,43 | ,38 | ,38 | ,43 |
| (09) Salary | ,57 | ,74 | ,40 | ,17 | ,24 | ,19 | ,37 | ,57 | ,20 | ,29 | ,37 | ,36 | ,34 | ,31 | ,33 | |
| (10) Variable salary | ,65 | ,17 | ,35 | ,42 | ,23 | ,41 | ,36 | ,33 | ,30 | ,24 | ,24 | ,25 | ,28 | ,37 | ||
| (11) Proceedings | ,44 | ,11 | ,16 | ,26 | ,43 | ,54 | ,17 | ,24 | ,40 | ,36 | ,41 | ,36 | ,26 | |||
| (17) Acquired rights | ,11 | ,07 | ,26 | ,39 | ,42 | ,08 | ,09 | ,17 | ,19 | ,27 | ,09 | ,06 | ||||
| (19) Predictable hours | ,42 | ,20 | ,24 | ,18 | ,38 | ,33 | ,24 | ,38 | ,31 | ,24 | ,36 | |||||
| (20) Free time | ,15 | ,31 | ,22 | ,45 | ,37 | ,30 | ,26 | ,26 | ,22 | ,36 | ||||||
| (23) Stability | ,47 | ,30 | ,31 | ,17 | ,07 | 17 | ,19 | ,10 | ,02 | |||||||
| (24) Career plan | ,56 | ,33 | ,32 | ,19 | ,24 | ,20 | ,30 | ,17 | ||||||||
| (25) Trainings | ,32 | ,31 | ,42 | ,38 | ,40 | ,30 | ,20 | |||||||||
| (30) Goals | ,52 | ,46 | ,40 | ,40 | ,22 | ,40 | ||||||||||
| (33) Relatability / social goals | ,67 | ,61 | ,51 | ,52 | ,40 | |||||||||||
| (34) Internal image | ,78 | ,70 | ,58 | ,42 | ||||||||||||
| (35) External image | ,72 | ,64 | ,36 | |||||||||||||
| (36) Responsibilities | ,55 | ,27 | ||||||||||||||
| (37) Students’ interest | ,25 |
Source: Authors’ elaboration.
VARIABLES OF THE RELATIONSHIP ITEM
The relationship item lists 12 variables that have shown positive correlation coefficients amongst themselves and with the “Happy” variable (Table 4). Among them, the ones that can be highlighted due to their degree of association with the “Happy” variable (self-perception of happiness at work) are: “Privacy” (0,48), “Socio-emotional support” (0,44), “Freedom of expression” (0,42), “Acceptance of one’s ideas” (0,42) and “Hierarchical relationships” (0,40). On the other hand, there are also pairs of variables that share a strong association between themselves, for instance: “Participation in the decisions about goals” (0,62) and “Data flux” (0,83); “Hierarchical relationships” and “Participation in the decisions about goals” (0,62); “Treatment equality” and “Participation in the decisions about goals” (0,60); “Absence of prejudices” and “Treatment equality” (0,75); “Recognition of work accomplishments” and “Treatment equality” (0,68); “Interpersonal relationships” and “Recognition of work accomplishments” (0,61). It is important to observe that the strong association between some pairs of variables of the scale could be the reason to its decrease due to the continuity of one the variables of the pair.
TABLE 4 PEARSON CORRELATION COEFFICIENTS REGARDING THE VARIABLES OF THE RELATIONSHIP ITEM OF THE OBJECTIVE WORK DIMENSION AND THE “HAPPY” VARIABLE
| Variáveis: item Relacional | 15 | 16 | 18 | 21 | 22 | 26 | 27 | 28 | 29 | 31 | 32 | Happy |
| (14) Freedom of expression | ,71 | ,42 | ,40 | ,48 | ,55 | ,46 | ,49 | ,56 | ,45 | ,48 | ,45 | ,42 |
| (15) Acceptance of one’s ideas | ,57 | ,47 | ,42 | ,50 | ,55 | ,57 | ,58 | ,60 | ,62 | ,62 | ,42 | |
| (16) Collective work | ,21 | ,45 | ,49 | ,43 | ,48 | ,36 | ,46 | ,65 | ,70 | ,35 | ||
| (18) Privacy | ,36 | ,42 | ,34 | ,42 | ,46 | ,47 | ,26 | ,27 | ,48 | |||
| (21) Interpersonal relationships | ,61 | ,41 | ,55 | ,51 | ,36 | ,41 | ,30 | ,30 | ||||
| (22) Recognition of work accomplishments | ,56 | ,68 | ,64 | ,60 | ,56 | ,50 | ,38 | |||||
| (26) Absence of prejudices | ,75 | ,69 | ,62 | ,58 | ,51 | ,36 | ||||||
| (27) Treatment equality | ,82 | ,75 | ,60 | ,57 | ,39 | |||||||
| (28) Hierarchical relationships | ,77 | ,62 | ,51 | ,40 | ||||||||
| (29) Socio-emotional support | ,58 | ,56 | ,44 | |||||||||
| (31) Participation in the decision about goals | ,83 | ,31 | ||||||||||
| (32) Data flux | ,25 |
Source: Authors’ elaboration.
PRINCIPAL COMPONENTS ANALYSIS (PCA)
The Principal Components Analysis (PCA) is used to investigate wide arrange of data (GENZ; BRETZ, 2009). In this article, an expressive number of variables is present and this hampers the perception of tendencies; as such, the PCA allows one to identify similar sampling groups and uncover which variables make a group dissimilar to another.
The first step is to simplify this data by transforming the original variables into a smaller number of “main components”, given a linear transformation into a determinate set of pieces of data which possess numerical values.
This linear transformation is translated into the following equation:
The equation resets this data conglomerate to a new system of coordinates in such a way that its most significative fluctuation is uncovered in the first coordinate and each subsequent coordinate shall be orthogonally compared to the previous one and it will fluctuate less. This way, a set of x variables correlated to y samples will transform into a set of principal components non-correlated upon the same samples (HUSSON et al., 2012). Correlated studies utilizing PCA and Well-being are Collie et al. (2015); Demo and Paschoal (2016); Li and Mark (2018).
Using the wide range of data collected throughout the research, this analysis has investigated the main aspects of the 4 sets of variables (infrastructural, labor activity, socioeconomic and relationship) which make out the analysis model of the teacher well-being. The PCA method identifies the variables that show a higher proportion of fluctuation in comparison to the others, indicating which principal components (PCs) raise the well-being level.
The 4 investigated groups contain 37 variables and the Kayser-Meyer-Olkin (KMO) test for sampling adequacy was applied, equating 0,88 by software R, and Barlett’s test of sphericity presented a significative result (p<0,001), which renders the sample adequate by the PCA.
The analysis devolves upon 4 variables, concerning the infrastructural group of variables, and the results presented 1 aspect with the eigenvalue greater than 1, portraying 67,82% of the total fluctuation. However, the graphical analysis contained in Figure 2 suggests that the two first components, which take up 85% of the fluctuation combined, would be the most relevant, meaning, of greater importance to the PC1 and PC2 with higher charges. Table 5 presents the results:
TABLE 5 PCA RESULTS - INFRASTRUCTURAL ITEM
| PC1 | PC2 | PC3 | PC4 | |
| Standard deviation | 1,6471 | 0,8249 | 0,6387 | 0,4458 |
| Fluctuation rate | 0,6782 | 0,1701 | 0,1020 | 0,0497 |
| Cumulative rate | 0,6782 | 0,8483 | 0,9503 | 1,0000 |
Source: Authors’ elaboration.
Components PC1 and PC2 present a revealed fluctuation rate superior than the others, culminating in the main variables for the well-being composition in the infrastructural group. Adequate facilities / general infrastructural conditions and pedagogical tools / equipment / materials positively contribute to the analyzed well-being. Figure 2 presents the results graphically:
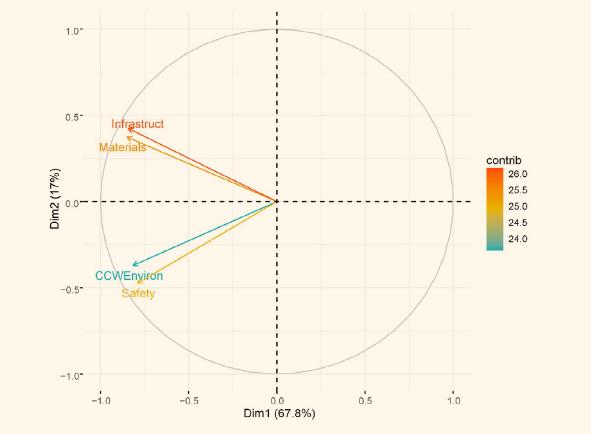
Source: Authors’ elaboration.
FIGURE 2 GRAPHICAL REPRESENTATION OF THE PRINCIPAL COMPONENTS OF THE VARIABLES OF THE INFRASTRUCTURAL ITEM AND ITS CONTRIBUTIONS
So as to analyze the labor activity aspect, 5 variables were investigated and results show that the components PC1 and PC2 comprise more than 82% of the total fluctuation above the others, being 70,42% and 12,60% respectively (Table 6). The results presented 1 component with its eigenvalue greater than 1, and following the procedures of Moro et al. (2019) and Teixeira et al. (2007), the two main components were utilized.
TABLE 6 PCA RESULTS - LABOR ACTIVITY ITEM
| PC1 | PC2 | PC3 | PC4 | PC5 | |
| Standard Deviation | 1,8764 | 0,7936 | 0,5644 | 0,5292 | 0,5008 |
| Fluctuation rate | 0,7042 | 0,1260 | 0,0637 | 0,0560 | 0,0502 |
| Cumulative rate | 0,7042 | 0,8301 | 0,8938 | 0,9498 | 1,0000 |
Source: Authors’ elaboration.
Figure 3 presents the results graphically:
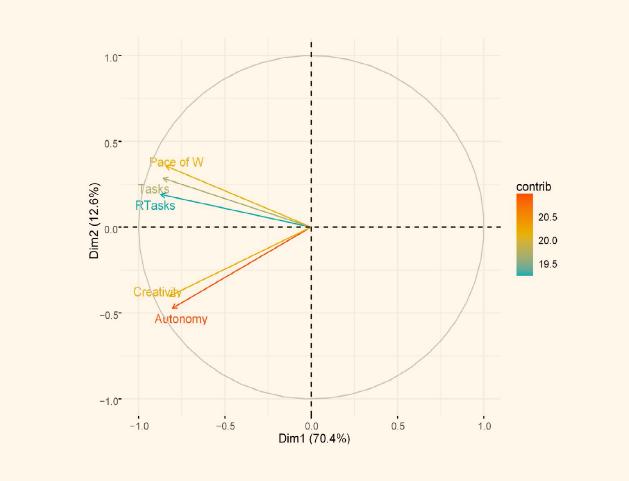
Source: Authors’ elaboration.
FIGURE 3 GRAPHICAL REPRESENTATION OF THE PRINCIPAL COMPONENTS AND THE VARIABLES OF THE LABOR ACTIVITY ITEM
Pace of work and Task diversity were the variables with greater contribution to the well-being amongst the others; however, Relatability to the accomplished tasks also presented a positive contribution, even with its low intensity to the well-being formation.
The socioeconomic aspect lists 16 variables and is the largest analyzed group. In this group there are 4 eigenvalues greater than 1, and it denotes 68,86% of the total fluctuation while the last dimension only holds 0,90%. As the analysis table has become too extended, the analysis will devolve upon the PCA graphic. Figure 4 presents the main components in such a way that the Internal image of the school and the educational system, the External image of the school and educational system, the Relatability to the education objectives, the Working hours, the School’s communal/social responsibilities and the Students’ level of interest are the most important variables, as the sum of their PC1 and PC2 result, respectively, are 39,22% and 12,79% of the total fluctuation.
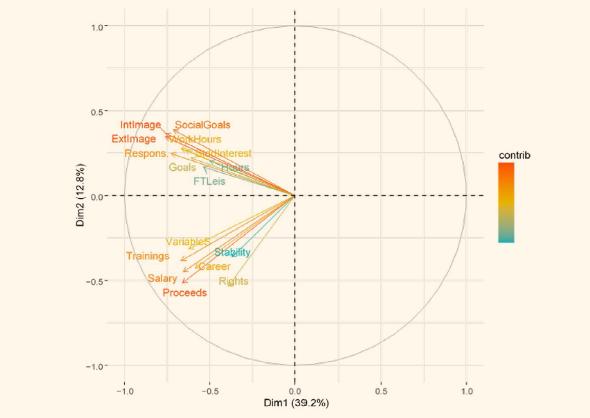
Source: Authors’ elaboration.
FIGURE 4 GRAPHIC PRESENTATION OF THE PRINCIPAL COMPONENTS OF THE VARIABLES OF THE SOCIOECONOMIC ITEM
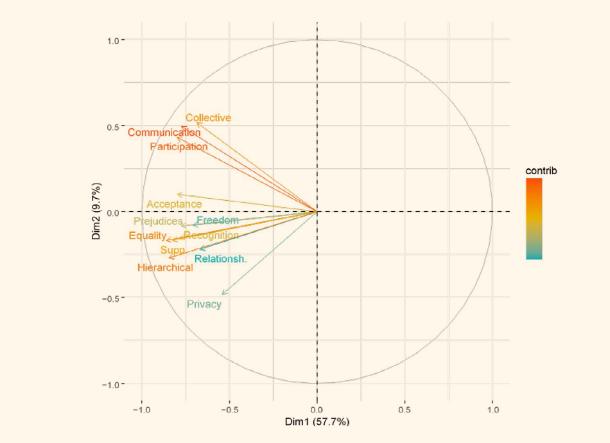
The relationship aspect lists 12 variables. In this group there are 2 eigenvalues greater than 1 and they represent 57,7% and 9,7% of the total fluctuation, respectively, with a cumulative fluctuation rate of 67,4%. Figure 5 present the relationship variables:
Source: Authors’ elaboration.
FIGURE 5 GRAPHIC PRESENTATION OF THE PRINCIPAL COMPONENTS AND OF THE VARIABLES OF THE RELATIONSHIP ITEM
The items Data flux/means of communication, Participation in the goals/objectives/strategies decisions, Collective work/groups of work/ideas Exchange and Repercussion/acceptance of one’s ideas had important contributions to the well-being when in relation to the group’s remaining variables.
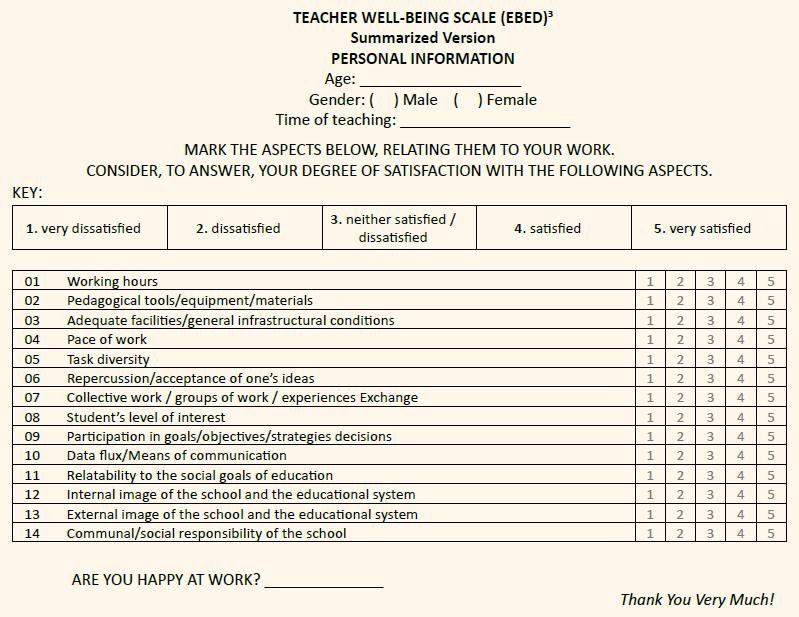
The Principal Components Analysis reveals that the variables that contributed the most to the well-being were: (01) Working hours; (02) Adequate facilities and general infrastructure conditions; (03) Pedagogical tools / equipment / materials; (04) Pace of work; (05) Task diversity; (06) Internal image of the school and of the educational system; (07) External image of the school and of the educational system; (08) Relatability to the social goals of education; (09) Students’ interest levels; (10) Communal/social responsibilities of the school; (11) Data flux / means of communication; (12) Participation in goals / objectives / strategies decisions; (13) Collective work / groups of work / ideas exchange; (14) Repercussion / acceptance of one’s ideas.
Following Teixeira et al. (2007) analysis regarding psychometrical approach, the items communality by group were calculated, and in the first group, infrastructural, there was a 0,78 to 0,99 range, there was a 0,79 to 0,98 range in the labor activity group, a 0,31 to 0,82 range in the socioeconomic and a 0,47 to 0,85 range in the relationship group, the non-exclusion of an items was opted due to the fact that all items presented a high relevancy to the analysis and their ranges were greater than 0,30 as per indicated by the authors.
With the results as basis, the Teacher Well-being Scale (Ebed) is proposed in two versions: the complete version (Chart 2), with 37 variables, taking into consideration that, in by applying the Pearson coefficient, all variables have a positive and meaningful correlation to the “Happy” variable, estabilishing that the analyzed items both contribute and are valid to measure well-being; and the summarized version (Chart 3), with 14 variables, identified using the Principal Component Analysis (PCA) as the variables that most contribute to the well-being.
CONCLUSIONS
The questions related to well-being, happiness and quality of work life, conjoined with the drive to better comprehend the positive aspects that make the human life a worthy experience to be lived, which in its turn determine and inform one’s pleasurable relationships (with oneself, with another, with the environment) have been rising in a multitude of sciences which can be verified by the rising number of publications regarding happiness, well-being and quality of life (in 1973, the term “happiness” is included in the Psychological Abstracts; in 1974, the Social Indicators Research: an international and interdisciplinary Journal of Quality of life journal was created; in 2000, the Journal of Happiness Studies was created, among other examples).
Regarding teaching works, Hargreaves and Fullan (2000) highlight the importance to identify the sources of both satisfaction and well-being to become suitable to the “teacher encouragement”, in such a way as to help the confrontation of the natural hardships in the teaching experience. It is to be believed that the satisfaction and dissatisfaction variables made explicit by the teachers when they answer the Ebed can offer tools so as the significance of the school, the teaching labor and the teacher’s role can be done in a more coherent perspective when taking the contemporary society’s needs into consideration.
It is important to highlight, however, that, when applied in schools to help planning and implementing development measures, the management must take into account both variables evaluated as satisfactory, so they contribute to the teacher well-being, as dissatisfactory, taking into consideration that the well-being, when manifested, is not in any way a permanent state of affairs nor constant harmony, satisfaction, happiness or achievement, due to life simply not working that way and the needs, expectancies and wishes are not always satisfied to their fullest. It is not possible to think about living in as state of total absence of negative cognitive and emotional states; consequently, in analyzing Ebed results, the dissatisfactory variables pointed out by teachers, which are potential malaise generators, must be target of interventions by both the school management and educational systems.

