


Servicios Personalizados
Revista

Articulo
 texto en
  Inglés (pdf)
 Articulo en XML
 Enviar articulo por email
Compartir

 Permalink
Cadernos de Pesquisa
versión impresa ISSN 0100-1574versión On-line ISSN 1980-5314
Cad. Pesqui. vol.50 no.177 São Paulo jul./sept 2020 Epub 20-Oct-2020
https://doi.org/10.1590/198053146700
ARTICLES
FAMILY BACKGROUND, RETURNS TO EDUCATION AND RACIAL INEQUALITY IN BRAZIL

IUniversidade Federal de São Paulo (Unifesp), Osasco (SP), Brazil; daniela.vaz@unifesp.br
This paper analyzes the effect of family background on earnings from labor and on returns to education in Brazil, comparing results from white and black workers. We estimate earnings equations using cross-sectional data from the 1996 and 2014 National Household Sample Survey (Pnad/IBGE); parents’ education is used as a proxy for family background. Our findings show that having a university degree significantly increases labor earnings, but less so for the blacks. Although the diploma effect and the racial wage gap decreased over the 1996-2014 period, there was no decrease in the influence of family background on individuals’ performance in the job market.
Key words: EDUCATION; RACE; FAMILY; SOCIAL INEQUALITY
Este trabalho analisa o efeito do background familiar sobre os rendimentos do trabalho e sobre os retornos da escolaridade no Brasil, comparando os resultados obtidos por brancos e negros. São estimadas equações de rendimento com dados de 1996 e 2014 da Pesquisa Nacional por Amostra de Domicílios (Pnad/IBGE), adotando- -se a escolaridade dos pais do trabalhador como proxy de seu background familiar. Os resultados mostram que ter um diploma universitário tem efeito pronunciado sobre os rendimentos, porém em menor magnitude para os negros. Entre 1996 e 2014, apesar de ter ocorrido uma diminuição do efeito diploma, bem como do diferencial salarial entre brancos e negros, não houve redução da importância do background familiar para o desempenho dos indivíduos no mercado de trabalho.
Palavras-Chave: EDUCAÇÃO; RAÇA; FAMÍLIA; DESIGUALDADE SOCIAL
Este artículo analiza el efecto del background familiar sobre los ingresos laborales y las tasas de rendimiento de la escolaridad en Brasil, comparando los resultados obtenidos por blancos y negros. Se calculan ecuaciones de salarios con datos de 1996 y 2014 de la Pesquisa Nacional por Amostra de Domicílios (Pnad/IBGE), adoptándose la escolaridad de los padres del trabajador como proxy de su contexto familiar. Se verificó que el hecho de poseer un diploma universitario ocasiona efectos pronunciados sobre la remuneración, pero con menor magnitud en el caso de los negros. Entre 1996 y 2014, a pesar de observarse la disminución del efecto diploma, así como la diferencia salarial entre blancos y negros, no hubo reducción de la importancia del background familiar para el desempeño de los individuos en el mercado laboral.
Palabras-clave: EDUCACIÓN; RAZA; FAMILIA; DESIGUALDAD SOCIAL
Cet article examine l’effet du contexte familial sur les revenus de travail et sur le aux rendement de l’éducation au Brésil, dans la comparaison des résultats des travailleurs noirs et blancs. À cette fin, des équations de revenus sont estimées a partir des données de la Pesquisa Nacional por Amostra de Domicílios (Pnad/IBGE). La scolarisation des parents est utilisée comme proxy du contexte familial. Les résultats montrent que le diplôme universitaire augmente substantiellement les rémunérations, bien que de façon moins prononcée chez les travailleurs noirs. Entre 1996 et 2014, malgré la chute dans l’effet diplôme ainsi que dans l’écart de salaires entre blancs et noirs, l’importance du contexte familial sur la performance des individus au marché du travail n’a pas décliné.
Key words: ÉDUCATION; RACE; FAMILLE; INEGALITÉ SOCIALE
Economic theory holds that the pace of human capital accumulation can influence a country’s economic growth (MINCER, 1958; SCHULTZ, 1964; BECKER, 1964). Supposedly, education - considered the cornerstone of human capital investments - would make it easier for workers to absorb new technologies, thus increasing labor productivity and, consequently, their income level. The increase in the population’s education level would reduce the wage gap between workers, as well as regional disparities, thereby contributing to reduce socioeconomic inequality.
Intergenerational mobility has been related to this theoretical framework by several authors, including Solon (2004). In his model, the degree of mobility decreases with the effectiveness of private investment in human capital and its return, and increases with progressive public investment in education.
Low-status families’ upward educational mobility would supposedly increase the supply of skilled workers, which would reduce the return to higher education and thus contribute to reduce socioeconomic inequalities. On the other hand, increased income inequality would cause greater disparity in human capital investment between rich and poor families, and, therefore, more intergenerational persistence (BECKER; TOMES, 1979).
Among the Brazilian job market’s features that make it quite unequal is the low degree of intergenerational income and education mobility, which makes children of the poor more likely to reproduce their parents’ education and income levels, while the wealthier and more educated usually manage to pass on their status to subsequent generations. Given this intergenerational persistence, inequality levels are maintained over time (LAM, 1999).
In the intergenerational upward mobility process, family background plays a critical role. Understood as the set of factors related to family structure that affect an individual’s performance in school and, later, in the job market, it is classified by Silva and Hasenbalg (2002) into three dimensions: economic capital, which concerns the material resources the family possesses and that facilitate its children’s learning; cultural capital, which consists in the distribution of education among adult family members and indicates the child’s cognitive environment; and social capital, which refers to the resources available to the child through the physical presence of adults in the family and the attention they give her/him.
In the national literature, there is broad empirical evidence about the effects of the various dimensions of family on the educational outcomes of school-age individuals.1 As for the effect of family background on labor earnings, it has been analyzed, though not frequently, due to constraints to surveys capturing information about both the worker and her/his parents. The most recent study on the subject at the national level used data from the 1996 National Household Sample Survey (Pnad), which featured a supplement with questions about the interviewee’s parents when the interviewee was 15 years old.
In the last few decades, the Brazilian job market scenario has changed as the stock of skilled labor increased. The supply of workers with a university degree grew at a higher rate during the 2000’s, while the group with complete secondary education underwent an inflection since the late 1990’s (IPEA, 2013). This educational expansion was accompanied by growth in affirmative action policies in higher education, which were intended to increase access for discriminated and socioeconomically excluded groups. As a result, disparities in the amount of formal education received by whites and blacks2 have decrease, but are still from being eliminated.
The educational advancement of the black population, however, does not translate into elimination of racial inequalities regarding labor earnings, because even when they advance in the educational system, blacks have more difficulty converting schooling into income. This is so, on the one hand, because they are at a disadvantage compared to whites in terms of access to quality education and to the cultural background that will mediate their socialization process. On the other hand, because even when they manage to overcome those disadvantages, they are excluded from social networks that would otherwise allow them to rise to the most prestigious positions in the job market.
Although the purpose of education is not limited to the economic returns that may result from it, this article will analyze this dimension of schooling. The goal of this paper is, therefore, to analyze the effect of family background - particularly parents’ education - on labor earnings and on returns to education in Brazil by comparing the results achieved by whites and blacks; to that end, we use earnings equations estimated using Pnad data. It is worth noting that, after many years without addressing the issue, the 2014 Pnad once again featured a socio-occupational mobility supplement. Given the changes in the Brazilian job market and the consequent difference between the 1996 and 2014 Pnad samples, a study with more recent data is justified in order to check whether the expansion of education for the population has brought about a decrease in the effect of family background on individuals’ performance in the job market, and, consequently, of social stratification between whites and blacks in the country.
The study is organized as follows: the second section addresses the recent behavior of returns to education in Brazil and the mechanisms through which, according to the literature, family educational structure can affect the income of individuals in the job market. In the third section, the disadvantages experienced by blacks in their financial accomplishment process are emphasized. The fourth and fifth sections present the methodology and database, respectively. After that, the estimations’ main results and are presented, and finally, the study’s conclusions.
EDUCATIONAL EXPANSION, RETURNS TO EDUCATION AND FAMILY BACKGROUND
The international literature shows that returns to education in developing countries may differ from those seen in developed nations due to a wide range of factors, including a more restricted access to schooling. Thus, the increase in labor earnings resulting from an additional education year is greater in low- and middle-income countries compared to developed economies, due to the lower supply of skilled labor in these countries. Evidence in this respect has been provided by Psacharopoulos (1973, 1981). More recently, Montenegro and Patrinos (2014) analyzed data from 139 economies for the 1970-2013 period and found a 10% average wage premium for each additional education year. Considering only the latest estimate available for each analyzed country, the global average wage premium was 9.7%, but the figure was significantly higher in sub-Saharan Africa (12.4%) and Latin America (9.2%), and below average in Eastern Europe (7.4%) and in Southern Asia (7.7%), thus corroborating Psacharopoulos’ previous findings. Intertemporal analysis revealed a decline in wage premiums since the 1980’s, when they were about 13.3%, along with the expansion of global average schooling, which rose from 6.6 to 11.6 years.
With regard specifically to university-educated labor, while its supply has increased in recent decades, so has demand, driven by the emergence of new information and communication technologies that require workers to have complementary skills to such technologies, especially abstract, multilevel and non-cognitive skills. In the United States, the wage premium for completing higher education compared to high school completion has systematically increased over the past three decades, which is attributed to the increase in the relative demand for skilled workers at a higher rate than its supply (GOLDIN; KATZ, 2007, OREOPOULOS; PETRONIJEVIC, 2013).
Among the specific features of the Brazilian job market that should be considered in analyzing the economic returns to education is the low percentage of adults with higher education. According to data from the Organization for Economic Cooperation and Development (OECD), 14.8% of the Brazilian population aged 25 to 64 years have completed a university program. By way of comparison, considering countries with a similar development level, 20.5% of Argentina’s adult population have a college degree, while in Chile this percentage is nearly 22.5%. The average for OECD countries, considering data from 2016 or later, is 35.7% (OCDE, 2018).
This scenario of a population with a low percentage of skilled workers results in high rates of return to education. In the 1980’s and 1990’s, for example, the wage premium for urban male workers with a college degree, compared to those with complete secondary education, was 56.5% in Argentina and 60.6% in Mexico, compared to 130.9% in Brazil (MANACORDA; SANCHEZ-PARAMO; SCHADY, 2010).
It is worth noting, however, that similarly to global tendencies, wage differentials between education levels have been declining in Brazil in recent years (IPEA, 2013; DAVANZO; FERRO, 2016). From 2001 to 2012, the returns obtained per additional education year in the country’s urban areas decreased from 11% to 8.9% among women, and from 11.5% to 8.8% among men (DAVANZO; FERRO, 2016).
The decline in returns to education is associated, to a large extent, with the expansion in the supply of schooled labor over the past few decades, an expansion evidenced by increased enrollment rates. With regard to higher education, for example, the gross enrollment rate - given by the ratio between the total number of enrolled students, regardless of age, and the population aged 18 to 24 years old - jumped from 15.1% to 32.1% in the 2001-2014 period (OLIVEIRA, 2017). Oliveira (2017) notes that, according to Martin Trow’s (2007) classification, since 2012, the Brazilian higher education system would supposedly have ceased to be an elite system to become a mass system in an embryonic stage.
The educational expansion experienced in Brazil in the last decades means that the people entering the job market today have been socialized by parents and adults who are more educated than those of previous generations. This fact is critical for analyzing and understanding the effect of family background - especially parents’ education - on labor earnings in Brazil.
Family education structure can affect individuals’ income in the job market through direct and indirect mechanisms. Family factors can, for example, influence the performance of the family’s children in the job market by capturing unobservable (or hardly measurable) attributes of the worker, thus acting as proxies for these attributes. More educated parents can, for example, provide higher quality education for their children. There is a number of potential reasons for this: (i) because more educated individuals usually earn higher wages, they can afford more goods and services for their children’s learning; (ii) more educated parents usually have a similarly educated partner, which enhances the effect of family structure; (iii) more educated parents are able to provide a family environment that is more conducive to studies and reflection and, therefore, to absorbing knowledge; and (iv) more educated parents tend to have fewer children, thus allowing them to invest more attention and resources in each child’s education (CURRIE; MORETTI, 2003; SCHULTZ, 1988).
In the national empirical literature, some authors have tested these influence channels. Lam and Schoeni (1993) found evidence that family background in Brazil has substantial effects on individual labor earnings. Using data from the 1982 Pnad, these authors showed that the wage of workers whose parents had university education was 20% higher than those whose parents were illiterate, and 9% higher than workers whose parents had completed basic education (four years’ schooling), while controlling for the worker’s own education. In addition, the inclusion of variables related to family background in the income equation reduced the estimates of returns to education by a quarter to a third.
Reis and Ramos (2011) used the 1996 Pnad supplement with information on individuals’ parents to analyze the relationship between family education structure and the distribution of labor earnings in Brazil. Through counterfactual simulations, the authors found that if all workers had their education financially rewarded in the same way as those with more educated mothers - i.e., mothers who completed at least eight years’ schooling -, then earnings would increase by an average 6%, and labor earnings inequality would decrease - Theil’s L, for example, would drop from 0.554 to 0.520. On the other hand, if there were no differences in workers’ educational distribution, i.e., if all of them had the same educational distribution as the workers whose mothers completed the highest education levels, labor earnings would increase, on average, by almost 70% compared to the original distribution, and Theil’s T would drop from 0.574 to 0.460.
UNEQUAL OPPORTUNITIES AND WAGE DIFFERENTIALS BY RACE
Although the educational expansion seen in recent decades has affected both whites and blacks, affirmative action policies implemented since the 2000’s have contributed to reduce racial disparities in education. Artes and Ricoldi (2015) compared the proportion of blacks in Brazilian higher education before and after the increase in affirmative action policies by analyzing microdata from the 2000 and 2010 Demographic Censuses. They found a significant increase in rates of access to undergraduate programs, with a great racial difference: the percentage of blacks attending undergraduate programs soared by 290.7% from 2000 to 2010, while that of whites increased by 73.7% in the same period. Indeed, while in 2000 there were four whites for one black in undergraduate programs, that difference decreased to two whites for each black in 2010.
The progressive reduction of racial disparities in access to education, however, does not mean we are moving towards the elimination of wage inequality between whites and blacks in the job market. The reason for this is that blacks have a lower income than white workers, even when both have the same education level, and even when controlling for other observable individual characteristics - such as professional experience, industry, occupation and region of residence. Evidence in this regard has been found by Augusto, Roselino and Ferro (2015), Campante, Crespo and Leite (2004), Zucchi and Hoffmann (2004), Soares (2000), Cavalieri and Fernandes (1998), among others.
The causes of the wage gap between whites and blacks transcend the so-called pure wage discrimination - which leads to different wages being paid to equally qualified individuals performing the same roles. As Gonzalez and Hansebalg (1982, p. 98) point out, blacks face “a competitive disadvantage in every stage of the individual social mobility process”. When they progress in the educational system, they face greater difficulties converting the same education levels into income as they find themselves at a disadvantage compared to whites in terms of access to quality education. Another disadvantage concerns social capital, which is represented by the network of contacts that allows converting educational qualification into income.
According to the model developed by Montgomery (1991), families’ social network, formed by acquaintances, friends and relatives, can play an important role in getting jobs due to the existing asymmetry of information in the job market, which makes it impossible for the employer to correctly identify each worker’s productivity. Thus, firms can resort to informal labor selection methods, such as the recommendation of candidates by their most skilled employees - who, in turn, tend to indicate colleagues with similar characteristics to their own. Thus, according to the author, human capital is not the only determinant of access to jobs, since workers’ relational capital can also play an important role. “Well-connected” individuals, i.e., those with contacts in higher-rank positions, tend to get jobs with higher wages, while the opposite is likely for those without good connections.
According to Rocha (2015), the advantages of an influential social capital are usually associated with being a white male, and this mediates part of the racial inequality in the job market. According to the authors, because blacks, on average, come from families with few economic and social resources, they have a social capital deficit, which can reduce their professional opportunities, particularly the possibility of rising to better-paid jobs. Thus, ultimately, family background, through its influence on social bonds established throughout life, can be an additional determinant of individuals’ income in the job market.
METHODOLOGIAL PROCEDURE
This study’s methodology to estimate returns to schooling is based on an extended version of the Mincerian wage equation. In its original formulation, Mincer’s (1974) model represented the natural logarithm of wages (W) as a linear function of the worker’s years of schooling (S), plus a quadratic term referring to his experience (E) in the job market:
where β, δ and γ are the regression coefficients, α is the model’s intercept and µ is a random error component.
This specification was theoretically based on the so-called human capital theory, according to which investments in human capital aimed at increasing workers’ productivity and, consequently, their income, are seen mainly in younger individuals, although they continue to occur practically throughout their working life (BECKER, 1964). Their returns, however, are decrescent, and become smaller as individuals making them become more experienced.
From a statistical point of view, however, this specification had three potential problems: (a) the regression coefficients’ bias, caused by the omission of relevant variables to determine labor earnings; (b) the non-linearity of the wage-schooling relationship; and (c) the endogeneity of the schooling variable, since this factor is likely associated with unobserved characteristics of the worker.
Over time, the first problem has been avoided through the use of controls for factors that are known to affect individuals’ labor earnings, such as position characteristics and regional and industry differences in productivity. Thus, over the years and in order to adapt to the particularities of the job market analyzed here, the Mincerian equation has been extended to incorporate a wide range of covariables that aim to at least substantially reduce the bias caused by omitted variables.
The non-linearity between the logarithm of wages and schooling was identified from observations that the effect of an additional education year on labor earnings was more pronounced when it coincided with completion of a school cycle. Known as the “diploma effect”,3 this phenomenon was empirically identified for Brazil by authors such as Ramos and Vieira (1996) and Crespo and Reis (2009). Thus, the literature established the nonlinear treatment of the wage-schooling relationship through the use of binary variables to capture the effect of schooling, instead of treating it as a cardinal variable.
Finally, the schooling variable’s endogeneity stems from unobservable - or hardly measurable - factors positively correlated with the worker’s schooling. In particular, individuals from higher social classes are likely to reach higher levels of schooling and earn higher wages, which could result in biased estimates of the rate of return to education. In this study, the procedure to mitigate the schooling variable’s endogeneity is based on Lam and Schoeni (1993), who include parents’ education as a control for family background. According to these authors, family background works as a proxy for unobservable variables that affect individual labor earnings.
DATABASE AND SELECTED VARIABLES
For this study, the National Household Sample Survey (Pnad) was used, which was carried out by the Brazilian Institute of Geography and Statistics (IBGE) until 2015 and discontinued after that year. The Pnad investigated, on a regular basis, general characteristics of the population, as well as information on migration, education, work, income, fertility and housing. In addition, the survey included, with variable frequency, supplementary questions about health, food security, internet access, among other topics that were included according to the need for information.
The 1996 and 2014 Pnad included, exceptionally, a supplement administered to a portion of the original survey sample; that supplement was aimed at capturing information related to interviewees’ socio-occupational mobility. In 1996, it was administered to individuals aged 15 years or older who were the household reference person or spouse, and, in 2014, to a person in the household aged 16 years or older selected at random.
Thus, the universe of analysis considered in this study comprises male individuals targeted by the Pnad mobility supplements and who, additionally, were aged 16 years or older, economically active and had an occupation during the survey reference week, with positive labor earnings. The age group considered takes into account that the minimum age for entering the Brazilian job market is 16 years old - according to article 403 of Law n. 10,097 (BRASIL, 2000). Women’s exclusion from the sample, as in Lam and Schoeni (1993), was deemed necessary due to differences in the determinants of female and male participation in the job market. In addition, the literature points out that returns to schooling, as well as the effects of family background on labor earnings, can vary according to gender. Since this study focuses on racial differentials, and not on gender issues, such gender-related intersections were avoided in the analysis.
The model’s dependent variable was obtained by dividing the monthly labor income for the main job by the number of working hours, which was obtained by multiplying the weekly working hours declared for that job by four. The resulting value, which corresponds to earnings per hour, was considered in the logarithmic scale.
The explanatory variables, which are listed in Chart 1 below, are based on the national and international empirical literature on wage structure, and they seek to explain the variability in earnings caused by: i) the heterogeneity of workers with regard to their productive (education level and professional experience) and demographic (color) characteristics; ii) industry and regional differences in the job market; and iii) jobs’ different characteristics.
It should be noted that from 2002 onwards, the Pnad adopted the Brazilian Classification of Occupations-Household (CBO-Domiciliar), which is an adaptation of the Brazilian Classification of Occupations (CBO) to household surveys. The nature of the differences between CBO-Domiciliar and the classification of occupations used until 2001 makes it impossible to recompose, even at the most aggregate level, the groups of occupations built for the dissemination of Pnad results from 2002 onwards. Thus, in order to ensure comparability between the results obtained for the 1996 and 2014 Pnad, no controls were used for occupational grouping in the earnings equations analyzed in this study. It should be noted that this control was also omitted in Lam and Schoeni (1993) and Reis and Ramos (2011), who worked, respectively, with data from the 1982 and 1996 Pnad.
Among the mobility characteristics investigated by the 1996 Pnad was the education level of the father and mother. In 2014, this question was refined to refer not necessarily to the parents, but to the man and woman actually raising and cohabiting with the interviewee when he was 15 years old. Thus, based on that information, two binary variables were created to capture whether the father (for the 1996 Pnad), or the man raising and cohabiting with the interviewee (for the 2014 Pnad), had completed secondary education and higher education. Equivalent variables were designed to capture the level of education of the mother or woman raising the interviewee. These variables, which are described in Chart 1, were adopted as proxies for family background. Alternative specifications of the earnings equation were estimated including either the father’s or the mother’s education, and both.
CHART 1 EARNINGS EQUATIONS’ EXPLANATORY VARIABLES
| Analyzed attribute | Variables used | Variables’ names |
|---|---|---|
| Schooling | Three binary variables designed to distinguish individuals with no education or incomplete primary education (basic category), those with complete primary education, those with complete secondary education and those with a higher education degree. | primary, secondary and higher |
| Father’s schooling | Three binary variables to identify the education level of the father (or the man raising the interviewee): no education or incomplete primary education (basic category), complete primary education, complete secondary education and complete higher education. | father_prim father_secnd father_highr |
| Mother’s schooling | Three binary variables to identify the education level of the mother (or the woman raising the interviewee): no education or incomplete primary education (basic category), complete primary education, complete secondary education and complete higher education. | mother_prim mother_secnd mother_highr |
| Professional experience | The age declared by the person, used as a proxy for his experience in the job market and measured in tens of years to avoid too small estimated coefficients. | age |
| The person’s age-squared (age measured in tens of years), since the effect of age on the earnings logarithm is not linear, with productivity likely to decline after a certain age. | age2 | |
| Color | A binary variable to distinguish black (black or brown) from non-black (white or yellow - basic category) individuals. The self-declared indigenous were excluded from the sample for being too few. | black |
| Designation in the family | A binary variable for the person’s designation in the family, i.e., one for household reference person and zero for spouse, children and others. | head |
| Region | Four binary variables to distinguish Brazil’s five regions: North, Northeast (basic category), South, Southeast and Central-west. | north, southeast, south and central-west |
| Household location | Two binary variables for the household’s location: household located in a metropolitan area, household located in a non-metropolitan urban area (basic category) and household located in a non-metropolitan rural area. | metrop rural |
| Industry | Two binary variables to distinguish three industries in which the main job may be: agriculture, industry and services (basic category). | agriculture industry |
| Position in occupation | Three binary variables to distinguish four possible positions in the main job’s occupation in the survey reference week: (1) employee without a formal contract (including domestic worker); (2) self-employed or producing for their own consumption/making for their own use; (3) employer; (4) employee with a formal contract (including domestic worker), civil servant or member of the military (basic category). | no_contract self_empl employer |
| Union membership | A binary variable for whether the person is a member of a trade union. | union |
Source: Prepared by the author.
Finally, it should be noted that as of 2004, the Pnad was expanded to cover the whole country, since until then no information was collected on rural areas in the states of Rondônia, Acre, Amazonas, Roraima, Pará and Amapá. Thus, for purposes of comparability with 1996, the information referring to 2014 was filtered to represent the survey’s geographic coverage until 2003. Additionally, individuals with missing information of relevance to the analysis were excluded from the sample. After applying these filters, a sample of 38,700 individuals was obtained for 1996 and 9,960 individuals for 2014, which, expanded according to the weights provided by the survey,4 correspond to 18,700,556 and 27,408,034 people, respectively.
RESULTS AND DISCUSSION
Table 1 shows the results of the regressions for the logarithm of earnings per working hour. All models were estimated using the least squares method and include controls for professional experience, designation in the family, region, household location, industry, position in occupation and union membership, as described in Chart 1. The coefficients commented on throughout this section are highlighted.
Regressions (1) to (5) refer to 2014. Besides the aforementioned controls, Model (1) includes binary variables for the worker’s schooling and to indicate whether he is black. In line with the literature’s findings, the estimated coefficients indicate that there is a wage premium associated with completion of school cycles that is greater the higher the education level achieved. In addition, holding all else constant, a lower return of [exp (−0.1122) −1]·100 = 10.61% was found for blacks.
TABLE 1 REGRESSIONS BY LEAST SQUARES OF THE LOGARITHM OF EARNINGS PER HOUR IN THE MAIN JOB FOR WORKERS AGED 16 OR OLDER - BRAZIL, 2014
| Model | (1) | (2) | (3) | (4) | (5) |
|---|---|---|---|---|---|
| primary | 0.2137*** | 0.1819*** | 0.1710*** | 0.1735*** | 0.1685*** |
| (0.0235) | (0.0341) | (0.0341) | (0.0342) | (0.0342) | |
| secondary | 0.4004*** | 0.4109*** | 0.3629*** | 0.3621*** | 0.3492*** |
| (0.0207) | (0.0308) | (0.0311) | (0.0312) | (0.0312) | |
| higher | 1.2247*** | 1.2894*** | 1.1557*** | 1.1801*** | 1.1320*** |
| (0.0327) | (0.0413) | (0.0428) | (0.0418) | (0.0427) | |
| black | -0.1122*** | -0.0921*** | -0.0873*** | -0.0826*** | -0.0833*** |
| (0.0172) | (0.0313) | (0.0315) | (0.0313) | (0.0314) | |
| primary· black | 0.0646 | 0.0727 | 0.0663 | 0.0715 | |
| (0.0444) | (0.0444) | (0.0443) | (0.0443) | ||
| secondary·black | -0.0162 | 0.0034 | -0.0010 | 0.0060 | |
| (0.0397) | (0.0399) | (0.0398) | (0.0398) | ||
| higher·black | -0.2134*** | -0.1748*** | -0.1997*** | -0.1777*** | |
| (0.0598) | (0.0577) | (0.0580) | (0.0574) | ||
| father_prim | 0.1288*** | 0.0887*** | |||
| (0.0294) | (0.0308) | ||||
| father_secnd | 0.2013*** | 0.1258*** | |||
| (0.0257) | (0.0286) | ||||
| father_highr | 0.3606*** | 0.2695*** | |||
| (0.0404) | (0.0457) | ||||
| mother_prim | 0.1301*** | 0.0826*** | |||
| (0.0235) | (0.0249) | ||||
| mother_secnd | 0.2331*** | 0.1476*** | |||
| (0.0264) | (0.0292) | ||||
| mother_highr | 0.2711*** | 0.1321*** | |||
| (0.0402) | (0.0449) | ||||
| age | 0.2656*** | 0.2688*** | 0.3169*** | 0.3260*** | 0.3350*** |
| (0.0346) | (0.0344) | (0.0344) | (0.0346) | (0.0344) | |
| age2 | -0.0204*** | -0.0207*** | -0.0249*** | -0.0254*** | -0.0263*** |
| (0.0042) | (0.0041) | (0.0041) | (0.0041) | (0.0041) | |
| head | 0.1528*** | 0.1536*** | 0.1585*** | 0.1610*** | 0.1614*** |
| (0.0172) | (0.0172) | (0.0170) | (0.0171) | (0.0170) | |
| north | 0.2159*** | 0.2165*** | 0.2156*** | 0.2068*** | 0.2100*** |
| (0.0322) | (0.0322) | (0.0322) | (0.0320) | (0.0321) | |
| southeast | 0.3091*** | 0.3079*** | 0.3059*** | 0.3082*** | 0.3063*** |
| (0.0214) | (0.0213) | (0.0211) | (0.0211) | (0.0210) | |
| south | 0.3396*** | 0.3401*** | 0.3456*** | 0.3498*** | 0.3495*** |
| (0.0240) | (0.0239) | (0.0237) | (0.0236) | (0.0236) | |
| central-west | 0.4462*** | 0.4462*** | 0.4375*** | 0.4400*** | 0.4361*** |
| (0.0297) | (0.0298) | (0.0301) | (0.0296) | (0.0300) | |
| metrop | 0.1295*** | 0.1291*** | 0.1062*** | 0.1151*** | 0.1046*** |
| (0.0185) | (0.0184) | (0.0180) | (0.0179) | (0.0179) | |
| rural | -0.1610*** | -0.1591*** | -0.1433*** | -0.1432*** | -0.1392*** |
| (0.0344) | (0.0343) | (0.0342) | (0.0344) | (0.0343) | |
| agriculture | -0.2941*** | -0.2967*** | -0.2880*** | -0.2849*** | -0.2838*** |
| (0.0381) | (0.0381) | (0.0377) | (0.0379) | (0.0377) | |
| industry | 0.0527*** | 0.0511*** | 0.0633*** | 0.0673*** | 0.0688*** |
| (0.0183) | (0.0183) | (0.0181) | (0.0183) | (0.0181) | |
| no_contract | -0.0991*** | -0.0983*** | -0.0977*** | -0.0983*** | -0.0979*** |
| (0.0229) | (0.0230) | (0.0229) | (0.0229) | (0.0229) | |
| self_empl | -0.0320 | -0.0316 | -0.0344 | -0.0396* | -0.0382 |
| (0.0236) | (0.0234) | (0.0233) | (0.0233) | (0.0233) | |
| employer | 0.4944*** | 0.4940*** | 0.4748*** | 0.4776*** | 0.4702*** |
| (0.0458) | (0.0457) | (0.0447) | (0.0444) | (0.0442) | |
| union | 0.0732*** | 0.0743*** | 0.0726*** | 0.0726*** | 0.0719*** |
| (0.0208) | (0.0207) | (0.0205) | (0.0205) | (0.0205) | |
| constant | 0.8285*** | 0.8101*** | 0.6670*** | 0.6278*** | 0.6062*** |
| (0.0716) | (0.0728) | (0.0731) | (0.0736) | (0.0734) | |
| Observations | 9,960 | 9,960 | 9,960 | 9,960 | 9,960 |
| R2 | 0.4294 | 0.4312 | 0.4411 | 0.4398 | 0.4433 |
| F-test - (2) | 6.78*** | ||||
| F-test - (3) | 40.89*** | ||||
| F-test - (4) | 37.87*** | ||||
| F-test - (5) | 25.81*** |
Source: Prepared by the author based on 2014 Pnad microdata.
Notes: (i) robust standard errors are shown in parentheses; (ii) ***, ** and * denote the statistically significant coefficients at 1%, 5% and 10%, respectively; (iii) in addition to the sample weights (v32039), the structure of the Pnad sampling plan was incorporated into the estimates through variables v4617 and v4618; (iv) F-test - (2): the coefficients associated with the primary·black, secondary·black and higher·black interactions are simultaneously null; F-test - (3): the coefficients associated with father_prim, father_secnd and father_highr are simultaneously null; F-test - (4): the coefficients associated with mother_prim, mother_secnd and mother_highr are simultaneously null; F-test - (5): coefficients associated with father_prim, father_secnd, father_highr, mother_prim, mother_secnd and mother_highr are simultaneously null.
In model (2), the effect of color on earnings in the job market can be due both to differences in level - i.e., due to the existence of a constant wage differential between whites and blacks - and to differences in returns to education for both groups. The former effect is captured by the black variable, while the latter is represented by interactions between this variable and the binary ones for worker schooling. It should be noted that, at the 1% significance level, the hypothesis of joint nullity of interactions can be refuted. This result indicates that, indeed, the effect of schooling on labor earnings is different for whites and blacks. However, considering the individual statistical significance of each interaction, only the return to higher education differs between both color categories. Thus, even though blacks earn lower wages than whites for all education levels - an effect that is captured by the black binary variable - this gap widens with regard to the most qualified workers: completion of higher education, holding all else constant, increases blacks’ earnings by [exp(1.2894 - 0.2134) - 1] · 100 = 193.29%, and non-blacks’ earnings by [exp(1.2894) - 1] · 100 = 263.06% in relation to individuals with no education or incomplete primary education. Moreover, when the interactions between return to education and color are incorporated into the model, the coefficient associated with black is reduced in relation to the result in column (1), i.e., the effect decreases from 10.61% to 8.80%. This shows that part of the effect that used to be attributed to the difference in level between the earnings of blacks and non-blacks is, in reality, due to the fact that blacks’ higher education is remunerated differently than that of non-blacks.
The reasons why blacks earn, holding all else constant, lower wages and lower returns to higher education include wage discrimination itself, but also differences in the quality of education, as well as in professional reach. In particular, as indicated in the literature review, blacks in Brazil face greater difficulties rising to the most prestigious positions in the job market due to a deficit in social capital. As a consequence, they tend to face greater difficulties converting their schooling into earnings. In order to capture these effects, in columns (3), (4) and (5), the model incorporates controls for family background by using the education of the father, the mother or both. Such controls work as proxies for the worker’s socioeconomic background, which affects both education quality and financial accomplishment opportunities.
In column (3), binary variables are added which capture the father’s different education levels. The F-test for the hypothesis of joint nullity of the coefficients associated with this new block of variables is statistically significant at the level of 1%, thus showing the pertinence of incorporating it into the model. In addition, the coefficients are also significant at the individual level. The father’s education level is found to positively affect individuals’ earnings, and this effect is greater the higher the school cycle considered: the earnings of individuals whose father completed primary education are, on average, [exp(0.1288) −1]·100 = 13.75% higher than those of workers whose parents did not complete even that school cycle, holding the worker’s own education, his color and the other controls in the model constant. For individuals whose parents completed secondary education, the earnings differential in relation to the group with parents without primary education is [exp(0.2013) −1]·100 = 22.30%. Finally, being from a family where the father completed higher education raises labor earnings, on average, by [exp(0.3606) − 1]·100 = 43.42%, holding all else constant.
In column (4), the mother’s education level is used as a proxy for family background, instead of the father’s. The effect of the mother’s schooling on earnings is found to be greater than that of the father’s schooling when it comes to primary and secondary education. On the other hand, the effect of a higher education degree on the son’s earnings is greater when it is held by the father than by the mother.
In the literature, many studies have sought to explain the differences in the effect of the mother’s and father’s schooling on children’s school performance - which, in turn, will influence their future performance in the job market. The mother’s schooling would have a predominantly direct effect on individuals’ educational reach and quality, due to mothers’ presence, assistance and supervision concerning schooling. On the other hand, the father’s schooling would have a greater indirect effect, through his influence on the family’s socioeconomic level and, consequently, on decisions regarding the children’s education. In particular, a father with a university degree would be more likely to have the means to release his children from the job market and provide them with access to education. Such differences in effects are explained by the sexual division of labor, which assigns most of the responsibilities for the daily care of children to women, while men are assigned the role of providers.
Finally, in column (5), both father’s and mother’s schooling are adopted as proxies for family background. The F-test for the hypothesis of joint nullity of all coefficients associated with the binary variables for the education of both father and mother was statistically significant at 1%. From an individual point of view, moreover, it is possible to refute the null hypothesis of each of these coefficients. Finally, when comparing the values obtained for the models’ determination coefficient (R2), this specification is found to be the one with greatest explanatory power. Therefore, this model will be adopted as a reference for purposes of comparison with 1996, in the next section. When the results of this specification are contrasted with that in column (1), the use of controls for family background is found to reduce the wage premiums associated with completion of school cycles. Thus, we can see that part of this premium was due, in reality, to the mediating effect of family resources on the quality of the education received by children and also on their opportunities in the job market.
Graph 1 below summarizes the differences in the premium associated with completion of university education by comparing models (2), (3), (4) and (5). The return to higher education for blacks is 193.3% when no control is used for family background - according to specification (2) -, and 159.7% when both the father’s and mother’s education are controlled - according to regression (5). As for non-blacks, these effects are much higher, i.e., 263.1% and 210.2%, respectively.
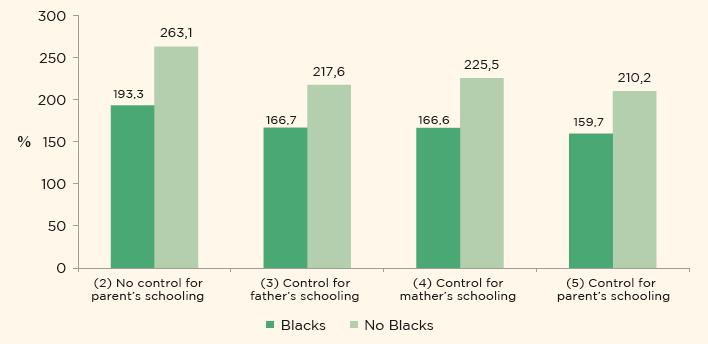
Source: Prepared by the author based on 2014 Pnad microdata.
GRAPH 1 WAGE GAP (IN PERCENTAGES) BETWEEN AN INDIVIDUAL WITH A UNIVERSITY DEGREE AND AN INDIVIDUAL WHO DID NOT COMPLETE PRIMARY SCHOOL, CONSIDERING MODELS WITH AND WITHOUT CONTROL FOR THE FAMILY BACKGROUND
Not only can family background directly contribute to individual earnings, but it can also interfere with performance in the job market through its interrelation with the worker’s own education level. In other words, the worker’s return to education can vary depending on his parents’ education level. Thus, in order to address this effect, earnings equations were estimated which incorporate interactions between the binary variables for the father’s schooling and the worker’s own schooling, which, for simplicity’s sake, was treated in a cardinal way in this model variant, ranging from 0 (for a person with no education or less than 1 year of schooling) to 14 (for a person with 14 years’ schooling) and 17 for those with 15 or more years’ schooling. In addition, considering the evidence in Table 1 that the return to schooling is different for whites and blacks, in this specification the model was estimated separately for both groups. The results are shown in Table 2. Graph 2 below was designed based on the results of these estimations and shows the behavior of earnings per hour according to the worker’s years of schooling; the basic category of binary variables was adopted, with an individual’s age equal to the sample’s average. As can be seen, regardless of the individual’s color, his earnings for the same education level are higher if his father has secondary education, instead of incomplete primary education. In addition, that difference widens as the worker’s education level increases. Although the same behavior is observed for blacks, their earnings are systematically below those earned by non-blacks in a similar situation regarding their own schooling and that of their father.
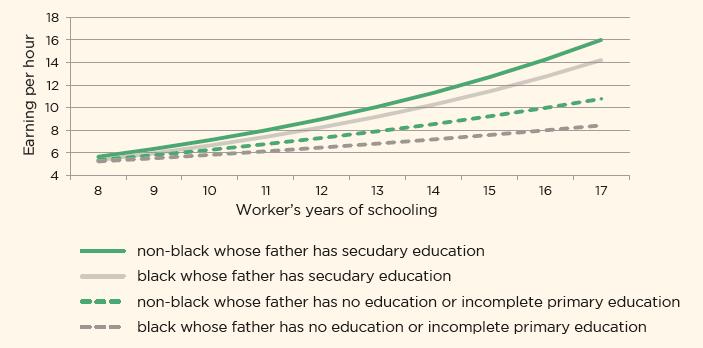
Source: Prepared by the author based on 2014 Pnad microdata.
Note: (i) the estimation admits a worker who is not the household reference person, lives in a non-metropolitan urban area in the Northeast region, is employed in the services industry, has a formal employment contract and is a union member; (ii) the average age for blacks is 37.76, and for non-blacks, 39.58 years; (iii) the models were estimated separately for blacks and non-blacks.
GRAPH 2 EARNINGS PER HOUR, IN R$ IN SEPTEMBER 2014, ACCORDING TO THE WORKER’S YEARS OF SCHOOLING - BRAZIL, 2014
TABLE 2 LEAST SQUARES REGRESSIONS OF THE LOGARITHM OF EARNINGS PER HOUR IN THE MAIN JOB FOR WORKERS AGED 16 OR OLDER - BRAZIL, 2014
| Non-blacks | Black | |||||
|---|---|---|---|---|---|---|
| Coef. | Robust standard error | Coef. | Robust standard error | |||
| educ | 0.0776 | *** | 0.0042 | 0.0528 | *** | 0.0033 |
| father_prim | -0.1091 | 0.1256 | -0.0784 | 0.1162 | ||
| father_secnd | -0.2522 | ** | 0.1234 | -0.4220 | *** | 0.1407 |
| father_highr | -0.7753 | *** | 0.2102 | -0.0162 | 0.4940 | |
| educ_father_prim | 0.0201 | * | 0.0108 | 0.0231 | ** | 0.0100 |
| educ_father_secnd | 0.0381 | *** | 0.0097 | 0.0556 | *** | 0.0112 |
| educ_father_highr | 0.0839 | *** | 0.0146 | 0.0319 | 0.0331 | |
| age | 0.3307 | *** | 0.0500 | 0.3919 | *** | 0.0441 |
| age2 | -0.0203 | *** | 0.0059 | -0.0343 | *** | 0.0053 |
| head | 0.1704 | *** | 0.0242 | 0.1363 | *** | 0.0236 |
| north | 0.3458 | *** | 0.0767 | 0.1521 | *** | 0.0355 |
| southeast | 0.2989 | *** | 0.0374 | 0.2719 | *** | 0.0253 |
| south | 0.3191 | *** | 0.0380 | 0.3523 | *** | 0.0319 |
| central-west | 0.4055 | *** | 0.0498 | 0.4304 | *** | 0.0360 |
| metrop | 0.1143 | *** | 0.0262 | 0.0785 | *** | 0.0223 |
| rural | -0.1520 | *** | 0.0511 | -0.1081 | ** | 0.0455 |
| agriculture | -0.2129 | *** | 0.0638 | -0.2943 | *** | 0.0469 |
| industry | 0.0609 | ** | 0.0272 | 0.0514 | ** | 0.0223 |
| no_contract | -0.1107 | *** | 0.0367 | -0.0923 | *** | 0.0285 |
| self_empl | -0.0113 | 0.0334 | -0.0626 | ** | 0.0306 | |
| employer | 0.4596 | *** | 0.0544 | 0.4846 | *** | 0.0739 |
| union | 0.0901 | *** | 0.0310 | 0.0714 | *** | 0.0260 |
| constant | 0.1076 | 0.1117 | 0.3054 | *** | 0.0949 | |
| Observations | 4,876 | 5,084 | ||||
| R2 | 0.4385 | 0.3740 | ||||
Source: Prepared by the author based on 2014 Pnad microdata.
Notes: ***, ** and * denote the statistically significant coefficients at 1%, 5% and 10%, respectively.
COMPARISON BETWEEN 1996 AND 2014
In order to compare the results of the estimations obtained from the 1996 and 2014 Pnad samples, specification (5) - presented in Table 1 - was considered which incorporates both the father’s and mother’s schooling as proxies for family background. The results are shown in Table 3 below.
TABLE 3 LEAST SQUARES REGRESSIONS OF THE LOGARITHM OF EARNINGS PER HOUR IN THE MAIN JOB FOR WORKERS AGED 16 OR OLDER - BRAZIL, 1996/2014
| Model | 1996 | 2014 | ||||
|---|---|---|---|---|---|---|
| Coefficient | Robust standard error | Coefficient | Robust standard error | |||
| primary | 0.3694 | *** | 0.0214 | 0.1685 | *** | 0.0342 |
| secondary | 0.6614 | *** | 0.0161 | 0.3492 | *** | 0.0312 |
| higher | 1.2953 | *** | 0.0221 | 1.1320 | *** | 0.0427 |
| black | -0.2188 | *** | 0.0104 | -0.0833 | *** | 0.0314 |
| primary·black | 0.0077 | 0.0362 | 0.0715 | 0.0443 | ||
| secondary·black | 0.0390 | 0.0264 | 0.0060 | 0.0398 | ||
| higher·black | 0.0937 | ** | 0.0474 | -0.1777 | *** | 0.0574 |
| father_prim | 0.1145 | *** | 0.0258 | 0.0887 | *** | 0.0308 |
| father_secnd | 0.1565 | *** | 0.0275 | 0.1258 | *** | 0.0286 |
| father_highr | 0.2079 | *** | 0.0369 | 0.2695 | *** | 0.0457 |
| mother_prim | 0.1226 | *** | 0.0258 | 0.0826 | *** | 0.0249 |
| mother_secnd | 0.1631 | *** | 0.0284 | 0.1476 | *** | 0.0292 |
| mother_highr | 0.1127 | ** | 0.0501 | 0.1321 | *** | 0.0449 |
| age | 0.3705 | *** | 0.0220 | 0.3350 | *** | 0.0344 |
| age2 | -0.0389 | *** | 0.0026 | -0.0263 | *** | 0.0041 |
| head | 0.0982 | *** | 0.0290 | 0.1614 | *** | 0.0170 |
| north | 0.2723 | *** | 0.0197 | 0.2100 | *** | 0.0321 |
| southeast | 0.4014 | *** | 0.0114 | 0.3063 | *** | 0.0210 |
| south | 0.2860 | *** | 0.0137 | 0.3495 | *** | 0.0236 |
| central-west | 0.3749 | *** | 0.0146 | 0.4361 | *** | 0.0300 |
| metrop | 0.1512 | *** | 0.0098 | 0.1046 | *** | 0.0179 |
| rural | -0.1973 | *** | 0.0144 | -0.1392 | *** | 0.0343 |
| agriculture | -0.4931 | *** | 0.0152 | -0.2838 | *** | 0.0377 |
| industry | 0.0190 | ** | 0.0096 | 0.0688 | *** | 0.0181 |
| no_contract | -0.2116 | *** | 0.0117 | -0.0979 | *** | 0.0229 |
| self_empl | 0.0212 | ** | 0.0106 | -0.0382 | 0.0233 | |
| employer | 0.6507 | *** | 0.0207 | 0.4702 | *** | 0.0442 |
| union | 0.1637 | *** | 0.0106 | 0.0719 | *** | 0.0205 |
| constant | -0.5415 | *** | 0.0547 | 0.6062 | *** | 0.0734 |
| Observations | 38,700 | 9,960 | ||||
| R2 | 0.5222 | 0.4433 | ||||
Source: Prepared by the author based on 1996/2014 Pnad microdata.
Notes: ***, ** and * denote the statistically significant coefficients at 1%, 5% and 10%, respectively.
The effect of completion of a school cycle is found to significantly decrease from 1996 to 2014. The income increment resulting from completion of primary education, for example, was [exp (0.3694) −1] · 100 = 44.7% in 1996, and it declined to [exp (0.1685) −1] · 100 = 18.4% in 2014. The racial wage gap is also found to decrease for the period, with the wage gap between blacks and non-blacks dropping from [exp (−0.2188) −1] · 100 = −19.7% to [exp (−0.0833) −1] · 100 = −8.0%. Curiously, in 1996, the effect of holding a higher education degree in relation to individuals with no education was greater among blacks than among non-blacks. In 2014, the direction of this effect was reversed, with a greater wage gap between skilled and unskilled individuals being found among whites.
It is worth highlighting the fact that family background, in general, kept its relevance from 1996 to 2014. Even though, in the case of fathers and mothers with primary and secondary education, a decrease is found in the magnitude of the effects from 1996 and 2014, they remained positive and statistically significant. On the other hand, the effect that being the son of parents with higher education has on earnings increased in the period. For example, holding all else constant, having grown up in a family where the father had a university degree increased earnings, on average, by [exp (0.2079) −1] · 100 = 23.1% in 1996, and this effect rose to [exp (0.2695) −1] · 100 = 30.9% in 2014. This result suggests that the influence of workers’ socioeconomic background on their performance in the job market has not declined during the period.
FINAL CONSIDERATIONS
Supported by results of previous studies, this study focused on the effect of family background on labor earnings and on returns to education in Brazil. Its specific contribution consisted in analyzing more recent data on the subject - from the 2014 Pnad socio-occupational mobility supplement - and investigating the racial differences found in returns to education.
The main findings can be summarized in three points: (i) the diploma effect decreased from 1996 to 2014, concomitantly with the expansion of the education system - particularly higher education - in the country; (ii) the magnitude of returns to a university degree is lower for blacks, compared to whites; (iii) family background remained relevant to individuals’ performance in the job market. This last result may be associated with the mediating effect of workers’ socioeconomic background on the quality of education they receive and on the professional opportunities available to them by means of their social circle. The fact that there is a pronounced weight of family background to the conversion of education into income contributes to the maintenance of racial inequalities in earnings and, consequently, to the perpetuation of social stratification between whites and blacks in the country.
Finally, it should be noted that a universal education system, when it succeeds in promoting equal access to quality education, can mitigate the effect of students’ socioeconomic background on their individual performance, thereby reducing educational stratification and, therefore, inequalities in the job market.
ACKNOWLEDGEMENTS
I would like to thank Professor Rodolfo Hoffmann and the anonymous reviewers for their comments on a preliminary version of this paper. Any errors that remain are my sole responsibility.
REFERENCES
ARTES, Amélia; RICOLDI, Arlene Martinez. Acesso de negros no ensino superior: o que mudou entre 2000 e 2010. Cadernos de Pesquisa, São Paulo, v. 45, n. 158, p. 858-881, out./dez. 2015. Disponível em: http://www.scielo.br/pdf/cp/v45n158/1980-5314-cp-45-158-00858.pdf. Acesso em: 3 jun. 2019. [ Links ]
AUGUSTO, Natália; ROSELINO, José Eduardo; FERRO, Andrea Rodrigues. A evolução recente da desigualdade entre negros e brancos no mercado de trabalho das regiões metropolitanas do Brasil. Revista Pesquisa e Debate, São Paulo, v. 26, n. 2(48), p. 105-127, set. 2015. Disponível em: https://revistas.pucsp.br/rpe/article/view/23066/17600. Acesso em: 16 jun. 2019. [ Links ]
BARROS, Ricardo Paes de; MENDONÇA, Rosane; SANTOS, Daniel Domingues dos; QUINTAES, Giovani. Determinantes do desempenho educacional no Brasil. Pesquisa e Planejamento Econômico, Rio de Janeiro, v. 31, n. 1, abr. 2001. Disponível em: http://ppe.ipea.gov.br/index.php/ppe/article/viewFile/159/94. Acesso em: 16 jun. 2019. [ Links ]
BECKER, Gary S. Human capital: a theoretical and empirical analysis with special reference to education. New York: NBER/Columbia University Press, 1964. [ Links ]
BECKER, Gary S.; TOMES, Nigel. An equilibrium theory of the distribution of income and intergenerational mobility. Journal of Political Economy, Chicago, v. 87, n. 6, dez. 1979. [ Links ]
BRASIL. Lei n. 10.097, de 19 de dezembro de 2000. Altera dispositivos da Consolidação das Leis do Trabalho - CLT, aprovada pelo Decreto-Lei n. 5.452, de 1o de maio de 1943. Diário Oficial da União, Brasília, DF, 20 dez. 2000. [ Links ]
CAMPANTE, Filipe R.; CRESPO, Anna R. V.; LEITE, Phillippe G. P. G. Desigualdade salarial entre raças no mercado de trabalho urbano brasileiro: aspectos regionais. Revista Brasileira de Economia, Rio de Janeiro, v. 58, n. 2, p. 185-210, jun. 2004. Disponível em: http://www.scielo.br/pdf/rbe/v58n2/a03v58n2. Acesso em: 16 jun. 2019. [ Links ]
CAVALIERI, Claudia Helena; FERNANDES, Reynaldo. Diferenciais de salários por gênero e por cor: uma comparação entre as regiões metropolitanas brasileiras. Revista de Economia Política, v. 18, n. 1, p. 158-175, jan./mar. 1998. Disponível em: http://www.rep.org.br/PDF/69-10.PDF. Acesso em: 16 jun. 2019. [ Links ]
CRESPO, Anna; REIS, Mauricio Cortez. Sheepskin effects and the relationship between earnings and education: analyzing their evolution over time in Brazil. Revista Brasileira de Economia, Rio de Janeiro, v. 63, n. 3, p. 209-231, jul./set. 2009. Disponível em: http://bibliotecadigital.fgv.br/ojs/index.php/rbe/article/view/1017/954. Acesso em: 6 jun. 2019. [ Links ]
CURRIE, Janet; MORETTI, Enrico. Mother’s education and the intergenerational transmission of human capital: evidence from college openings. The Quarterly Journal of Economics, Oxford, v. 118, n. 4, p. 1495-1532, 2003. [ Links ]
DAVANZO, Eloá Sales; FERRO, Andrea Rodrigues. Retornos à educação: uma análise da redução do diferencial salarial por anos de estudo no Brasil no período de 2001 a 2012. In: ENCONTRO DE ECONOMIA DA REGIÃO SUL - ANPEC-SUL, 19., 2016, Florianópolis. Anais [...] Florianópolis: Universidade Federal de Santa Catarina, 2016. Disponível em: https://www.anpec.org.br/sul/2016/submissao/files_I/i2-c8df9b0eb400991c63fabcda38ea8713.pdf. Acesso em: 5 jun. 2019. [ Links ]
GOLDIN, Claudia; KATZ, Lawrence F. The race between education and technology: the evolution of U.S. educational wage differentials, 1890 to 2005. Cambridge, Mass.: National Bureau of Economic Research, mar. 2007. (Working Paper n. 12984). [ Links ]
GONZALEZ, Lélia; HASENBALG, Carlos Alfredo. Lugar de negro. Rio de Janeiro: Marco Zero, 1982. [ Links ]
INSTITUTO DE PESQUISA ECONÔMICA APLICADA - IPEA. Um retrato de duas décadas do mercado de trabalho brasileiro utilizando a Pnad. Comunicados do Ipea, n. 160, 31p., 7 out. 2013. Disponível em: http://repositorio.ipea.gov.br/bitstream/11058/3318/1/Comunicados_n160_Retrato.pdf. Acesso em: 11 jun. 2019. [ Links ]
LAM, David. Generating extreme inequality: schooling, earnings, and intergenerational transmission of human capital in South Africa and Brazil. Ann Arbor: University of Michigan, ago. 1999. 43p. (Population Studies Center Research Report n. 99-439). [ Links ]
LAM, David; SCHOENI, Robert F. Effects of family background on earnings and returns to schooling: evidence from Brazil. Journal of Political Economy, Chicago, v. 101, n. 4, p. 710-740, 1993. [ Links ]
MACHADO, Danielle Carusi; GONZAGA, Gustavo. O impacto dos fatores familiares sobre a defasagem idade-série de crianças no Brasil. Revista Brasileira de Economia, Rio de Janeiro, v. 61, n. 4, p. 449-476, 2007. Disponível em: http://www.scielo.br/pdf/rbe/v61n4/a02v61n4.pdf. Acesso em: 11 jun. 2019. [ Links ]
MANACORDA, Marco; SANCHEZ-PARAMO, Carolina; SCHADY, Norbert. Changes in returns to education in Latin America: the role of demand and supply of skills. Industrial and Labor Relations Review, v. 63, n. 2, Jan. 2010. Disponível em: http://personal.lse.ac.uk/manacorm/lac.pdf. Acesso em: 6 jun. 2019. [ Links ]
MINCER, Jacob. Investment in human capital and personal income distribution. Journal of Political Economy, Chicago, v. 66, n. 4, p. 281-302, 1958. [ Links ]
MINCER, Jacob. Schooling, experience and earnings. Massachusetts: National Bureau of Economic Research, 1974. [ Links ]
MONTENEGRO, Claudio E.; PATRINOS, Harry A. Comparable estimates of returns to schooling around the world. Washington: World Bank Group, 2014. (Policy Research Working Paper n. 7020). [ Links ]
MONTGOMERY, James D. Social networks and labor-market outcomes: toward an economic analysis. The American Economic Review, v. 81, n. 5, p. 1408-1418, dez. 1991. [ Links ]
OLIVEIRA, Lívio Luiz Soares de. Expansão de matrículas e massificação do ensino superior no Brasil. Carta de Conjuntura, FEE, ano 26, n. 11, 2017. Disponível em: http://carta.fee.tche.br/article-tags/taxa-bruta-de-matricula/. Acesso em: 5 jun. 2019. [ Links ]
OREOPOULOS, Philip; PETRONIJEVIC, Uros. Making college worth it: a review of the returns to higher education. The Future of Children, v. 23, n. 1, p. 41-65, 2013. [ Links ]
ORGANIZAÇÃO PARA A COOPERAÇÃO E DESENVOLVIMENTO ECONÔMICO - OCDE. Adult education level (indicator). 2018. Disponível em: https://doi.org/10.1787/36bce3fe-en. Acesso em: 15 ago. 2018. [ Links ]
PSACHAROPOULOS, George. Returns to education: an international comparison. Amsterdam, San Francisco: Elsevier and Jossey-Bass, 1973. [ Links ]
PSACHAROPOULOS, George. Returns to education: an updated international comparison. Comparative Education, v. 17, n. 3, p. 321-341, 1981. [ Links ]
RAMOS, Lauro; VIEIRA, Maria Lúcia. A relação entre educação e salários no Brasil. In: INSTITUTO DE PESQUISA ECONÔMICA APLICADA - IPEA. A economia brasileira em perspectiva 1996. v. II. Rio de Janeiro: Ipea, 1996. cap. 21. p. 493-510. [ Links ]
REIS, Mauricio Cortez; RAMOS, Lauro. Escolaridade dos pais, desempenho no mercado de trabalho e desigualdade de rendimentos. Revista Brasileira de Economia, Rio de Janeiro, v. 65, n. 2, p. 177-205, 2011. Disponível em: http://www.scielo.br/pdf/rbe/v65n2/a04v65n2.pdf. Acesso em: 5 jun. 2019. [ Links ]
RIANI, Juliana de Lucena Ruas; RIOS-NETO, Eduardo Luiz Gonçalves. Background familiar versus perfil escolar do município: qual possui maior impacto no resultado educacional dos alunos brasileiros? Revista Brasileira de Estudos da População, Rio de Janeiro, v. 25, n. 2, p. 251-269, 2008. Disponível em: http://www.scielo.br/pdf/rbepop/v25n2/v25n2a04.pdf. Acesso em: 11 jun. 2019. [ Links ]
RIOS-NETO, Eduardo L. G.; CÉSAR, Cibele Comini; RIANI, Juliana de Lucena Ruas. Estratificação educacional e progressão escolar por série no Brasil. Pesquisa e Planejamento Econômico, Rio de Janeiro, v. 32, n. 3, p. 395-415, dez. 2002. Disponível em: http://ppe.ipea.gov.br/index.php/ppe/article/viewFile/137/72. Acesso em: 5 jun. 2019. [ Links ]
ROCHA, Emerson Ferreira. O negro no mundo dos ricos: um estudo sobre a disparidade racial de riqueza no Brasil com os dados do Censo Demográfico de 2010. 2015. 193 f. Tese (Doutorado em Sociologia) - Instituto de Ciências Sociais, Universidade de Brasília, Brasília, 2015. [ Links ]
SCHULTZ, Theodore William. O valor econômico da educação. Rio de Janeiro: Zahar, 1964. [ Links ]
SCHULTZ, Theodore William. Education investment and returns. In: CHENEY, Hollis B.; SRINIVASAM, T. Handbook of development economics. Amsterdam: Elsevier, 1988. v. 1. Chapter 13, p. 543-630. [ Links ]
SILVA, Nelson do Valle; HASENBALG, Carlos. Recursos familiares e transições educacionais. Cadernos de Saúde Pública, Rio de Janeiro, v. 18 (Suplemento), p. 67-76, 2002. Disponível em: http://www.scielo.br/pdf/csp/v18s0/13794.pdf. Acesso em: 11 jun. 2019. [ Links ]
SILVA JÚNIOR, Luiz Honorato da; SAMPAIO, Yony. Qualidade da escola e background familiar na formação de capital humano no Brasil. Planejamento e Políticas Públicas, Recife, n. 45, p. 275-300, 2015. Disponível em: http://www.ipea.gov.br/ppp/index.php/PPP/article/view/486/378. Acesso em: 5 jun. 2019. [ Links ]
SOARES, Sergei Suarez Dillon. O perfil da discriminação no mercado de trabalho: homens negros, mulheres brancas e mulheres negras. Brasília: Ipea, nov. 2000. 26p. (Texto para Discussão n. 769). Disponível em: http://www.ipea.gov.br/pub/td/2000/td_0769.pdf. Acesso em: 10 jul. 2018. [ Links ]
SOLON, Gary. A model of intergenerational mobility variation over time and place. In: CORAK, Miles (ed.). Generational income mobility in North America and Europe. Cambridge: Cambridge University Press, 2004. p. 38-47. [ Links ]
SOUZA, André Portela de; PONCZEK, Vladimir Pinheiro; OLIVA, Bruno Teodoro; TAVARES, Priscilla Albuquerque. Fatores associados ao fluxo escolar no ingresso e ao longo do ensino médio no Brasil. Pesquisa e Planejamento Econômico, Rio de Janeiro, v. 42, n. 1, p. 5-39, abr. 2012. Disponível em: http://ppe.ipea.gov.br/index.php/ppe/article/viewFile/1322/1110. Acesso em: 11 jun. 2019. [ Links ]
TROW, Martin A. Reflections on the transition from elite to mass to universal access: forms and phases of higher education in modern societies since WWII. In: FOREST, James J. F.; ALTBACH, Philip G. (ed.) International handbook of higher education. Dordrecht: Springer, 2007. Cap. 13. p. 243-280. (Springer International Handbooks of Education, 18). [ Links ]
ZUCCHI, Juliana D.; HOFFMANN, Rodolfo. Diferenças de renda associadas à cor: Brasil, 2001. Revista Pesquisa e Debate, São Paulo, v. 15, n. 1(25), p. 107-129, 2004. [ Links ]
1See, e.g., Barros et al. (2001), Silva and Hasenbalg (2002), Rios-Neto, César and Riani (2002), Machado and Gonzaga (2007), Riani and Rios-Neto (2008), Souza et al. (2012) and Silva Júnior and Sampaio (2015).
2Throughout this study, people are considered black if they are self-declared black or brown in the Brazilian Institute of Geography and Statistics’ (IBGE) publications.
3From a theoretical point of view, this effect is backed by both sociologist Randall Collins’ Credentialism hypothesis and economist Michael Spence’s Signaling hypothesis. Although there are great differences between those, we will not discuss them further to avoid escaping the scope of this study.
Received: July 18, 2019; Accepted: May 11, 2020
 Este é um artigo publicado em acesso aberto sob uma licença Creative Commons
