


Serviços Personalizados
Journal

Artigo
 texto em
  Inglês (pdf)
 Artigo em XML
 Enviar este artigo por email
Compartilhar

 Permalink
Cadernos de Pesquisa
versão impressa ISSN 0100-1574versão On-line ISSN 1980-5314
Cad. Pesqui. vol.51 São Paulo 2021 Epub 19-Nov-2021
https://doi.org/10.1590/198053148400
HIGHER EDUCATION, PROFESSIONS, WORK
GENDER BIAS IN CAREER CHOICE IN BRAZIL

IUniversidade Federal de São Paulo (Unifesp), Osasco (SP), Brazil; maria.fernandapessoa5@gmail.com
IIUniversidade Federal de São Paulo (Unifesp), Osasco (SP), Brazil; daniela.vaz@unifesp.br
IIIMinistério da Economia, Brasília (DF), Brazil; diegocbotassio@gmail.com
This article analyzes sex segregation in in-person higher education programs in Brazil by investigating its causes, characteristics and evolution over time. To that end, synthetic indicators of segregation are calculated based on the 2000 and 2017 editions of the Censo da Educação Superior [Higher Education Census]. During this period, the decrease in the overall degree of segregation was subtle, as a result of two opposite movements: the reduction in the stratification of men and women between the major areas of knowledge, which is offset by increased segregation within them. Thus, at the most aggregate level of analysis, there is a tendency towards sex integration in the fields of study. However, when it comes to specific careers, gender stereotypes persist, with separation between typically “male” and “female” programs.
Key words: STEREOTYPES; GENDER RELATIONS; HIGHER EDUCATION; CAREER CHOICES
Este artigo analisa a segregação por sexo nos cursos presenciais de ensino superior brasileiro, investigando suas causas, características e evolução no tempo. Para tanto, são calculados indicadores sintéticos de segregação com base nas edições de 2000 e 2017 do Censo da Educação Superior. Nesse período, a queda no grau geral de segregação foi tímida e resultou de dois movimentos opostos: a redução da estratificação de homens e mulheres entre as grandes áreas de conhecimento, contrabalançada pelo aumento da segregação dentro delas. Assim, ao nível mais agregado de análise, há tendência à integração por sexo dos campos de estudo. Porém, em se tratando de carreiras específicas, persistem os estereótipos de gênero, com segmentação entre cursos tipicamente masculinos e femininos.
Palavras-Chave: ESTEREÓTIPO; RELAÇÕES DE GÊNERO; ENSINO SUPERIOR; ESCOLHA PROFISSIONAL
Este artículo analiza la segregación sexual en las carreras de graduación en modalidad presencial de la enseñanza superior en Brasil, investigando sus causas, características y evolución en el tiempo. Para eso son calculados índices sintéticos de segregación con datos de las ediciones de 2000 y 2017 del Censo de la Educación Superior. En este período la caída en el nivel general de segregación fue tímida y resultante de dos movimientos opuestos: la reducción de la estratificación de hombres y mujeres entre las grandes áreas del conocimiento, contrabalanceada por el aumento en la segregación dentro de esas ramas. Así, al nivel más agregado de análisis, hay una tendencia a la integración por sexo entre los campos de estudio. Sin embargo, cuando se trata de carreras específicas, persisten los estereotipos de género, con una segmentación entre las carreras típicamente masculinas y femeninas.
Palabras-clave: ESTEREOTIPO; RELACIONES DE GÉNERO; ENSEÑANZA SUPERIOR; ELECCIÓN PROFESSIONAL
Cet article analyse la ségrégation des sexes dans l’enseignement supérieur brésilien, tout en examinant ses causes, caractéristiques et son évolution dans le temps. À cette fin, des indicateurs synthétiques de ségrégation sont calculés en utilisant les éditions de 2000 et 2017 du Censo da Educação Superior [Recensement de l’Éducation Supérieure]. Dans cette période, la chute dans le degré général de ségrégation a été timide et a résulté de deux mouvements opposés: la réduction de la stratification des hommes et femmes entre les grands domaines du savoir, contrecarrée par l’incrément de la ségrégation dans ces domaines. Donc au niveau plus agrégé d’analyse, il y a une tendance à l’intégration par sexe des champs d’étude au niveau des carrières, les stéréotypes de genre perdurent, avec une segmentation entre les métiers typiquement masculins et féminins.
Key words: STEREOTYPES; RAPPORTS DE GENRE; ENSEIGNEMENT SUPÉRIEUR; CHOIX PROFESSIONNEL
In the last 20 years, there has been a considerable expansion in the number of students enrolled in higher education in Brazil, driven by federal government programs implemented in the first decade of the millennium which comprised an increased offer of enrollment slots in public universities, as well as scholarships and financing for students in private universities. Between 2000 and 2017, the number of students enrolled in in-person undergraduate programs increased by approximately 141%.
Although the path of women in higher education has been hindered by social conditions, there has been a reversion in the sex gap at this education level in recent decades (Beltrão & Alves, 2009; Alves, 1994; Beltrão & Teixeira, 2005). Universities, which previously formed an environment dominated almost exclusively by men, are now occupied mostly by women.
However, the increased female representation in the university environment did not mean equal representation in all programs, since there is a perpetuation of gender stereotypes which manifest, on the one hand, in female overrepresentation in programs related to education and care services, and on the other, in male predominance in programs that value logical thinking and competitiveness (Barreto, 2014; Beltrão & Teixeira, 2005).
The literature indicates that, in the job market, predominantly female occupations offer, on average, lower wages than those found in male occupations, even when controlling for the education level (Oliveira, 2003; Fresneda, 2007; Madalozzo, 2010). Thus, we can see that sex segregation in higher education has subsequent impacts, since it causes wage differences between men and women over their professional life.
The goal of this study is to investigate the segregation by sex in in-person higher education programs in Brazil, using intertemporal analyses and regional comparisons in order to examine the behavior of this phenomenon at the national level. We aim to determine, in particular, whether the degree of segregation has been decreasing during the analyzed period. To that end, we use microdata from the Higher Education Census conducted by the National Institute for Educational Studies and Research Anísio Teixeira (Inep) in order to calculate segregation measures, such as the Gini and dissimilarity indices. In addition to these traditional indicators, we used the square root index proposed by Hutchens (2001), which allows breaking down total segregation into two components: one referring to segregation between the areas of knowledge; and another corresponding to a weighted sum of the levels of segregation within these areas. For comparison purposes, the 2000 and 2017 editions of the Census were used.
Analyses about female representation in higher education programs in Brazil are not infrequent, however, they are based on calculation of the observed proportion of women for each knowledge area, or on particular careers. This type of analysis does not allow us to obtain a single value for the overall segregation observed in higher education in the country. The calculation of synthetic measures, which is already used in job market analyses, contributes to a deeper understanding of inequality in female representation in higher education programs. It is worth noting that no previous studies were found in the national literature that applied synthetic measures of segregation to data from the Higher Education Census, including comparisons between these measures and between results of its editions.
This work is organized in five sections, the first of which is this introduction. In the second section, we approach the contributions by the main authors on the subject. In the third section, we explain the data and the methodology. The fourth section presents the results and the analysis, and the fifth section discusses implications and future paths for this line of research.
Literature review
For centuries, the social construction of the relationship between genders resulted in two groups being formed with antagonistic and hierarchized features: women and men, the latter in a dominant position. The woman’s role was forged in the reproductive sphere, i.e., the household sphere, whereas extra-domestic activities - viewed as more prestigious - were dominated by men (Alves, 1994; Kergoat, 2009).
This led to what the literature recognizes as the sexual division of labor, i.e., a “sharing” of activities and tasks performed by men and women. According to Melo and Castilho (2009), domestic (or reproductive) work - which is not recognized as work by society - is largely considered the responsibility of women. On the other hand, according to the authors, productive work, which is actually recognized and paid by capital, has a greater male representation, as women’s entry into the labor market is a relatively recent phenomenon.
Historically, because men played the role of providers, acting in the productive sphere, they had greater access to formal education with a view to specialization in the job market, whereas women were taught to perform household chores and look after others - especially children - so as to play their role as mothers and wives. Thus, Brazilian education has always focused on men and disregarded women. This situation was clearly expressed in the gender gap in education, i.e., in the systematic educational differences between men and women (Beltrão & Alves, 2009).
In the 19th century the first basic education institutions for women emerged. They were, however, different from male ones in that their guidelines were based on strengthening the woman’s role as a mother and wife. Thus, from its origin, the Brazilian educational system was organized according to a gender-based duality and separation (Beltrão & Teixeira, 2005).
Even when they successfully completed basic education, women were faced with difficulties and barriers to entry into higher education, since although their admission to universities was made possible by an Imperial Decree of 1881, basic education programs did not make them eligible. According to data from the Brazilian Institute of Geography and Statistics (IBGE), the percentage of women enrolled in higher education between 1907 and 1912 was below 1.5% (Beltrão & Alves, 2009).
However, over the 20th century, women progressively gained ground in the Brazilian educational scenario. The National Educational Guidelines and Framework Law (LDB) of 1961 recognized the magistério1- attended by most women at the time - as equivalent to a secondary education program, thus making its graduates eligible to take a university admission test. The convergence between social transformations and the feminist movement’s struggle brought about, from the 1980s, a reversion in the gender gap in higher education, with women becoming the majority in it. This trend was strengthened by the changes that occurred in the New Republic, a period that saw an expansion of higher education (Beltrão & Alves, 2009).
However, although women are currently the majority of students in universities, a significant proportion of them is concentrated in programs related to care and education activities - such as Pedagogy, Nursing and Psychology -, which reflects their stereotyped role in society.
Common sense understands characteristics of rationality and competitiveness as pertaining to the male gender, whereas characteristics such as compassion, empathy and submission are considered essentially female (Barreto, 2014). These stereotypes shape the relationships of occupations and careers, since the most valued skills in the job market are the so-called male ones, and for family and home care activities, the characteristics considered female are more valued.
Thus, the social role assigned to women reflects on the professional activities they perform, which, as said earlier, are focused on care and education. The attributes that are culturally linked to the female gender inhibit their participation in more technical and scientific activities. Thus, women are excluded or exclude themselves from environments and professions associated with the male personality - viewed as stronger, more active and independent - and end up internalizing expectations about their role in society, thereby consolidating the division between male and female activities (Chabaud-Rychter & Gardey, 2009).
Studies in the field of Social Psychology reveal that primary education students tend to choose careers in which they believe they will be successful and not face many difficulties. An idea that is frequently disseminated is that the areas of Science, Technology, Engineering and Mathematics (STEM) are difficult and therefore should be occupied only by people considered brilliant - a quality associated with masculinity. There is also the belief that these areas are suitable for specific social groups, namely men of European descent. In addition, there is a cultural view that the people occupying these areas are introverted and not very physically attractive. The fact that girls often do not identify with these stereotypes hinders them from imagining themselves pursuing such careers, and causes them to have a negative perception about themselves; they become insecure in performing activities in mathematics and other exact sciences. Because they believe they are not able to perform well in exact sciences and will not have a successful career if they manage to attain a degree in these areas, they usually choose careers that are more aligned to female stereotypes (González-Pérez et al., 2020; Shin et al., 2016; Herrmann et al., 2016).
The internalization of these expectations and stereotypes can be exemplified by the study conducted by Queiroz et al. (2014) with female students at a public school. Using questionnaires that were answered by these students, the authors assembled a profile regarding preference for careers and disciplines taught in the Brazilian basic school curriculum. Based on this research, they conclude that the reaffirmation of gender stereotypes in the educational environment - such as the frequent statements that girls do not have an affinity with calculation - contributes to their internalizing the ideal that they are more apt for humanities programs than for technical and scientific ones, as they are often induced to believe that they lack the analytical ability required by the latter type.
In studying the different choices between boys and girls in the French educational system, Rapoport and Thilbout (2018) conclude that both sexes consider the expected returns in the job market when making educational choices. However, students’ perceptions about their achievement in assessments differ by sex. While boys usually consider good outcomes in tests of exact disciplines as an indication that they should pursue careers involving significant analytical ability, girls tend to underestimate such outcomes - even when they get good grades -, and they choose careers in humanities. According to the authors, a possible interpretation for this phenomenon concerns the perception girls usually have that they are less able than boys (just like boys usually perceive themselves as more able than girls), especially in exact and technological sciences.
Thus, although boys and girls have relatively equal access to education, their career choices are different, as girls choose mostly programs related to care and education, as well as humanities. These programs are viewed as less prestigious than mostly male ones and are usually associated with lower wages, which helps explain, in part, the wage differences between men and women in the job market (Beltrão & Teixeira, 2005).
In analyzing gender segregation from a job market perspective, Fresneda (2007) seeks to elucidate the wage difference between men and women through occupational segregation, which, according to the author, can be explained by the internalization of stereotypes, which induces women to pursue careers that are considered as more feminine. Using the 2004 edition of the National Household Sample Survey (PNAD), Fresneda (2007) shows that there are indeed careers occupied mostly by women, and that, on average, earnings in such careers are 63% of the wage/hour of male occupations. Among other findings, the study concludes that, in Brazil, women are concentrated in lower-pay occupations compared with men.
According to Madalozzo and Artes (2017, p. 1, own translation), “. . . one of the critical effects of the existence of occupational segregation is its impact on the different remuneration for men and women over their careers”.2 The authors analyze the profile of individuals who choose different careers, using microdata from the 2013 edition of the PNAD. To that end, occupations are grouped according to their sex composition, which results in three categories: female, in which women account for at least 60% of workers; male, i.e., men account for over 60%; and integrated, which has a relatively equal division between sexes. The study concludes that, on average, women’s remuneration is inferior to that of men. However, the impact on wage differences is reduced when women are in the traditional “imperial” professions (Law, Engineering and Medicine) and/or choose to work longer hours.
It should be noted that the phenomenon of sex occupational segregation and its consequent impact on remuneration is not restricted to Brazil. In analyzing the rise of women in the American labor market, Bergmann (2005) points out that, previously, the woman’s role in the economy consisted of domestic chores and the care of children, whereas men, who were responsible for financially supporting the home through paid work, did not participate in domestic chores. To the author, the differentiation between male and female activities is presented since childhood and absorbed by individuals as something natural. This notion that sex determines the activities to be performed by men or women is kept in adulthood and works as a means to reaffirm masculinity and femininity.
For centuries, American women were kept from productive activities. However, since the 19th century, they gradually came to participate in the workforce, and from the 1970s, those who sought paid work were the majority compared to those who kept an exclusive dedication to the home. In 1870, only 14% of working-age women were employed - most as housemaids or in low-wage factory jobs. In 2001, on the other hand, that proportion became 60%, and women were also occupying several other positions (Bergmann, 2005).
Still according to Bergmann (2005), although they have come to massively integrate the American workforce, women still suffer discrimination in the job market - although this was made illegal by the Civil Rights Act of 1964. Women continue to be excluded from professions predominantly occupied by men, and forced to resort to professions associated with typically female tasks. Such professions, however, offer a lower remuneration than those occupied by men. Because they believe they will not succeed in male-dominated fields, many women do not even try to join them. However, the women who manage to enter professions considered masculine face problems such as moral and sexual harassment, in addition to lower wages than those paid to men in the same position, and fewer promotion opportunities (Bergmann, 2005).
Therefore, as seen above, there is a relative consensus in the literature about sex occupational segregation. The literature also points out that the so-called female professions offer, on average, lower wages than male ones, which causes remuneration differences by sex in the job market. This study aims to deepen the analysis of the degree of sex segregation in Brazilian higher education by investigating its intertemporal behavior, as well as its regional differences. To that end, it relies on refined synthetic measures of the degree of segregation, which will be presented in the next section.
Material and methods
This study used microdata from the Higher Education Census conducted by the Inep. The census is an annual nationwide survey that investigates higher education institutions and collects information about their undergraduate programs and diploma courses, such as number of enrollment slots, entering students, graduates, technical and administrative staff members, among others.3
The analyzed data refer to students enrolled in in-person undergraduate programs in the 2017 and 2000 editions - the latter being the oldest edition that can be compared with the 2017 census with regard to the methods for classifying programs in fields and sub-fields of knowledge.
In the preliminary descriptive analysis, we identified the programs and fields with greatest and smallest female representation among the 20 programs with the greatest number of enrolled students. To that end, we calculated the Gender Parity Index (GPI), which is the ratio between the number of women and the number of men in a given program, such that if its result is below 1, there is disparity towards more men, and if it is above 1, there is disparity towards more women.
In order to analyze the degree of segregation itself, we used three traditional measures in the literature: the dissimilarity index (Jahn et al., 1947), the Gini index of segregation (Duncan & Duncan, 1955), and the square root index (Hutchens, 2001). The presentation that follows is based on Hoffmann et al. (2019), however, instead of occupational categories, we considered the various in-person undergraduate programs.
For a universe of n programs, M
i
and W
i
are, respectively, the number of men and of women in the ith program (i=1, . . . , n) . Thus, M and W indicate the total of men and women in the student population
Admitting that the programs are ordered according to the ascending values of GPI, such that W
1
/ M
1
≤ W
2
/ M
2
≤ ... ≤ W
n
/ M
n
, the accumulated proportions of men and women to the i th category are defined, respectively, as
For notation purposes, we can define
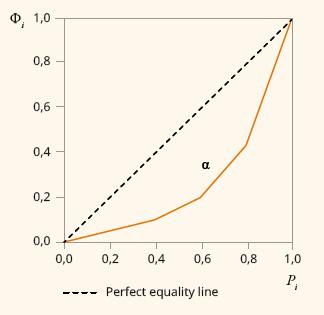
Source: Designed by the authors, based on Hoffmann et al. (2019, p. 307).
FIGURE 1 REPRESENTATION OF A HYPOTHETIC SEGREGATION CURVE
The Gini index of segregation is defined by the ratio between α and its maximum value, such that G s = α/0,5 = 2α. Thus, we can see that 0 ≤ G s ≤ 1. When the Gini is zero, there is no segregation, i.e., the proportion of women in the total of enrolled students is the same in every program. In the other extreme, when the Gini is 1, segregation is maximum, i.e., the programs are attended exclusively by men or by women. It is worth noting that, according to Hoffmann et al. (2019), this index can also be calculated by means of the expression below:
The dissimilarity index, proposed by Jahn et al. (1947) is no doubt the most used segregation measure in the literature. Its mathematical expression is
Among the advantages of using the dissimilarity index is that its value can be concretely interpreted, as it indicates the proportion of women and of men that should change programs so as to eliminate sex segregation (Anker, 1998, p. 75). One drawback, however, is that it is only sensitive to redistributions that involve the transition of a woman (man) from a predominantly female (male) program to another, predominantly male (female) one, and vice-versa. Therefore, it does not capture the decreasing effects on its value when a woman from a “female” program changes places with a man also from a “female” program which, however, has a smaller relative female representation. Thus, the Gini index has an advantage over the dissimilarity index, as it is sensitive to any change in the distribution that results in lower/higher segregation (Vaz & Hoffmann, 2011).
In addition to the Gini and dissimilarity indices, we also calculated the square root index proposed by Hutchens (2001):
Just like the Gini and dissimilarity indices, its lower limit is zero - the extreme case of no segregation - and its maximum value is one - extreme segregation.
An interesting property of the square root index is that it is additively decomposable, i.e., the (total) segregation can be decomposed into two parts: one related to segregation between groups of programs, and another that corresponds to the weighted sum of the measures of segregation within these groups. Let us consider that the n programs can be grouped in k groups. This classification of programs in groups must follow some preset similarity criterion, such that every program is classified in just one group. In this work, the similarity criterion is knowledge closeness between fields, and the groups correspond to the fields in the Inep/MEC classification, which is an adaptation of the International Standard Classification of Education (ISCED).
If I g indicates the segregation within the gth field (g = 1,..., k), and m g and w g are the shares of men and women from the gth field in the totals of each sex, respectively, then the additive decomposition of the square root index is:4
The term on the left side of equation (4) is the total segregation (measured at the program level). The first term on the right side of the expression is the segregation within the knowledge fields. This part is formed by the sum of the segregation measures within the fields (Ig), weighted by factors
In order to illustrate the properties of the presented indices, let us take as an example a hypothetic situation involving the distribution of students in four different programs in three times, according to Table 1 below.
TABLE 1 AN EXAMPLE OF A CHANGE IN THE DISTRIBUTION OF MEN AND WOMEN IN HIGHER EDUCATION PROGRAMS
| Program | Time 1 | Time 2 | Time 3 | ||||||
|---|---|---|---|---|---|---|---|---|---|
| Women | Men | GPI | Women | Men | GPI | Women | Men | GPI | |
| Civil Engineering | 2 | 6 | 0.33 | 3 | 6 | 0.50 | 3 | 6 | 0.50 |
| Law | 4 | 2 | 2.00 | 3 | 2 | 1.50 | 3 | 2 | 1.50 |
| Psychology | 7 | 3 | 2.33 | 7 | 3 | 2.33 | 5 | 3 | 1.67 |
| Pedagogy | 8 | 3 | 2.67 | 8 | 3 | 2.67 | 10 | 3 | 3.33 |
| Total of Students | 21 | 14 | 1.50 | 21 | 14 | 1.50 | 21 | 14 | 1.50 |
| Dissimilarity Index | 0,3333 | 0,2857 | 0.2857 | ||||||
| Gini Index | 0,3639 | 0,3367 | 0.3776 | ||||||
| Square Root Index | 0.0800 | 0.0567 | 0.0644 | ||||||
Source: Authors’ elaboration.
In time 1, only the Civil Engineering program has a sex disparity towards more men, with a GPI = 0.33, i.e., for every 3 men enrolled in Civil Engineering, there is one woman enrolled in this program. The other programs in the table show disparities towards more women, though to different degrees. The Pedagogy program is the most female one, with almost three women enrolled for each man. This program is followed by Psychology, with a GPI = 2.33, and Law, with a GPI = 2.00.
Keeping the total of enrolled students and the distribution of men in the four programs constant, if, in time 2, one of the women enrolled in Law changes programs to Civil Engineering, the disparity in both programs will be reduced. Note that the three segregation indices decline in time 2 compared to time 1. Moreover, if in time 3 there is a reallocation between women from the other already female programs, such that two Psychology students are transferred to Pedagogy, the disparity towards more women will increase in the latter but will decline in Psychology. However, the dissimilarity index is not sensible to that transfer (it keeps equal to 0.2857), even the Gini and Square Root indices indicating a raise in segregation between time 2 and 3.
In turn, the Gini and Square Root indices are sensitive to transfers that are not necessarily of women to predominantly male fields (or vice-versa), as it can also capture an increase in the female representation in a field that, though it was already predominantly female, was not so unequal - and then becomes so. This example shows that it is possible for the dissimilarity index to indicate decreased segregation while the Gini index shows stagnation - or even deterioration. As illustrated in the hypothetic example in Table 1, comparing time 1 and three, there was a reduction in segregation according to the Dissimilarity and Square Roots indices, but a raise in segregation according to Gini index. This example shows the importance of using different measures of segregation in empirical analysis.
Results and discussion
In the 2000 edition of the Higher Education Census, there were 359 in-person undergraduate programs and 2.69 million students enrolled, 56.2% of whom were women. That proportion shows the continuity of the gender gap reversion process, which started in the second half of the 20th century, as pointed out by Beltrão and Alves (2009).
In Table 2, which is inspired by charts 2 and 3 of Ricoldi and Artes (2016, pp. 157-165), we selected the 20 programs with the greatest number of enrolled students (considering both sexes) in 2000, ranked in descending order. It also shows the ranking of each of these programs separately by sex, in order to compare the representation of men and women.
TABLE 2 DISTRIBUTION OF UNDERGRADUATE STUDENTS BY THE 20 MOST FREQUENT (IN-PERSON) PROGRAMS, BY SEX, AND GPI
| Program | Total | Men | Women | GPI | |||
|---|---|---|---|---|---|---|---|
| Ranking | Obs. | Ranking | Obs. | ||||
| Total of students | 2,694,245 | 1,178,893 | 1,515,352 | 1.29 | |||
| Subtotal in the 20 most frequent programs | 1,809,529 | 757,216 | 1,052,313 | 1.39 | |||
| 1 | Law | 369,777 | 1 | 187,559 | 2 | 182,218 | 0.97 |
| 2 | Business Administration | 290,264 | 2 | 159,082 | 3 | 131,182 | 0.82 |
| 3 | Pedagogy | 202,584 | 18 | 14,538 | 1 | 188,046 | 12.93 |
| 4 | Accounting | 126,616 | 3 | 66,467 | 5 | 60,149 | 0.90 |
| 5 | Letters - Licensure | 104,575 | 15 | 17,395 | 4 | 87,180 | 5.01 |
| 6 | Social Communication (editing) | 79,584 | 7 | 32,191 | 7 | 47,393 | 1.47 |
| 7 | Economics | 65,414 | 5 | 38,756 | 11 | 26,658 | 0.69 |
| 8 | Psychology | 59,612 | 33 | 8,128 | 6 | 51,484 | 6.33 |
| 9 | Physiotherapy | 55,609 | 20 | 13,452 | 8 | 42,157 | 3.13 |
| 10 | Medicine | 54,812 | 8 | 29,712 | 12 | 25,100 | 0.84 |
| 11 | Computer Science | 52,336 | 4 | 39,382 | 27 | 12,954 | 0.33 |
| 12 | Dentistry | 46,184 | 16 | 17,123 | 9 | 29,061 | 1.70 |
| 13 | Physical Education - Licensure | 45,257 | 10 | 23,687 | 20 | 21,570 | 0.91 |
| 14 | Civil Engineering | 42,173 | 6 | 32,257 | 33 | 9,916 | 0.31 |
| 15 | Architecture and Urbanism | 37,162 | 19 | 13,621 | 15 | 23,541 | 1.73 |
| 16 | History - Licensure | 37,106 | 22 | 13,264 | 14 | 23,842 | 1.80 |
| 17 | Mathematics - Licensure | 36,686 | 17 | 16,945 | 21 | 19,741 | 1.17 |
| 18 | Science - Licensure | 36,071 | 24 | 12,579 | 16 | 23,492 | 1.87 |
| 19 | Tourism | 33,916 | 28 | 9,933 | 13 | 23,983 | 2.41 |
| 20 | Pharmacy | 33,791 | 26 | 11,145 | 17 | 22,646 | 2.03 |
Source: Authors’ elaboration based on microdata from the 2000 Higher Education Census.
Among the 20 most frequent programs, the most extreme GPI values are observed for the Pedagogy (12.93) and Civil Engineering (0.31) programs. In the case of Pedagogy, while it ranks third in number of enrolled students in 2000, it is only the 18th most frequent program in the male population, whereas for women it ranks first. Its GPI indicates that for each man enrolled in Pedagogy, there are 12.93 women. A similar pattern is seen in the Psychology and Letters - Licensure programs, whose GPIs are, respectively, 6.33 and 5.01.
As for Civil Engineering, the opposite is the case: while it is the 14th program in the general ranking, it is the sixth most frequent for men and the 33rd in the female ranking. Thus, for each man enrolled, there is only 0.31 woman enrolled. The pattern repeats for Computer Science and Economics, with GPIs equaling 0.33 and 0.69, respectively, indicating a prominent disparity towards more men.
There are also programs with GPIs relatively close to 1, i.e., close to sex parity, namely Law (0.97), Physical Education - Licensure (0.91), Accounting (0.90) and Mathematics - Licensure (1.17).
Table 3 repeats the same analysis for the 2017 edition of the Higher Education Census, which had 329 in-person programs5 and 6.49 million enrolled students - a leap of approximately 141% compared to 2000.6 The number of women increased by 138%, totaling 3.60 million individuals, which represents 55.5% of enrolled students. Therefore, there was a slight decrease in the female proportion - 0.7 percentage point. This reduction reflected on the overall GPI, which declined from 1.29 to 1.24. Such rate does not reflect the behavior of the segregation level in the programs, which is captured by the measures to be presented latter in this work.
TABLE 3 DISTRIBUTION OF UNDERGRADUATE STUDENTS BY THE 20 MOST FREQUENT (IN-PERSON) PROGRAMS, BY SEX, AND GPI
| Program | Total | Men | Women | GPI | |||
|---|---|---|---|---|---|---|---|
| Ranking | Obs. | Ranking | Obs. | ||||
| Total of Students | 6,494,098 | 2,892,830 | 3,601,268 | 1.24 | |||
| Subtotal in the 20 most frequent programs | 4,405,516 | 1,848,733 | 2,556,783 | 1.38 | |||
| 1 | Law | 878,940 | 1 | 392,620 | 1 | 486,320 | 1.24 |
| 2 | Business Administration | 481,768 | 3 | 221,713 | 2 | 260,055 | 1.17 |
| 3 | Civil Engineering | 335,029 | 2 | 231,815 | 10 | 103,214 | 0.45 |
| 4 | Nursing | 285,097 | 17 | 45,317 | 4 | 239,780 | 5.29 |
| 5 | Pedagogy | 284,230 | 29 | 24,183 | 3 | 260,047 | 10.75 |
| 6 | Psychology | 249,956 | 16 | 48,842 | 5 | 201,114 | 4.12 |
| 7 | Accounting | 244,840 | 5 | 106,876 | 6 | 137,964 | 1.29 |
| 8 | Architecture and Urbanism | 167,536 | 13 | 55,966 | 8 | 111,570 | 1.99 |
| 9 | Physiotherapy | 163,791 | 20 | 34,359 | 7 | 129,432 | 3.77 |
| 10 | Medicine | 149,655 | 11 | 62,533 | 12 | 87,122 | 1.39 |
| 11 | Production Engineering | 141,315 | 6 | 89,444 | 18 | 51,871 | 0.58 |
| 12 | Mechanical Engineering | 130,407 | 4 | 116,947 | 41 | 13,460 | 0.12 |
| 13 | Pharmacy | 126,892 | 19 | 35,580 | 11 | 91,312 | 2.57 |
| 14 | Bachelor of Physical Education | 126,680 | 8 | 82,680 | 20 | 44,000 | 0.53 |
| 15 | Nutrition | 124,885 | 34 | 18,326 | 9 | 106,559 | 5.81 |
| 16 | Dentistry | 115,706 | 22 | 32,189 | 13 | 83,517 | 2.59 |
| 17 | Physical Education - Licensure | 111,294 | 9 | 67,175 | 19 | 44,119 | 0.66 |
| 18 | Electrical Engineering | 102,954 | 7 | 88,737 | 39 | 14,217 | 0.16 |
| 19 | Veterinary Medicine | 93,650 | 23 | 30,685 | 14 | 62,965 | 2.05 |
| 20 | Agronomy | 90,891 | 10 | 62,746 | 26 | 28,145 | 0.45 |
Source: Authors’ elaboration based on microdata from the 2017 Higher Education Census.
In 2017, the ranking of the 20 most frequent programs changed, although some of them, like Law, Business Administration, Physiotherapy and Medicine kept their relative positions. It is worth highlighting the variation of Civil Engineering, which was ranked 14th in the overall ranking in 2000 and moved to the 3rd position in 2017. In this program, the total of enrolled students soared by 694%. Because the increase in the number of women (941%) was greater than in that of men (619%), the program’s GPI rose from 0.31 to 0.45 - which still indicates, however, a high disparity towards more men.
In her study, Barreto (2014) addressed the female representation in engineering programs in Brazil. The author highlights the remarkable increase in the number of women enrolled in engineering sub-fields from 1971 to 2011. She notes, however, that they are still a minority in those sub-fields, both in leadership positions and in research, and highlights the prejudice and discrimination they face.
The predominance of men in engineering sub-fields, despite the increase in the female proportion, is also analyzed by Martins (2018), who identifies segregation in higher education, as well as in the job market, where there are differences in employability and wages due to the reproduction of frequent sexist prejudices and stereotypes in the field.
These arguments are also explored by Lombardi (2008), who conducted interviews with male and female engineers who, at some point, occupied senior management positions, and found different career ascension patterns. For male engineers, linear ascension in the hierarchy is frequent, according to appointment by and collaboration with other men. Female engineers’ careers, in turn, tend to follow a non-linear course, with stagnation periods alternated with abrupt progress, and rarely involve appointment and cooptation. The author identifies several obstacles faced by women in this field as they seek senior positions, such as a lack of recognition for their skills and accomplished work, the prejudiced association with activities considered female in the work environment - such as the need to serve men -, the presence of gender stereotypes and the difficulty harmonizing professional life and family and children, which are usually considered the responsibility of women. Lombardi (2008) also mentions the importance of the so-called “male clubs”, referring to the closeness between men in a company, who discuss among themselves not only informal matters but also work-related issues, and end up excluding women.
Thus, the difficulties that women can face in engineering sub-fields in general, as well as the social construction that conditions them to choose careers of a less technical and competitive nature and more oriented towards the care of others, are factors that can explain their smaller representation in these sub-fields. Because they internalize gender norms and stereotypes, in addition to having few examples they can mirror, female students are not prone to choose engineering sub-fields or other STEM careers in higher education.
Also regarding the comparison between 2000 and 2017, we can see a decrease in the GPIs for Pedagogy and Psychology, which, in the latter year, are 10.75 and 4.12, respectively. Still, Pedagogy continues to be the program with the highest GPI in the ranking of the 20 most frequent programs, though it is no longer the one women choose most, having been replaced by Law and Business Administration, both with GPI values close to 1 (1.24 and 1.17, respectively).
The combined analysis of Tables 2 and 3 allows concluding, therefore, that in the comparison between 2000 and 2017, sex disparity decreased in the programs with the most extreme levels of segregation among the most populous ones. However, this evolution moves very slowly. A linear projection for Civil Engineering indicates that, at this pace, total parity in the number of enrolled students will only be reached in 2084. In the Pedagogy program, that scenario will only be possible in 2093.
Table 4 below presents the percentage of women in the 22 specific areas in the classification adopted by the Inep (2018), for 2000 and 2017. Again, the figures clearly show the existence of areas with a male predominance, such as Engineering and related professions and Computing, as well as areas occupied by a majority of women, particularly Social Work and Teacher education and education sciences. However, one restriction should be noted with regard to analyses that use the classification by specific area, since such classification aggregates programs with very different levels of female representation, thus hiding the true gender disparity levels. One example of this can be seen in the area of Health, which had 71.6% of women in 2017. However, if we disaggregate it into programs, we will find significant differences: in Physical education, only 34.7% of students were women, whereas in Nursing, that percentage was 84.1%.
TABLE 4 PERCENTAGE OF WOMEN (%) ENROLLED IN IN-PERSON HIGHER EDUCATION BY REGION AND SPECIFIC PROGRAM AREA
| Program Area | 2000 | 2017 | ||||||||||
|---|---|---|---|---|---|---|---|---|---|---|---|---|
| Central West | Northeast | North | Southeast | South | Brazil | Central West | Northeast | North | Southeast | South | Brazil | |
| Agriculture, forests and fishing resources | 31.6 | 34.0 | 45.2 | 29.1 | 27.6 | 31.3 | 35.8 | 44.6 | 47.3 | 35.5 | 33.3 | 37.8 |
| Architecture and construction | 43.0 | 35.6 | 39.0 | 43.4 | 45.6 | 42.2 | 41.8 | 40.1 | 38.2 | 43.1 | 46.3 | 42.6 |
| Arts | 61.6 | 49.9 | 34.8 | 57.5 | 60.2 | 57.5 | 61.1 | 57.9 | 51.7 | 55.8 | 62.7 | 57.9 |
| Sciences | 69.7 | 62.8 | 61.5 | 67.3 | 72.7 | 67.6 | 71.3 | 70.1 | 69.9 | 74.8 | 76.0 | 73.3 |
| Physical Sciences | 44.7 | 35.0 | 42.5 | 39.2 | 46.7 | 40.7 | 47.0 | 34.7 | 48.8 | 41.9 | 48.6 | 41.3 |
| Social and behavioral sciences | 63.7 | 57.6 | 58.5 | 66.3 | 62.3 | 63.4 | 73.5 | 73.2 | 70.5 | 71.0 | 70.9 | 71.6 |
| Computing | 31.1 | 24.3 | 32.1 | 28.0 | 24.6 | 27.5 | 13.2 | 12.7 | 15.1 | 13.9 | 11.7 | 13.4 |
| Commerce and Business Administration | 50.8 | 46.8 | 52.6 | 47.0 | 45.8 | 47.3 | 54.0 | 53.1 | 55.1 | 56.0 | 54.3 | 54.9 |
| Law | 51.0 | 46.3 | 48.7 | 49.7 | 48.4 | 49.3 | 55.6 | 52.3 | 53.4 | 56.7 | 56.3 | 55.3 |
| Engineering and related professions | 15.2 | 16.7 | 22.4 | 15.4 | 14.2 | 15.5 | 24.6 | 27.3 | 27.9 | 24.8 | 22.9 | 24.9 |
| Teacher education and sciences of education | 75.7 | 70.6 | 70.3 | 79.8 | 79.8 | 76.5 | 67.9 | 62.2 | 60.1 | 69.2 | 67.0 | 65.6 |
| Humanities and letters | 64.1 | 55.7 | 56.3 | 70.3 | 65.8 | 66.6 | 47.6 | 42.8 | 35.6 | 49.2 | 41.5 | 46.3 |
| Journalism and information | 63.6 | 62.7 | 56.6 | 59.8 | 61.6 | 60.6 | 60.7 | 58.8 | 61.3 | 60.2 | 61.4 | 60.2 |
| Mathematics and statistics | 41.2 | 30.7 | 31.8 | 45.0 | 54.0 | 42.8 | 34.3 | 32.7 | 41.0 | 36.2 | 35.7 | 35.5 |
| Production and processing | 72.5 | 51.3 | 63.6 | 47.0 | 57.3 | 53.7 | 64.5 | 56.5 | 56.9 | 55.3 | 64.8 | 58.3 |
| Environmental protection | - | - | - | 33.9 | - | 33.9 | 51.6 | 60.2 | 55.1 | 55.2 | 55.4 | 55.8 |
| Health | 73.5 | 67.8 | 64.4 | 68.2 | 68.5 | 68.4 | 72.6 | 72.4 | 71.1 | 71.2 | 70.9 | 71.6 |
| Social work | 94.0 | 96.4 | 92.1 | 94.9 | 95.7 | 95.2 | 89.1 | 91.3 | 89.5 | 88.2 | 87.5 | 89.6 |
| Security services | - | 19.0 | - | 17.5 | 0.0 | 16.1 | 30.4 | 44.7 | 50.4 | 18.3 | 0.0 | 31.8 |
| Transportation services (general programs) | 0.0 | - | - | 9.4 | 11.3 | 9.8 | 9.5 | 19.3 | - | 22.8 | 16.6 | 20.1 |
| Personal services | 71.6 | 71.7 | 75.0 | 71.3 | 69.2 | 71.1 | 80.4 | 72.8 | 80.5 | 76.8 | 78.7 | 76.7 |
| Veterinary medicine | 46.9 | 49.9 | 48.3 | 57.0 | 50.4 | 53.3 | 61.7 | 62.3 | 61.3 | 70.1 | 67.9 | 67.2 |
| Total | 58.8 | 56.8 | 57.3 | 55.5 | 56.4 | 56.2 | 56.4 | 57.0 | 56.4 | 54.9 | 53.9 | 55.5 |
Source: Authors’ elaboration based on microdata from the 2000 and 2017 Higher Education Census.
The bottom line in Table 4 presents the percentage of enrolled women by region of the country in 2000 and 2017. In both years, this percentage oscillated close to the national average for all regions, therefore, there was no signs of significant regional heterogeneity.
The intertemporal comparison allows inferring that sex segregation in the specific areas persisted over the years. Except for Humanities and letters, the predominantly female areas - i.e., with at least 60% of women - remained in this condition in 2017. In half of them, the proportion of women increased even further: Sciences (from 67.6% to 73.3%), Social and behavioral sciences (from 63.4% to 71.6%), Health (from 68.4% to 71.6%) and Personal services (from 71.1% to 76.7%). On the other hand, among the six predominantly male areas, i.e., with less than 40% of women, only one changed its condition in 2017 to become integrated - i.e., when the female proportion ranges between 40% and 60%.
Regarding the areas that were considered integrated in 2000, there was an increase in the proportion of women, except for Mathematics and statistics, which became predominantly male. It is worth highlighting the Computing area, where the female proportion declined from 27.5% in 2000 to 13.4% in 2017. This behavior was observed in all regions in the country. The literature points out, however, that women played a critical role in the origin of the first computers, and that their participation in the area was often omitted by historiography, which contributes to perpetuate the mistaken perception that this area was always dominated by men and that women have no interest in or ability for it (Light, 1999). Both in Computer Science and in other STEM areas, there is evidence of a feedback effect in which female underrepresentation and the omission of role models discourage girls from pursuing these careers (Emerson et al., 2012; Shin et al., 2016; González-Pérez et al., 2020).
In the Law area, the proportion of women leaped from 49.3% in 2000 to 55.3% in 2017. In Journalism and information, that percentage oscillated from 60.6% to 60.2%. It is worth highlighting, however, that the obstacles faced by women are not necessarily eliminated in the areas in which they are or have become the majority, since the “glass ceiling” phenomenon persists a posteriori, in the job market. The term “glass ceiling” designates the invisible barriers that hinder and delay the rise of women to senior management positions, causing a female underrepresentation at the top of hierarchies.
In examining the careers of female lawyers working at the top Brazilian law firms, Bertolin (2017) notes the existence of the glass ceiling in lawyer partnerships, as even with similar conditions for both sexes, men are more likely to become partners (the top position in these firms’ hierarchy), and thus the female population is more concentrated at the base of the career. According to the author, “the profession did not adapt to the massive entry of women in recent decades” (Bertolin, 2017, p. 25). A similar situation is observed in Journalism, where the increased number of women is not accompanied by a proportional representation of this sex in professional hierarchies’ senior positions (Leite, 2017).
Segregation analysis
Table 5 presents the values of the synthetic indices of segregation for 2000 and 2017. The calculation was performed considering the four possible program aggregation levels: General Area, which corresponds to the first digit of the classification and aggregates the programs in eight groups7; Specific Area, which is indicated by the first two digits and considers 22 groups; Detailed Area (three-digit level) with 75 categories observed in 2000 and 77 in 2017; and Program, with 359 possibilities in 2000 and 329 in 2017.
TABLE 5 DISSIMILARITY, GINI AND SQUARE ROOT INDICES ACCORDING TO DIFFERENT PROGRAM AGGREGATION LEVELS
| Aggregation level | Dissimilarity Index | Gini Index | Square Root Index | |||
|---|---|---|---|---|---|---|
| 2000 | 2017 | 2000 | 2017 | 2000 | 2017 | |
| General Area | 0.2659 | 0.2219 | 0.3430 | 0.2990 | 0.0513 | 0.0389 |
| Specific Area | 0.2965 | 0.2499 | 0.3864 | 0.3584 | 0.0666 | 0.0597 |
| Detailed Area | 0.3426 | 0.3031 | 0.4676 | 0.4626 | 0.1055 | 0.1024 |
| Program | 0.3586 | 0.3353 | 0.4874 | 0.4952 | 0.1165 | 0.1129 |
Source: Authors’ elaboration, based on microdata from the 2000 and 2017 Higher Education Census.
As seen above, the higher the aggregation level adopted, the lower the segregation level observed. This occurs because the aggregation of programs into a given category is based on knowledge closeness between them, and not on female representation. Thus, programs that significantly differ with regard to female representation may be included in the same group, which hides part of the gender disparity. It is worth noting that this sensibility of the segregation measures to the degree of aggregation of analysis units - whether these are higher education programs, occupations, etc. - is known in the literature, as Anker (1998, p. 96) explains. In order to properly measure the degree of segregation, it is advisable to conduct the analysis based on three- or more digit classifications, i.e., more detailed classifications, as one- or two-digit data - which are more aggregated - are usually insufficiently detailed (Degraff & Anker, 2004, p. 191). Therefore, this work will focus on results obtained by considering classifications according to Detailed Area and Program.
A decrease is seen in the dissimilarity index from 2000 to 2017. Its value, considering the classification by Detailed Area in 2017, indicates that 30.3% of students of a given sex should change areas (both by means of the movement of men towards more female areas, and of women towards more male areas) to eliminate segregation. In 2000, that value was 34.3% (therefore, an 11.5% decrease). In the classification by Program, the dissimilarity index decreased from 35.9% in 2000 to 33.5% in 2017 (a 6.5% reduction). Therefore, the comparison reveals that the more disaggregated the classification adopted, not only the higher the dissimilarity index, but also the smaller its temporal reduction.
When it comes to the Gini index - which, as explained in the methodological section, is a measure that meets desirable properties of a segregation measure -, the intertemporal comparison, considering the classification by Program, reveals that there was no decrease in the level of sex segregation. This measure, on the contrary, had an increase, as it rose from 0.487 in 2000 to 0.495 in 2017 - a 1.6% increase. Figure 2 presents the segregation curves for 2000 and 2017, which illustrate the analysis with the Gini index.
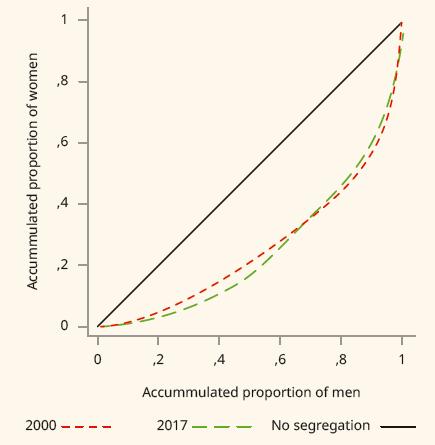
Source: Designed by the authors based on microdata from the 2000 and 2017 Higher Education Census.
FIGURE 2 SEGREGATION CURVES ACCORDING TO CLASSIFICATION BY PROGRAM
Thus, at the most disaggregated level of analysis, while the dissimilarity index presented evidence of decreased sex segregation over the analyzed period, a more detailed analysis based on calculating the Gini index showed an opposite trend, i.e., towards increased segregation. This apparent contradiction in results can be explained by the fact that the dissimilarity index captures only the segregation level variations resulting from the transition of individuals from a predominantly female program to a male one (or vice-versa), whereas the Gini index is sensitive to any change in the sex composition of the analyzed categories resulting in reduction or increase in sex segregation.
The results obtained by using the square root index, in turn, corroborate those found for the dissimilarity index, showing a decline in segregation, though to a lesser degree: 2.9%, when considering the classification by Detailed Areas, and 3.1% when it comes to classification by Program.
An interesting property of the square root index, as explained earlier, is that it can be decomposed into the segregation observed between groups of similar programs (as to their knowledge area) and the segregation observed within these groups. Table 6 presents the result of this decomposition when segregation measured at the most disaggregated level (i.e., at Program level) is decomposed according to the three possible types of grouping: by General Area, by Specific Area and by Detailed Area.
TABLE 6 DECOMPOSITION OF TOTAL SEGREGATION (MEASURED AT THE PROGRAM LEVEL) CONSIDERING GENERAL, SPECIFIC AND DETAILED AREAS
| Aggregation Level | 2000 | 2017 | ||||
|---|---|---|---|---|---|---|
| Between | Within | Total | Between | Within | Total | |
| General Area | ||||||
| Square root index | 0.051 | 0.065 | 0.116 | 0.039 | 0.074 | 0.113 |
| Participation (%) | 44.1 | 55.9 | 100.0 | 34.5 | 65.5 | 100.0 |
| Specific Area | ||||||
| Square root index | 0.067 | 0.050 | 0.116 | 0.060 | 0.053 | 0.113 |
| Participation (%) | 57.2 | 42.8 | 100.0 | 52.9 | 47.1 | 100.0 |
| Detailed Area | ||||||
| Square root index | 0.105 | 0.011 | 0.116 | 0.102 | 0.010 | 0.113 |
| Participation (%) | 90.6 | 9.4 | 100.0 | 90.8 | 9.2 | 100.0 |
Source: Authors’ elaboration, based on microdata from the 2000 and 2017 Higher Education Census.
As presented in Table 5, the segregation considering Programs, according to the square root index, decreased by 3.1% from 2000 and 2017 (from 0.116 to 0.113). By grouping programs according to General Areas, a decrease in the component is seen between groups, with the participation of this term in the total segregation declining from 44.1% to 34.5%. Within the General Areas, however, segregation increased (rising from 0.065 to 0.074). Thus, the decline in the overall degree of segregation was driven by the redistribution of men and women between the eight major knowledge areas; within these, sex stratification increased. A similar result is obtained considering decomposition according to Specific Areas. In this case, the participation of the component between groups in the total segregation decreased from 57.2% to 52.9%. When it comes to decomposition by Detailed Area, there is no significant change in the components between and within groups, which suggests that this form of aggregation of programs by knowledge closeness does not significantly conceal the true degree of gender disparity.
Thus, there are two main results that can be drawn from the analysis conducted in this section. First, there is evidence of decrease in the overall degree of segregation between 2000 and 2017. However, a rigorous analysis of this behavior in the light of more robust indicators and based on a more disaggregated classification of programs indicates a slight increase (according to the Gini index) or a very subtle decline (according to the square root index) in segregation. Thus, the analysis according only to the calculation of the dissimilarity index - the most widely used in the literature -, based on the one- or two-digit classification can lead to misleading results about the evolution of segregation, suggesting a more promising scenario than the one that is actually observed. Secondly, the analysis of decomposition of the square root index showed that the decline in the overall level of segregation was driven by the sex integration between the major knowledge areas - a process that is partially offset by increased segregation within them.
Final considerations
This study aimed to analyze sex segregation in Brazilian in-person higher education programs by observing, at the national level, the evolution of this phenomenon, based on data for 2000 and 2017. This subject is justified as although there has been a reversion in the gender gap in higher education, with women becoming the majority in the university environment, there is no equality in their representation in the various programs. In particular, the programs with greatest prestige in society and which potentially offer the greatest returns in the job market continue to show male predominance.
The preliminary descriptive analysis showed a reduction in sex disparity in the most emblematic programs, namely Civil Engineering and Pedagogy, which have a major concentration of men and women, respectively. However, while both programs move towards gender parity, linear projections indicate that total equality will only be reached in the last decades of this century, showing that progress is slow.
Another finding was that the mixed or integrated areas, i.e., those in which the proportions of women and men are similar, show a tendency towards becoming more female over time. Evidence in the literature shows, however, that even when women are the majority in a given occupation in the job market, gender inequalities do not disappear, as the stereotypes continue to reflect on the barriers to career ascension.
The combined analysis of the dissimilarity and square root indices indicates a decline in the overall segregation level between 2000 and 2017 when we consider the most disaggregated level of analysis (programs). This result is explained by the decrease in sex stratification between the major knowledge areas; within these, the analysis of decomposition of the square root index indicates that segregation increased.
Therefore, in general terms, results are positive, showing signs of progress regarding gender equity in the university environment. There are two caveats, however. The first is that the decline in segregation has been slow, corresponding to 3.1% overall, according to the square root index, for a 17-year period. The second is that this result, albeit positive, is situated in a broader context of reduction in the pace of women’s advances and achievements in the Brazilian job market. The percentage of female representation, which intensely increased from the 1970s to the 1990s, progressed more slowly in the 2000s, and showed signs of stabilization in the 2010s - however, at a much lower level that that observed for men - as identified by Soares and Izaki (2002, p. 21). Occupational sex segregation, in turn, increased from 2004 to 2015, thus reversing the downward trend that had been reported in the literature for the years before that period (Botassio & Vaz, 2020). Thus, it is necessary that future research investigates in further detail the pace of decrease in sex segregation in higher education programs in recent decades, using longer time frames, in order to investigate whether the reduction in segregation has been taking place at a faster or slower pace in the most recent period.
The continuity of female achievements towards greater equity in the job market and in public spaces depends on overcoming gender stereotypes still ingrained in society which, as seen in this work, are manifested in professional choice. In this regard, it is of the essence to strengthen actions and policies for encouraging women’s entry into and permanence in predominantly male programs in Brazil. Studies have shown the positive effect of role models on women’s entry into and permanence and performance in careers considered as typically male, such as those in the STEM areas.8 Thus, support networks and mentorship programs in secondary education, established in partnership with universities and companies, by means of which female STEM students and graduates can talk and give their testimony to teenage girls, can inspire these girls to choose these careers. In addition, it is necessary to promote more actions to encourage female participation in activities related to science and technology in secondary education - for example, in the Brazilian Mathematical, Physics and Informatics Olympiads and in science fairs -, as well as to expand the offer of contents of science, technology, engineering and mathematics to teenagers.
REFERENCES
Alves, J. E. D. (1994). Transição da fecundidade e relações de gênero no Brasil [Tese de doutorado, Universidade Federal de Minas Gerais]. Repositório Institucional da UFMG. [ Links ]
Anker, R. (1998). Gender and jobs: Sex segregation of occupations in the world. International Labour Office. [ Links ]
Barreto, A. (2014). A mulher no ensino superior: Distribuição e representatividade. Cadernos do GEA, 3(6), 5-52. [ Links ]
Beltrão, K. I., & Alves, J. E. D. (2009). A reversão do hiato de gênero na educação brasileira no século XX. Cadernos de Pesquisa, 39(136), 125-156. https://doi.org/10.1590/S0100-15742009000100007 [ Links ]
Beltrão, K. I., & Teixeira, M. D. P. (2005). O vermelho e o negro: Viés de cor e gênero nas carreiras universitárias (Texto para Discussão, 19). Escola Nacional de Ciências Estatísticas. [ Links ]
Bergmann, B. R. (2005). The economic emergence of women. Palgrave Macmillian. [ Links ]
Bertolin, P. T. M. (2017). Feminização da advocacia e ascensão das mulheres nas sociedades de advogados. Cadernos de Pesquisa, 47(163), 16-42. https://doi.org/10.1590/198053143656 [ Links ]
Botassio, D. C. (2017). Segregação e desigualdade: Analogia na mensuração e análise da segregação por gênero em setores de atividade no Brasil [Dissertação de mestrado, Universidade de São Paulo]. Biblioteca Digital de Teses e Dissertações da USP. http://doi.org/10.11606/D.11.2017.tde-16082017-090239 [ Links ]
Botassio, D. C., & Vaz, D. V. (2020). Segregação ocupacional por sexo no mercado de trabalho brasileiro: uma análise de decomposição para o período 2004-2015. Revista Brasileira de Estudos de População, 37, e0131. https://doi.org/10.20947/S0102-3098a0131 [ Links ]
Chabaud-Rychter, D., & Gardey, D. (2009). Técnicas e gênero. In H. Hirata, F. Laborie, H. Le Doaré, & D. Senotier (Orgs.), Dicionário crítico do feminismo (pp. 241-246). Editora Unesp. [ Links ]
Degraff, D. S., & Anker, R. (2004). Gênero, mercados de trabalho e o trabalho das mulheres. In A. Pinnelli (Org.), Gênero nos estudos de população (pp. 163-197). Associação Brasileira de Estudos Populacionais (Abep). [ Links ]
Duncan, O. D., & Duncan, B. (1955). A methodological analysis of segregation indexes. American Sociological Review, 20(2), 210-217. https://doi.org/10.2307/2088328 [ Links ]
Emerson, T. L. N., Mcgoldrick, K., & Mumford, K. J. (2012). Women and the Choice to Study Economics. The Journal of Economic Education, 43(4), 349-362. https://doi.org/10.1080/00220485.2012.714306 [ Links ]
Fresneda, B. (2007). Segregação ocupacional versus discriminação salarial por gênero no mercado de trabalho brasileiro - 2004. In Anais do 13 Congresso Brasileiro de Sociologia. [ Links ]
González-Pérez, S., Cabo, R. M. D., & Sáinz, M. (2020). Girls in STEM: Is it a female Role-Model Thing? Frontiers in Psichology, 11, 1-21. https://doi.org/10.3389/fpsyg.2020.02204 [ Links ]
Herrmann, S. D., Adelman, R. M., Bodford, J. E., Graudejus, O., Okun, M. A., & Kwan, V. S. Y. (2016). The effects of a female role model on academic performance and persistence of women in STEM courses. Basic and Applied Social Psychology, 38(5), 258-268. https://doi.org/10.1080/01973533.2016.1209757 [ Links ]
Hoffmann, R., Botassio, D., & Jesus, J. G. de (2019). Distribuição de renda: Medidas de desigualdade, pobreza, concentração, segregação e polarização. Edusp. [ Links ]
Hutchens, R. (2001). Numerical measures of segregation: Desirable properties and their implications. Mathematical Social Sciences, 42(1), 13-29. https://doi.org/10.1016/S0165-4896(00)00070-6 [ Links ]
Instituto Nacional de Estudos e Pesquisas Educacionais Anísio Teixeira - Inep. (2000). Microdados do Censo da Educação Superior. https://www.gov.br/inep/pt-br/areas-de-atuacao/pesquisas-estatisticas-e-indicadores/censo-da-educacao-superior/resultados [ Links ]
Instituto Nacional de Estudos e Pesquisas Educacionais Anísio Teixeira - Inep. (2017). Microdados do Censo da Educação Superior. https://www.gov.br/inep/pt-br/areas-de-atuacao/pesquisas-estatisticas-e-indicadores/censo-da-educacao-superior/resultados [ Links ]
Instituto Nacional de Estudos e Pesquisas Educacionais Anísio Teixeira - Inep. (2018). Manual para classificação de cursos de graduação e sequenciais - CINE Brasil 2018. Inep/MEC. https://download.inep.gov.br/educacao_superior/censo_superior/apresentacao/2018/Manual_Preliminar_para_a_Classificacao_dos_Cursos_Cine_Brasil_2018.pdf [ Links ]
Jahn, J., Schmid, C. F., & Schrag, C. (1947). The measurement of ecological segregation. American Sociological Review, 12(3), 293-303. https://doi.org/10.2307/2086519 [ Links ]
Kergoat, D. (2009). Divisão sexual do trabalho e relações sociais de sexo. In H. Hirata, F. Laborie, H. Le Doaré, & D. Senotier (Orgs.), Dicionário crítico do feminismo (pp. 67-75). Editora Unesp. [ Links ]
Leite, A. T. B. (2017). Editoras, repórteres, assessoras e freelancers: Diferenças entre as mulheres no jornalismo. Cadernos de Pesquisa, 47(163), 44-68. http://doi.org/10.1590/198053143810 [ Links ]
Light, J. (1999). When computers were women. Technology and Culture, 40(3), 455-483. https://www.jstor.org/stable/25147356 [ Links ]
Lombardi, M. R. (2008). Engenheira e gerente: Desafios enfrentados por mulheres em posições de comando na área tecnológica. In A. Costa, B. Sorj, C. Bruschini, & H. Hirata (Orgs.), Mercado de trabalho e gênero: Comparações internacionais (pp. 387-402). Editora FGV. [ Links ]
Madalozzo, R. (2010). Occupational segregation and the gender wage gap in Brazil: An empirical analysis. Economia Aplicada, 14(2), 147-168. https://doi.org/10.1590/S1413-80502010000200002 [ Links ]
Madalozzo, R., & Artes, R. (2017). Escolhas profissionais e impactos no diferencial salarial entre homens e mulheres. Cadernos de Pesquisa, 47(163), 202-221. http://doi.org/10.1590/198053143666 [ Links ]
Martins, V. F. P. (2018). Protagonismo feminino: O gênero como atravessamento para pensar inovação social no Brasil. In Anais do 3 Congresso Nacional de Inovação e Tecnologia - INOVA. [ Links ]
Melo, H. P. de, & Castilho, M. (2009). Trabalho reprodutivo no Brasil: Quem faz? Revista de Economia Contemporânea, 13(1), 135-158. https://doi.org/10.1590/S1415-98482009000100006 [ Links ]
Oliveira, A. M. H. C. (2003). A segregação ocupacional por gênero e seus efeitos sobre os salários no Brasil. In S. Wajnman, & A. F. Machado (Orgs.), Mercado de trabalho: Uma análise a partir das pesquisas domiciliares no Brasil (pp. 121-149). Editora UFMG. [ Links ]
Pereira, T. I., & Silva, L. F. S. C. da. (2010). As políticas públicas do ensino superior no governo Lula: Expansão ou democratização? Revista Debates, 4(2), 10-31. https://doi.org/10.22456/1982-5269.16316 [ Links ]
Queiroz, C., Carvalho, M. E., & Moreira, J. (2014). Gênero e inclusão de jovens mulheres nas ciências exatas, nas engenharias e na computação. In Anais do 18 REDOR - Rede Feminista Norte e Nordeste de Estudos e Pesquisa sobre a Mulher e Relações Gênero. pp. 3483-3500. [ Links ]
Rapoport, B., & Thibout, C. (2018). Why do boys and girls make different educational choices? The influence of expected earnings and test scores. Economics of Education Review, 62, 205-229. https://doi.org/10.1016/j.econedurev.2017.09.006 [ Links ]
Ricoldi, A., & Artes, A. (2016). Mulheres no ensino superior brasileiro: Espaço garantido e novos desafios. Ex Aequo, 33, 149-161. https://doi.org/10.22355/exaequo.2016.33.10 [ Links ]
Shin, J. E. L., Levy, S. R., & London, B. (2016). Effects of role model exposure on STEM and non-STEM student engagement. Journal of Applied Social Psychology, 46(7), 410-427. https://doi.org/10.1111/jasp.12371 [ Links ]
Soares, S., & Izaki, R. S. (2002). A participação feminina no mercado de trabalho (Texto para Discussão, 923). Ipea. [ Links ]
Vaz, D. V., & Hoffmann, R. (2011). Segregação ocupacional por sexo no setor público brasileiro no período 1995 e 2008. Revista da ABET, 10(1), 120-141. [ Links ]
Data availability statement The computational routine for estimating the results, based on microdata from the Higher Education Census (Inep, 2000, 2017), is available at https://data.scielo.org/dataverse/brcp
1Note of translation: Magistério is a vocational secondary-level program that trains students to teach in elementary education.
2In the original: “. . . um dos mais importantes efeitos da existência de segregação ocupacional é o seu impacto nas diferentes remunerações recebidas por homens e mulheres ao longo de suas carreiras”.
3According to the Inep’s website, data are collected through questionnaires returned by Higher Education Institutions, as well as through the import of data from Sistema e-MEC - a database on Brazilian higher education.
4 For details on how to derive expression (4) from (3), see Botassio (2017, pp. 37-39) and Hoffmann et al. (2019, pp. 312-314).
5In 2000, the census had found 359 in-person programs; this difference, in 2017, is the net effect of the extinction of a few programs and the emergence of others.
6The increase in the number of enrolled students is explained by the expansion in the number of enrollment slots, mainly in the 2000s. Although the expansion of higher education started in the 1990s, it was more significant since the Lula administration, a period in which the State assumed the role of driver of policies for higher education expansion in the country, generating a substantial increase in enrollment slots and in the number of students enrolled in private and public institutions (Pereira & Silva, 2010). Among the measures taken in the period, it is worth highlighting the Program for Supporting Federal Universities Restructuring and Expansion Plans (Reuni) whose main goal was to increase the number of enrollment slots in federal universities, thus making their physical, academic and pedagogical expansion possible. As for private higher education, it is worth highlighting the University for All Program (Prouni), which offered partial and full scholarships for low-income students. In addition to these programs, the existing Student Financing Program (Fies) was restructured, thus expanding the offer of credit for financing studies in private higher education institutions.
7They are: (1) Education; (2) Humanities and Arts; (3) Social Sciences, Business Administration and Law; (4) Science, Mathematics and Computing; (5) Engineering, Production and Construction; (6) Agriculture and Veterinary Medicine; (7) Health and Social Well-being; and (8) Services.
8In a study conducted in Spain, González-Pérez et al. (2020) allowed female undergraduate STEM students or graduates to talk to 304 girls aged 12 to 16 (i.e., the ages in which female students begin to have a negative perception about their own skills) about career possibilities. The study proved that, on average, the girls who were exposed to these successful examples became likelier to choose careers in these areas than those who did not have contact with these female role models. A similar study was conducted by Shin et al. (2016) with role models being presented to students through the reading of six biographies that might inspire them. Results indicate a positive impact on the interest for STEM careers.
Received: February 17, 2021; Accepted: July 23, 2021
 Este é um artigo publicado em acesso aberto sob uma licença Creative Commons
