


Servicios Personalizados
Revista

Articulo
 texto en
  Inglés (pdf)
 Articulo en XML
 Enviar articulo por email
Compartir

 Permalink
Cadernos de Pesquisa
versión impresa ISSN 0100-1574versión On-line ISSN 1980-5314
Cad. Pesqui. vol.51 São Paulo 2021 Epub 27-Ago-2021
https://doi.org/10.1590/198053147211
TEACHER EDUCATION AND TEACHING
PROPOSAL FOR A TEACHER TURNOVER INDICATOR IN BASIC EDUCATION1

IUniversidade de São Paulo (USP), São Paulo (SP), Brazil; mairagallotti@gmail.com
IIUniversidade Federal de Goiás (UFG), Goiânia (GO), Brazil; thiagoalves.edu@gmail.com
This paper proposes a measure for teacher turnover in basic education, considering the school as an analysis unit. Potentially explanatory variables such as type of providers (public and private institutions, level of education, and employment relationship were considered. The empirical part was based on microdata from the 2016 and 2017 School Census (Inep, 2017, 2018) and focused on the municipality of Curitiba-PR. The results suggest that turnover in 2017 was 34.4%. At the school level, the median rate was 55.4% in the state government system, 22.2% in the local government system, and 16.5% in the federal network. Regarding private schools, the highest median was among the government-dependent institutions (33.3%). The results reiterate the phenomenon as a relevant issue for the educational policy agenda and the management of public school systems.
Key words: EDUCATIONAL INDICATORS; EDUCATIONAL POLITICS; BASIC EDUCATION
Este artigo propõe uma medida para a rotatividade docente na educação básica tomando a escola como unidade de análise. Foram consideradas variáveis potencialmente explicativas como dependência administrativa, etapa/modalidade de ensino e vínculo empregatício. A parte empírica foi realizada com base nos microdados do Censo Escolar de 2016 e 2017 (Inep, 2017, 2018) e focalizou o município de Curitiba-PR. Os resultados sugerem que a rotatividade em 2017 foi de 34,4%. No nível das escolas, a taxa mediana foi 55,4% na rede estadual, 22,2% na rede municipal e 16,5% na rede federal. Em relação às escolas privadas, a maior mediana deu-se entre as instituições conveniadas (33,3%). Os resultados reiteram o fenômeno como questão relevante para a agenda das políticas educacionais e da gestão das redes públicas de ensino.
Palavras-Chave: INDICADORES EDUCACIONAIS; POLÍTICA EDUCACIONAL; EDUCAÇÃO BÁSICA
Este artículo propone una medida para la rotación docente en la educación básica, tomando la escuela como una unidad de análisis. Fueron consideradas variables potencialmente explicativas como dependencia administrativa, etapa/modalidad de enseñanza y vínculo laboral. La parte empírica se realizó sobre la base de los microdatos del Censo Escolar 2016 y 2017 (Inep, 2017, 2018) y se centró en el municipio de Curitiba-PR. Los resultados sugieren que la rotación en 2017 fue del 34,4%. A nivel escolar, la tasa media fue de 55.4% en la red estatal, 22.2% en la red municipal y 16.5% en la red federal.
Entre las escuelas privadas, la mediana más alta se dio entre las instituciones asociadas (33,3%). Los resultados reiteran el fenómeno como una cuestión relevante para la agenda de las políticas educativas y de la gestión de las redes públicas de enseñanza.
Palabras-clave: INDICADORES EDUCATIVOS; POLÍTICA EDUCATIVA; EDUCACIÓN BÁSICA
Cet article propose un indicateur de la rotation des enseignants dans l’éducation de base en utilisant l’école comme unité d’analyse. Des variables potentiellement explicatives ont été prises en compte, tels que le réseau d’appartenance administrative, le niveau ou les modalités d'enseignement et le type de contrat de travail. La part empirique repose sur des microdonnées du Recensement Scolaire de 2016 et 2017 (Inep, 2017, 2018) pour la commune de Curitiba-PR. Les résultats suggèrent qu’en 2017 la rotation du personnel enseignant était de 34,4%. Le taux médian de rotation du personnel était de 55,4% pour les écoles appartenant au réseau de l ’État du Parana de 22,2% pour les écoles municipales et de 16,5% pour les écoles du réseau féderal. Dans les écoles privées, le taux moyen le plus élevé concernait les établissements sous contrat (33,3%). Les résultats confirment l’importance du phénomène pour l’élaboration de l'agenda des politiques éducatives et la gestion des systèmes d’enseignement public.
Key words: INDICATEURS ÉDUCATIFS; POLITIQUE ÉDUCATIVE; ÉDUCATION DE BASE
This paper proposes an indicator to measure and understand the teacher turnover phenomenon in basic education. For this purpose, it conceives teacher turnover as the leave of a teacher from a school, whether due to migration to another school, retirement, or even abandonment of the profession (Ingersoll, 2001).
The importance of measuring this phenomenon is because it relies, with a high degree of incidence (Frantz, 2018; Pereira & Oliveira, 2016), on work that requires high levels of maintenance and social interaction (Tardif & Lessard, 2014) to achieve its goals related to a political sphere, given its character as a pressing social agent in the civilizing process (Fanfani, 2005).
Professional turnover is a usual phenomenon in public and private organizations in various areas of the economy and, to some degree, its incidence is expected or, sometimes, even desired. However, organizations try to measure (and even prevent, manage, and mitigate) its occurrence because they believe that, at high levels, it can compromise the achievement of organizational goals and generate high costs with layoffs, recruitment, selection, and development of new team members.
In the state sector, the relevance of turnover as an object of study stands out mainly because it considers that the State, which is made up for a complex and abstract system and based on norms and rules set forth in the constitutional text, depersonalizes power. Therefore, it highlights the public- -thing, demanding a functional staff that acts because of the recognition of this rational-bureaucratic domination (Weber, 1994) and, also, of a specific professional moral (Supiot, 1995) aiming the effectiveness of public services that materialize the rights set forth in the legal system. While in private sector organizations professional turnover is observed to reduce costs and develop strategies to keep and recruit workers to optimize productivity and maximize profits, in the public sector it leads, beyond costs, to the disruption of the provision of social services that operationalize the very function of the State. Nevertheless, the literature on the theme allows us to conclude that its place in the Brazilian public administration is still little recurrent and is more frequent in the Health area (Campos & Malik, 2008; Diógenes et al., 2016; Linhares, 2014; Medeiros et al., 2010; Sancho et al., 2011; Torres, 2015).
In the school context, the incidence of the phenomenon of professional turnover is intertwined with the social function of education and the assurance of the constitutionally-established right, tied to the commitment with implementing a broad, systematic, and intentional process of humanization of the subjects through ownership of certain knowledge, and elements of general culture, transposed to school culture (Silva, 2011). This complex process occurs in the face of a common educational project, forged by intense correlation of social forces, which carries a political-pedagogical dimension, having the broadest participation of subjects2 as a legal premise (Constitution of the Federative Republic of Brazil [Constituição da República Federativa do Brasil], 1988; Guidelines and Bases of National Education Law [Diretrizes e Bases da Educação Nacional], 1996). Thus, it demands collective and constant efforts for its construction and achievement.
Hence, it seems appropriate to think that the lack of a continuous, imputed by a high incidence of turnover in the teaching staff, not only interferes with the purposes of school education but also directly affects the function of the teaching work itself.
Despite the efforts shown in international studies to understand the phenomenon of professional turnover- such as the studies by Ingersoll (2001), Johnson et al. (2005), and Grissom (2011) in the Brazilian educational scenario, it is still poorly investigated. The identification, through a literature research process, of a few studies that consider it as a core element of analysis, supports this statement. Another aspect that this research enables us to observe is that, by and large, like the findings of Ingersoll (2001) for the U.S. context, scientific efforts to understand turnover have established teachers as the analytical unit. The set of Brazilian studies shows, as explanatory references, the predominance of individual characteristics, adjacent to the worker him/herself or his/her direct and individual relationship with the work.
In this study, while recognizing that the decision that leads to turnover comes from each teacher, it is thought that looking at the phenomenon in isolation, limited to the worker and his/her personal characteristics, prevents us from observing it considering the correlation of organizational forces that contribute to its production. For this reason, the methodological approach presented here takes the school as the fundamental unit of analysis.
The questions that guide this paper are: what is the level of teacher turnover in basic education schools? What is the extent of this phenomenon in public and private schools? What are the possible explanatory factors for its incidence?
The research design considers all schools operating in Curitiba-PR in 2016 and it calculates the teacher turnover recorded in 2017. According to the School Census conducted by the National Institute of Educational Studies and Research Anísio Teixeira (Inep)[Instituto Nacional de Estudos e Pesquisas Educacionais Anísio Teixeira], in 2016, the city had 23.6 thousand teachers working in the classrooms of 1,053 basic education schools. The local educational system3 employed 9.7 thousand teachers (41.2%) in 390 schools, which offered 130.4 thousand enrollments in the municipality (30.7%).
We performed the analysis in two stages. In the first one, we calculated the turnover indicator for all teachers and all schools. We compared the results for public school administrative departments and the type of private provider. In the second stage, the local school system was selected to measure the incidence of the phenomenon in a context that supposedly has greater similarity regarding the structuring conditions of the teaching work. It is important to point out that this local system approved the Municipal Law 10.190 (2001) that established a policy of incentives for permanence in schools that had a high turnover of teachers. From 20034 on, the key strategy of this policy was to pay a cash bonus to teachers on top of their starting career salary.
First, the structure of this article is composed of the presentation of the theoretical and empirical framework whose references supported the methodological decisions and guided the analysis of the results. Next, a detailed description in the five stages explains the methodological path. Afterward, it presents the results and the discussion of the proposed indicator application. Finally, the text exposes the concluding remarks.
Theoretical and empirical framework
According to Ingersoll (2001), in conceptual terms, teacher turnover is connected to the leaving of their jobs, which can happen either voluntarily or involuntarily, and, as a rule, it assumes replacement. However, the author emphasizes that frequent research on teacher turnover, in the international context, has observed it primarily under the dimension of leaving the profession/attrition, either by leaving or by retirement. Thus, these studies ignore the data on teachers leaving a school to enter another one, since this movement, called migration, does not affect the systemic picture of occupations. The national studies conducted by Torres (2015) reports this dimension. The author situates it as a less important condition, denoting its more common frequency in productions on public service and teaching work.
The concept of teacher turnover presented by Ingersoll (2001) is the text reference. For the author, turnover means the leaving of teachers from a school, which encompasses leaving the profession, retirement, and migration. Two premises based the choice of this definition. The first is related to the social function of schools and the uniqueness of teachers’ work. Giving the above, it is possible to assume that the incidence of high turnover rates, either because of leaving the profession, retirement, or migration from one school to another, produces similar effects on the operationalization of teachers’ social function and the social labor relations within it. Therefore, it would be inadequate to ignore any of the dimensions that encompass it.
The research objective is related to the second assumption, which is to understand the phenomenon in the context of basic education schools. It is distinguished, therefore, from studies that aim to produce a general and systemic balance of occupations, such as those from the Ministry of Labor and Employment [Ministério do Trabalho e Emprego] (MTE, 2013), and in partnership with the Inter-Union Department of Statistics and Socio-Economic Studies [Departamento Intersindical de Estatística e Estudos Socioeconômicos] (Dieese, 2014a, 2014b) for which turnover is important in the dimension of leaving the profession. Migration was excluded from the analysis.
Another relevant aspect refers to the assumption of replacing teachers when they leave since it is understood that turnover is prejudicial not only because of the departures and replacements in the teaching staff of a school but also because of the gap it opens up for the occurrence of uncovered vacancies. This interpretation, as presented in Table 1 (in the section reserved for the methodological aspects of this article) was crucial to the process of testing and proposing an indicator.
Regarding teacher turnover, Ingersoll (2001) emphasizes the prevalence of the individual dimension, explaining a theoretical body of magnitude, which seeks explanatory factors from the teacher's own characteristics, to categorize a profile with a greater predisposition to leave the profession. The author argues that, although research of this nature has been important for its understanding, the absence of other explanatory factors related to schools´ characteristics and organizational conditions has been prejudicially ignored. This leads to the investigation of the teacher turnover phenomenon as something isolated from its context of origin, which eventually shapes the school as a victim of demographic trends and ignores the possibility of a high concentration of turnover in particular types of schools. For the author, the identification of organizational sources of high turnover would allow us to observe not only staffing problems but also, and especially, weaknesses in reaching the school's goals and in terms of team cohesion.
It is worth noting that studies about the history of the teaching career attribute to teacher mobility, through successive inter-school transfers, a feature of the very constitution of the teaching career (Vicentini & Lugli, 2009). They explain that, at the end of the nineteenth century, teachers, especially in São Paulo, chose the schools where they would teach based on the accumulated score in their career, according to the valuation credited to the school of origin. This score would be associated with the distance of the school from the urban centers. This process resulted in a high degree of teacher turnover in the more isolated schools. Moreover, it would produce a hierarchization among schools and, therefore, raise their degree of social prestige and that of their teachers. If we compare this conclusion with the research findings in the public sector in Campos and Malik (2008), it is possible to observe that the prestige of the organization, even today, relates to low professional turnover rates.
School principals, according to Pereira and Oliveira (2016), point out that teacher turnover comprises of one of the prominent current problems to be faced in 32.6% of Brazilian public schools. Pereira (2017) further states that its incidence is a factor associated with teacher working conditions.
However, the Brazilian educational research scenario still poorly explores the teacher turnover theme. A document survey, which bases this statement, was carried out, by digital means, in the online archive of Brazilian universities and by searching the Brazilian Digital Library of Theses and Dissertations (BDTD) [Biblioteca Digital Brasileira de Teses e Dissertações]. The survey also included the Scientific Electronic Library Online (SciELO), Scientific Information System Redalyc [Revistas Científicas de America Latina, el Caribe, España y Portugal], the Scientific Periodicals Online (SciELO), and the Redalyc System (Red de Revistas Científicas de América Latina e El Caribe, Espanha e Portugal), the Scientific Periodicals Electronic Library (Spell) and Google Scholar. Specific descriptors were used as references (professional turnover, teacher turnover, migration, attrition, departure, and teacher evasion). One of the criteria adopted in this document survey was the selection of research conducted in Brazil that showed the centrality of study on the turnover phenomenon, since many occurrences addressed it peripherally. The selected researches were drawn from the three areas of knowledge: Education (Azevedo, 2012; Cunha, 2015; Pereira & Oliveira, 2016; Silva, 2007); Administration (Siqueira & Alves, 2016); and Economics (Duarte, 2009; Kasmirski, 2012). This classification was supported by the idea that the genesis of the research imprints its own characteristics to the researched phenomenon and, likewise, indicates its relevance in different areas.
Thereby, it is possible to note that the four studies carried out within the scope of Education, even when referring to theories outside the area, maintain articulations, in different degrees, with theoretical and empirical references that emphasize the uniqueness of the teaching profession and the social function of the school.
On the other hand, studies from Economics and Administration discuss the theme starting, essentially, from theoretical references of organizational theories and organizational behavior, conceiving the school as an organization susceptible to generalization. In this sense, they do not capture particular delineations, both concerning the social function of the school and with the singular, immaterial, and interactive nature of the teaching work (Tardif & Lessard, 2014). It is necessary to ponder that frequent changes in the framework of a school imply abdicating the collective, procedural, and continuous character that intentional and planned human development requires. It is also worth noting that the achievement of the school's goals demands the maintenance of a long-term bond between the teacher and the student, to ensure the student's commitment and motivation for daily participation in an immaterial work and the conversion of the social obligation to study into a subjective interest. Moreover, it is necessary to consider that the social function of the school is not restricted to the individual (and sometimes antagonistic) conceptions, aspirations, and decisions of each worker; on the contrary, such function aims, above all, to articulate them, through a process of constant search for possible consensus, to implement a collective and socially assumed commitment to materialize a common educational and social project.
In conceptual terms, although coming from different perspectives, the seven studies are all unanimous in defining teacher turnover on a global level.
In terms of the methodological choices, one study is essentially qualitative (Azevedo, 2012) and the others express quantitative techniques of analysis. Among the studies that use quantitative methods, regarding the analysis unit for the definition of explanatory variables, one analyzes turnover essentially from the organization's perspective; two focus on the workers' individual dimension, two of them cover both dimensions and one looks at the phenomenon from the perspective of the class, articulating it to the researched school and municipality. The research that presents only qualitative methods of analysis associates the phenomenon's incidence with some factors related to the organization and the worker.
This body of research reiterates the assumption that high levels of turnover can cause disruptions in the educational functioning of the institution and teachers’ work. It also provides robustness to the decision to work with the global concept of teacher turnover.
The analysis of these studies, besides guiding part of the decision-making process of this research, seems to validate the need for a path that situates the singularities of the teacher turnover in education in the Brazilian context and, when appropriate, in the public sphere. At this point, it is important to recognize the distinctive characteristics of the public sphere concerning the private one regarding the purposes and work relations, which are regulated by their own statute and not by a contract. The public sector, unlike the intention of generating profit, involves complex relationships, both from the point of view of remuneration and time allocated to work and power relations. Furthermore, it is subordinated to the public interest to ensure rights that cannot be violated or conceived as privileges (Supiot, 1995).
Because of the prevalence of efforts, in the researches surveyed, to observe the teacher's individual aspects as factors associated with the incidence of teacher turnover - and, therefore, of the design of a profile prone to it -, it is possible to reiterate the relevance of research that broadens its observation, in the school dimension.
At last, the efforts made to measure teacher turnover provide a “window” of opportunity for the sophistication of related indicators.
Methodological issues
The development of the teacher turnover measure at the school level took place in five stages. The first phase was to define the concept of teacher turnover, which, while remaining consistent with the theoretical assumptions, guided the subsequent methodological procedures.
The second stage comprised gathering methods (strategies and formulas) for calculating the indicator. At this point, given the limited empirical support available, we also consulted researches that analyzed turnover in other professional categories in the public sector. Thus, the theoretical and empirical background raised - expressed in the studies of Campos and Malik (2008), Medeiros et al. (2010), Sancho et al. (2011), Paranaíba (2014), Torres (2015), and Diógenes et al. (2016) - was added to the research repertoire on teacher turnover, related to the scientific productions of Pereira and Oliveira (2016), Cunha (2015), Kasmirski (2012), and Duarte (2009). Similarly, the measuring strategies used by MTE and the Brazilian Institute of Geography and Statistics (IBGE) [Instituto Brasileiro de Geografia e Estatística] in the Monthly Industrial Survey of Employment and Wages (PIMES) [Pesquisa Industrial Mensal de Emprego e Salário] were considered, due to the robustness of the efforts for the visibility of the phenomenon at the national level. Finally, we also considered Nomura and Gaidzinski’s (2005) calculation method for the Health area.
Formulas for measuring teacher turnover
After analyzing these studies, in the third stage, we selected five formulas for testing the results based on hypothetical situations of teacher turnover in schools. The empirical test showed that, despite their similarities, none of the formulas generated results that accurately captured the concept of teacher turnover adopted in this study. Therefore, we proposed new formula. Figure 1 shows the six formulas under comparison.
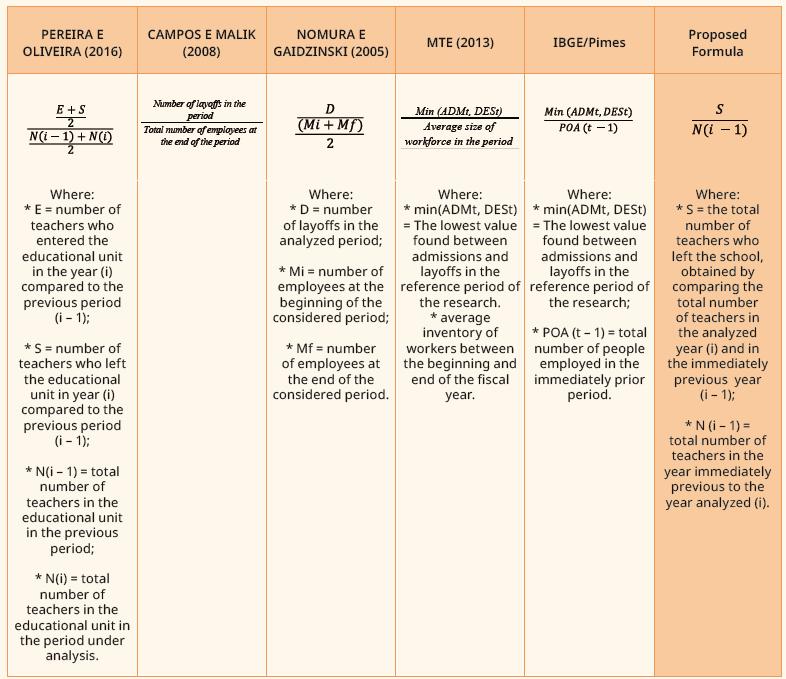
Source: Developed by the authors.
Note: (1) The mathematical notations of the formulas are presented according to the original works.
FIGURE 1 FORMULAS SELECTED TO CALCULATE TEACHER TURNOVER1
The understanding that teacher turnover indicator should capture only the departure movement based the formula proposed in this study. Therefore, it considers the number of departures in the reference year of the analysis in relation to the total number of teachers in the comparison base year (previous year). The rate is calculated by a ratio between the number of teachers who, in the reference year, left the schools they worked in the previous year. The result is multiplied by 100 to express it as a perceptual rate.
Testing the validity of formulas
Stage four comprised the performance of validity tests. The purpose of the procedure was to verify which formula presented the most reliable numerical result for the concept of turnover adopted in the research.5 In this stage, two concerns were distressing. One was not to compute the number of entries in the production of the indicator, given the concept of teacher turnover and the possibility that by incorporating entry data in the calculation form, information could be generated that attributed teacher turnover to situations where there was only entry (absence of departure). The other one was to build an indicator that did not reduce turnover rates when there was no replacement of teaching staff. For this purpose, we drew 14 scenarios of school reality up for the following situations of teachers’ departures and entries:
departures and entries in equivalent quantities, producing turnover without changing the total teaching staff of the school;
fewer departure than entries, producing turnover in a scenario of expansion of the teaching staff. In this situation, for analysis purposes, it was also generated a situation in which there are no departures, only entries;
more departures than entries, explaining a scenario where turnover is followed by the non-replacement of current vacancies, which generates a deficit in the overall teaching staff of the school.
Table 1 shows the test results.
TABLE 1 TEACHER TURNOVER RATES IN HYPOTHETICAL SITUATIONS BY DIFFERENT FORMULAS
| TEACHER TURNOVER RATES (%) | |||||||||||
|---|---|---|---|---|---|---|---|---|---|---|---|
| HYPOTHETICAL SITUATION | SCHOOL | TOTAL TEACHERS - year (i - 1) | DEPARTURES | ENTRIES | TOTAL TEACHERS - year (i) | PEREIRA E OLIVEIRA (2016) | CAMPOS E MALIK (2008) | NOMURA E GAIDZINSKI (2005) | MTE (2013)* | IBGE/Pimes* | NEW PROPOSED INDICATOR |
| 1. Departures and entries in equivalent quantities | A | 60 | 5 | 5 | 60 | 8.3 | 8.3 | 8.3 | 8.3 | 8.3 | 8.3 |
| B | 25 | 2 | 2 | 25 | 8.0 | 8.0 | 8.0 | 8.0 | 8.0 | 8.0 | |
| C | 30 | 0 | 0 | 30 | 0.0 | 0.0 | 0.0 | 0.0 | 0.0 | 0.0 | |
| D | 40 | 4 | 4 | 40 | 10.0 | 10.0 | 10.0 | 10.0 | 10.0 | 10.0 | |
| E | 50 | 10 | 10 | 50 | 20.0 | 20.0 | 20.0 | 20.0 | 20.0 | 20.0 | |
| 2. Fewer departure than entries | F | 60 | 5 | 13 | 68 | 14.1 | 7.4 | 7.8 | 7.8 | 8.3 | 8.3 |
| G | 25 | 2 | 7 | 30 | 16.4 | 6.7 | 7.3 | 7.3 | 8.0 | 8.0 | |
| H | 30 | 0 | 5 | 35 | 7.7 | 0.0 | 0.0 | 0.0 | 0.0 | 0.0 | |
| I | 40 | 4 | 8 | 44 | 14.3 | 9.1 | 9.5 | 9.5 | 10.0 | 10.0 | |
| J | 50 | 10 | 12 | 52 | 21.6 | 19.2 | 19.6 | 19.6 | 20.0 | 20.0 | |
| 3. More departures than entries | L | 60 | 5 | 2 | 57 | 6.0 | 8.8 | 8.5 | 3.4 | 3.3 | 8.3 |
| M | 25 | 2 | 0 | 23 | 4.2 | 8.7 | 8.3 | 0.0 | 0.0 | 8.0 | |
| N | 40 | 4 | 2 | 38 | 7.7 | 10.5 | 10.3 | 5.1 | 5.0 | 10.0 | |
| O | 50 | 10 | 3 | 43 | 14.0 | 23.3 | 21.5 | 6.5 | 6.0 | 20.0 | |
Source: Developed by the authors.
Note: * These percentages, when calculated in the context of the MTE (2013) and IBGE, are preceded by analyses on the indicative of replacements, in order to characterize the contraction scenario (when the number of departures is higher than the number of entries) or expansion (when the number of departures is lower than the number of entries).
Concerning the first hypothetical situation, based on the obtained results, it is possible to infer that the six used formulas present equal rates in situations of equivalence between departures and entries.
Regarding the second hypothetical situation, in which the incidence of turnover occurs when fewer people depart than entering, the results of the indicator presented by Pereira and Oliveira (2016) are outstanding. The formula's sensitivity, which captures the increase in teaching staff as turnover, supersizes turnover rates even when there are no departures (as in school “H”). It is known that there is, in some situations, a demand for an increase in the teaching staff because of the reorganization of pedagogical work. This happened in many Brazilian public school systems as a result of the expansion of the total workload of working hours in accordance with Law 11.738 (2008). According to this formula, the increase in the number of professionals on the staff, without the departure of the teachers who were already there, is considered a turnover.
Even though the entry of teachers into a school may refer to migration, taken as one of the phenomenon's dimensions, it is necessary to consider that its origin is not only due to internal movement, but may also arise from the entry into the profession, which does not characterize teacher turnover.
When comparing the other rates for this second condition, it is possible to observe that the lowest turnover percentages in relation to the expansion of the teaching staff are evidenced with the indicator proposed by Campos and Malik (2008), preceded by those proposed by Nomura and Gaidzinski (2005), and by MTE, followed by the propositions used by IBGE/PIMES and the one built in this research.
Regarding Campos and Malik's (2008) proposition, although the percentages for the turnover before the increase are the lowest in the overall picture, a comparison of the percentage generated by the same formula for schools with the same teaching staff in year i-1, and the same number of departures (for example, schools “A” and “F”), allows us to observe that this formula ends up fairly subtly way capturing the expansion of the teaching staff, generating different degrees of turnover for equivalent situations in the aforementioned terms.
The same happens with the other formulas, except for the one proposed in this research, which keeps the same results for all situations with equivalence related to the total number of teaching staff in year i-1 and the number of departures, even in the third condition.
As on the results observed in the third condition, forged for a scenario in which departures are greater than entries, thus generating a deficit in the overall school staff, we must recognize the limits of the indicators’ capturing. If the focus of turnover is on departures, the replacement of vacancies is not part of the measurement. Nevertheless, it is necessary to think about its sensitivity when departures are made without the assumed substitution.
For that condition, the results of the calculations used by MTE, by IBGE/PIMES, and by Pereira and Oliveira (2016), if compared to their own results individually, show the reduction of turnover rates in the face of the non-replacement of departures (for example, schools “B” and “M”).
In the MTE and IBGE/PIMES’ cases, the calculation of the turnover percentages is preceded by the analysis of the smallest values between entries and departures to categorize the scenario, in either contraction or expansion.
Nevertheless, since it is not desirable that turnover rates fall only because of departure without replacement, the risk of such results for the view on teacher turnover lies in the possibility that they may induce misinterpretations of reality.
It is worth noting that, compared to the rates found in similar situations (total number of teachers in year i-1 and departures), the results expressed in this condition for Nomura and Gaidzinski (2005), and for Campos and Malik (2008) show a subtle increase in the rates when no substitution occurs.
It emerges from this process of survey, study, and testing that the comparison established between the results generated in each formula, individually, and the results for the three situations broken down into 14 scenarios, demonstrates significant consistency of the indicator proposed in this research with the concept of turnover adopted. This conclusion is based on the understanding that, given the same quantities of teachers in year i-1 and in the departures, the turnover percentage is not affected either by the increasing in staff or by its deficit. The results of schools “D”, “I” and “N” prove this conclusion. All three have 40 teachers. In all of them, four teachers left school. Applying the formula proposed in this article, the three schools express equal turnover rates, since they differ only in the number of entries. This is an important aspect to be observed, regarding the increased degrees of “validity”, “reliability”, and “sensitivity” of social indicators (Jannuzzi, 2005). Therefore, the testing process results supported the choice of the indicator proposed in this paper for application to the empirical data from Curitiba.
Procedures for calculating teacher turnover
The fifth and last stage of the methodological path comprised the procedures for applying the formula proposed in the previous stage and, finally, the calculation of turnover at the school level.
The data source used was the microdata from the School Census (Inep, 2017, 2018) specifically the teachers’ and schools’ databases, for the years 2016 and 2017. Using such a source gives the indicator relevant methodological attributes like reliability, population coverage, periodicity in its updating, and operational feasibility to obtain it.6
It is also worth mentioning that this article used data from the subject population (teachers) and from the universe of schools in Curitiba-PR featured in the School Census.
IBM SPSS Statistics software helped to perform the data imputation, processing, and analysis procedures. Three filters were applied to the teachers’ database. The first one to restrict the analysis to the municipality of interest: Curitiba-PR (variable co_municipality = 4106902). The next two filters were used to select the teachers according to the functions they perform in the school and the classes they attend. The categories conventionally chosen by Inep to define a “typical teacher” were used.7 Therefore, the filter for the teaching position covered the categories “teacher” and “Full Teacher - tutor coordinator (of a module or subject) - distance education” and the filter for the type of class in which they work covered the categories “Not applicable”, “Hospital class”, “Social-educational service unit” and “Prison unit”.8
Then it was necessary to aggregate the data (aggregate command) by the variables “co_private_individual” and “co_entity” (in this order). This procedure was necessary because the original database has “teaching profession” as a unit of analysis (that is, a teacher's code can be repeated as many times as the number of classes he/she teaches). Such procedure removes the repetitions from the classes and attributes each teacher to the schools in which he/she teaches (which can be one or more) and it creates a new database where the teacher is the analysis unit. We conducted separately this procedure for 2016 and 2017 data.
Afterward, the two databases aggregated at the teacher level (2016 and 2017) were merged (merge files command) into a single database, taking the unique identifier codes assigned by Inep to teachers and schools (variables “co_private_individual” and “co_entity”) in that order as key variables.9 The 2016 database was taken as the base year. Thus, the variable “year” with the content “2016” was renamed as “base_year”. From the merge, this database got a new variable named “year_comparison”. The new variable had two possible contents: “2017”, in cases where the code of the teacher who was in the school in 2016 was found in the 2017 database; or the value “zero” if the teacher's code was not found in the same school in 2017.
This organization allowed, in the sequence, the calculation of the variable “teacher turnover”. Based on the definition of turnover as departure, the following operation was performed for each teacher:
(a) If “base_year” = “2016” & “year_comparison” = 0, then turnover = “yes”;
(b) If “base_year” = “2016” & “year_comparison” = “2017”, then turnover = “no”.
The result of this procedure indicated the incidence or not of turnover per teacher for the year 2017. The result of the procedures up to this point allowed the analysis of turnover at the teacher level, as presented in tables 2 and 3 of the results section.
Afterward, another database was generated with the total number of teachers in 2016 and the number of departures in 2017 per school. This was done through a new process of aggregation of the database of teachers by the “co_school” variable. The formula proposed in this paper was applied to the database with aggregate numbers by the school to obtain the teacher turnover rate by the school. The rate at the school level subsidized the results presented in Tables 4, 5, 6 and, Graph 1 in the results section.
Presentation of results
We presented the results using descriptive statistical analysis. Since this was not a sample study, inferential statistical tests were not carried out.
To identify explanatory factors for the incidence of teacher turnover in the municipality of Curitiba-PR, we presented the turnover rate in perspective with some variables which described teachers’ characteristics, working conditions, and context. We considered the analyses at the school level the variables “administrative dependency”, “employment relationship”, and “grade level” (tables 2 and 3 in the next section). The analyses at the school level were considered the variables “administrative dependency”, “type of school unit”, “distance from the city's ground zero”, “hard-to-staff policy”, and “percentage of bonus. The last four variables are specific to the municipal network of Curitiba-PR and were obtained through a document survey in internal norms of the Municipal Secretariat of Education (tables 4, 5, 6, and Graph 1 in the results section).
Finally, considering the importance of analyzing public policies, and social and organizational phenomena over time, we calculated the turnover rate of municipal schools in a five-year historical series (2013 to 2017). The purpose was to verify whether the proposed indicator has important methodological attributes for analyses that consider the variable “time”, namely: “sensitivity to expected actions” and “comparability of the historical series” (Jannuzzi, 2005). See Graph 1 in the results section.
Results and discussion
This section presents the results that aim to answer questions regarding the level of teacher turnover in basic education schools, the magnitude of the phenomenon between public and private schools, and the discussion of some explanatory factors. Table 2 presents the turnover rates by public administrative branch and by type of private maintainer for the municipality of Curitiba-PR. Although the research unit of analysis refers to schools, the results of this table show values at the level of teachers to allow for the analysis of the magnitude of the phenomenon with the size of the staff of each sphere analyzed.
TABLE 2 TEACHER TURNOVER RATE BY ADMINISTRATIVE DEPENDENCY AND TYPE OF PRIVATE SPONSOR, CURITIBA-PR, 2017 (ANALYSIS OF THE TEACHERS’ LEVEL)
| Administrative dependence | Number of teachers in 2016 | Number of teachers who departed in 2017 from the schools they worked in 2016 | Turnover rate 2017 |
|---|---|---|---|
| Federal | 379 | 46 |
 12.1% 12.1% |
| State | 8,811 | 4,697 |
 53.3% 53.3% |
| Municipal | 10,400 | 2,457 |
 23.6% 23.6% |
| Private partner school | 1,352 | 447 |
 33.1% 33.1% |
| Private community, confessional or philanthropic school | 976 | 227 |
 23.3% 23.3% |
| Private profit-making school | 6,548 | 1,919 |
 29.3% 29.3% |
| Total | 28,466 | 9,793 |
 34.4% 34.4% |
Source: Developed by the authors from the microdata of the 2016 and 2017 School Census/Inep.
The teacher turnover rate in the city of Curitiba in 2017 was 34.4%, according to Table 2. This rate is close to the turnover rate of the overall workforce in Brazil (35.3%) reported by the MTE (MTE, 2013) and that obtained by Dieese (Dieese, 2014a) for the turnover of teaching professionals (31.5%). Even though the context and the work on which it focuses and the effects and ways of measuring the phenomenon differ, safeguarding the proper distances, this comparison allows us to situate the results found in a broader scenario.
The stratification by the administrative department shows that the phenomenon is more common among teachers in the state public school network (53.3%). The municipal network which has the largest number of teachers among the categories analyzed (36.5% of the total) has a significantly lower turnover (23.6%). The federal network has the lowest rate observed in 2017 (12.1%). Private school categories have a group of teachers of quite a distinct size. For-profit schools employ 23% of the city's teaching workforce and showed a turnover of 29.3%. The partner institutions had a teacher turnover rate of 33.1%. To summarize, by adding the number of teachers in 2016 and departures in 2017, it was found that: public schools have a combined turnover of 36.7%; and private schools, 29.2%. The higher rate among public schools is clearly influenced by the state network, which has a large part of its personnel composed of teachers with temporary contracts (Table 3). Either way, the findings in Curitiba show a difference from Ingersoll´s (2001) research on the North American context, in which the private sphere showed higher turnover rates. The overall rate presented by the author (13.2%) was also much lower.
Aiming specifically at the municipal dependency, there is a similarity to the rate achieved in Cunha’s (2015) study for the municipal school network in Rio de Janeiro (from 20 to 30%).
Continuing the same unit of analysis, Table 3 presents a deeper analysis of the findings with disaggregation of the turnover rate by type of employment relationship and stage/modality of education in which the teachers work.
Even though the type of governmental/stable/tenured contract is predominant in Curitiba’s public network (82.4%), the state school network has almost 40% of its teachers on a temporary basis. This temporary contracting modality called PSS (Simplified Selective Process) implies periodic voluntary and involuntary departures of these teachers from the state schools. Not by chance, the turnover rate among temporary staff is quite high (83.3%). In addition, the temporary contract produces work relations different from those of the professionals with whom these teachers work simultaneously. If, as shown earlier, the statutory personnel´s professional consciousness is linked to the recognition of obligations arising from a professional statute, on the other hand, the contracts subject this professional consciousness to a logic of obedience to the employer (Supiot, 1995). These contracts further subject work to the logic of the market, changing power relations, remuneration, and time allocated to work in the sense of continuity of function (Supiot, 1995).
Recognizing this strong duality between the type of contract and its consequences, including the collective work to accomplish a common educational project and the need for team cohesion within schools, leads us to think about the fact that the rate among stable teachers in the state network (34.8%) continues to be the highest among public school networks in Curitiba.
TABLE 3 TEACHER TURNOVER RATE BY CHARACTERISTICS, CONTEXT AND WORKING CONDITIONS, CURITIBA-PR, 2016 AND 2017 (TEACHERS’ LEVEL ANALYSIS)
| Characteristics | TOTAL | Federal | State | Municipal | Private partner school | Private community. confessional or philanthropic school | Private profit-making school | |||||||||
|---|---|---|---|---|---|---|---|---|---|---|---|---|---|---|---|---|
| Frequency | Turnover | Frequency | Turnover | Frequency | Turnover | Frequency | Turnover | Frequency | Turnover | Frequency | Turnover | Frequency | Turnover | |||
| N | % | % | % | % | % | % | % | % | % | % | % | % | % | % | ||
| Employment relationship | - | |||||||||||||||
| 1 - Governmental/stable/tenured contract | 16,156 | 82.4 |
 27.1 27.1 |
84.3 |
 11.5 11.5 |
61.9 |
 34.8 34.8 |
99.8 |
 23.6 23.6 |
|||||||
| 2 - Temporary contract | 3,404 | 17.4 |
 82.4 82.4 |
9.7 |
 24.3 24.3 |
37.9 |
 83.3 83.3 |
0.2 |
 40.9 40.9 |
|||||||
| 3 - Third-Party Contract | 15 | 0.1 |
 86.7 86.7 |
0.3 | - | 0.2 |
 92.9 92.9 |
- | ||||||||
| 4 - CLT Contract (Brazilian Consolidation of Labor Laws) | 25 | 0.1 |
 8.0 8.0 |
5.8 | - | 0.0 |
 66.7 66.7 |
- | ||||||||
| Total | 19,600 | 100.0 |
 36.8 36.8 |
100.0 |
 12.0 12.0 |
100.0 |
 53.3 53.3 |
100.0 |
 23.6 23.6 |
|||||||
| Stage / Modality | - | |||||||||||||||
| Daycare | 5,927 | 18.0 |
 25.4 25.4 |
3.9 |
 6.7 6.7 |
- | 39.2 |
 23.7 23.7 |
38.7 |
 29.3 29.3 |
7.9 |
 25.8 25.8 |
13.2 |
 30.5 30.5 |
||
| Pre-School* | 1,405 | 4.3 |
 26.3 26.3 |
- | - | - | 16.5 |
 22.3 22.3 |
11.0 |
 16.2 16.2 |
13.8 |
 28.4 28.4 |
||||
| Elementary School - Early Years | 7,822 | 23.8 |
 22.9 22.9 |
- | - | 50.3 |
 22.8 22.8 |
2.9 |
 35.9 35.9 |
27.1 |
 21.2 21.2 |
25.7 |
 23.4 23.4 |
|||
| Elementary School - Last Years | 7,318 | 22.2 |
 40.9 40.9 |
15.5 |
 28.8 28.8 |
42.5 |
 50.7 50.7 |
4.9 |
 21.9 21.9 |
2.1 |
 24.1 24.1 |
24.7 |
 17.1 17.1 |
20.3 |
 21.7 21.7 |
|
| High School | 5,562 | 16.9 |
 42.3 42.3 |
16.5 |
 9.5 9.5 |
35.2 |
 48.6 48.6 |
- | - | 15.8 |
 18.2 18.2 |
16.8 |
 27.3 27.3 |
|||
| EJA (youth and adult education - YAE) | 1,225 | 3.7 |
 47.7 47.7 |
- | 8.4 |
 49.5 49.5 |
1.0 |
 27.0 27.0 |
- | - | 1.9 |
 51.7 51.7 |
||||
| Vocational Education | 2,536 | 7.7 |
 45.0 45.0 |
64.0 |
 9.4 9.4 |
13.0 |
 47.3 47.3 |
0.2 |
 76.5 76.5 |
- | 13.6 |
 46.6 46.6 |
8.2 |
 52.3 52.3 |
||
| Special Needs Education | 1,121 | 3.4 |
 35.3 35.3 |
- | 0,8 |
 53.3 53.3 |
4.4 |
 24.8 24.8 |
39.8 |
 41.6 41.6 |
- | 0.0 |
 100.0 100.0 |
|||
| Total | 32,916 | 100.0 |
 33.8 33.8 |
100.0 |
 12.3 12.3 |
100.0 |
 49.4 49.4 |
100.0 |
 23.3 23.3 |
100.0 |
 33.1 33.1 |
100.0 |
 23.0 23.0 |
100.0 |
 28.3 28.3 |
|
Source: Developed by the authors from the microdata of the 2016 and 2017 School Census/Inep.
Note: (*) The data for preschool teachers in Curitiba´s municipal network were reported in the 2016 School Census as "nursery". THerefore, there is no information for this segment.
Such finding is consistent with the results of Medeiros et al. (2010) and Linhares, (2014), which express a relationship between professional turnover in the public sector and the precariousness of employment relationships. Sancho et al. (2011) also explain the relationship between contract instability and turnover incidence, observing it at higher levels when related to non-statutory employment contracts in public administration.
In terms of teacher turnover in the different stages/modalities of education, Table 3 shows that in the aggregate of the teaching staff in the municipality (regardless of administrative dependency and private school category), the rate varies from 22.9% (elementary school - early years) to 47.7% (Youth and Adult Education - YAE). The numbers show that the context of the education networks and categories of private schools strongly influence this variation. Teachers working in the nursery segment, for example, have a turnover rate of 6.7% in federal schools, 23.7% in the Municipal Center for Early Childhood Education (CMEIs)[Centro Municipal de Educação Infantil], and 30.5% in for-profit schools. The data reveal a great discrepancy in teachers’ turnover in the early (22.9%) and last years of elementary school (40.9%). The distribution of responsibility explained this for the supply of these educational stages in the State of Paraná between state and municipal schools. State network handles the public offer of the last years of education, and in this network, the turnover rate is 50.7%. In fact, the turnover rate is higher than 40% in all stages/modalities that are mostly offered by the state network (High School = 48.6% and EJA/YAE = 49.6%). It is worth noting that Vocational Education has a general turnover rate of 45%. However, this is the modality in which the largest number of teachers in federal schools work, with a turnover rate of 9.4%. In the state schools, the turnover rate is 47.3%; in community, confessional, and philanthropic schools, it is 46.6%; and in for-profit schools, it reaches 52.3%. In Special Needs Education, the overall rate is 35.3%. In this modality, 39.8% of the teachers of partner institutions work, and in these institutions, the turnover is 41.6%.
Nevertheless, as previously mentioned, a broader understanding of teacher turnover requires observing it from the point of view of the correlation of organizational forces that contribute to its production. Therefore, the following investigations take the school as the analysis unit. Table 4 presents a set of descriptive measures of teacher turnover rate by school for each category considered in the analysis.
TABLE 4 TEACHER TURNOVER RATE BY ADMINISTRATIVE DEPENDENCY AND TYPE OF PRIVATE SPONSOR, CURITIBA-PR, 2017 (SCHOOL LEVEL ANALYSIS)
| Descriptive measures | values | Dependência administrativa | |||||
|---|---|---|---|---|---|---|---|
| Federal | State | Municipal | Private partner school | Private community, confessional or philanthropic school | Private For-profit schools school | ||
| Number of schools | N | 5 | 163 | 390 | 109 | 28 | 358 |
| Mean | % | 12.3 | 55.4 | 24.9 | 33.3 | 22.2 | 35.1 |
| Standard deviation | % | 8.1 | 12.1 | 14.1 | 23.7 | 12.3 | 28.5 |
| Coefficient of Variation | % | 65.9 | 21.9 | 56.8 | 70.9 | 55.4 | 81.2 |
| Minimum | % | 0.9 | 17.3 | 0.0 | 0.0 | 0.0 | 0.0 |
| 1st quartile | % | 3.8 | 48.7 | 16.7 | 14.3 | 14.3 | 14.6 |
| Median | % | 16.5 | 55.4 | 22.2 | 33.3 | 20.0 | 29.1 |
| 3rd quartile | % | 18.7 | 61.7 | 29.7 | 50.0 | 25.0 | 50.0 |
| Maximum | % | 19.0 | 100.0 | 100.0 | 100.0 | 50.0 | 100.0 |
Source: Developed by the authors from Censo Escolar/Inep 2016 and 2017 microdata.
The data reveals that turnover is highest in the 163 Curitiba-based state schools. In 2017, these schools had an average turnover of 55.4%. Approximately 75% of schools have rates higher than 48.7% (first quartile value). It is also in this network that the phenomenon is more homogeneous (Coefficient of Variation - CV = 21.9%). In contrast, the lowest rates were found in the five federal schools in Curitiba (12.3%). In these schools, the range of the rate oscillated between 0.9% and 19%. The municipal network has a much larger number of units than the other public networks in the city (390), and the average turnover rate was 24.9% in the year under study. Even though there is significant heterogeneity in the distribution of values (CV = 56.8%), it is important to consider that turnover in this network is significantly lower than in the state network and in private schools (partnership and for-profit). Approximately 75% of municipal schools had a turnover of up to 29.7% (third quartile values).
Regarding the private sector, the data in Table 4 show that the three analyzed categories have distinct characteristics, starting with the number of schools. It is notable that, in the year under analysis, this sector employed 31.2% of teachers and offered 34.2% of Curitiba's basic education enrollments (27.2% of enrollments in for-profit schools). In 2017, turnover was of similar magnitude among for-profit and partner schools (average of 33.1% and 35.1%, respectively). Turnover rates higher than 50% in at least 25% of these schools (see third quartile values) are a significant highlighted incidence. On the other hand, emphasizing the heterogeneity of these schools, it is possible to observe schools with no incidence of turnover, and at least 25% of them, with turnover rates lower than 15%. Finally, the numbers reveal that the best performance on teacher turnover, in the private sector, is among the community, confessional and philanthropic schools (non-partner school). The average for the 28 schools in this category is 22.2%, and approximately 75% of these schools have turnover rates of up to 25%.
The data reported in Table 4, for the national scenario, diverge from Pereira and Oliveira (2016) results, which identify the municipal administrative dependency as the public sphere with the highest median value and the most dispersed teacher turnover rates.
Moreover, the meaning attributed to the obtained rates needs a closer approximation with the elements of a particular reality, to broaden the spectrum of the phenomenon understanding, and aiming to increase the explanatory potential about its incidence in the public school system. Therefore, in this research, we chose to define Curitiba's Municipal Education Network as the universe of explanatory investigation.
It is necessary to consider that Curitiba´s municipal network is composed of two types of teaching units: Municipal Center for Early Childhood Education (CMEI) and elementary schools. In terms of the offering, the CMEIs include enrollments only in early childhood education (mostly nursery school), while schools can offer preschool and elementary school (predominantly early years). The teachers who work in these units, although the common entrance criterion is a public examination of tests and titles, are amid a historical duality that segments them into two distinct careers: one called “teaching professional” and another, more recent, called Early Childhood Education teacher. Even though the “Early Childhood Education teacher” career gives the teacher a professional status not foreseen for the previous “educator” career, this duality maintains the absence of equality in working conditions among teachers in the same school system. This culminates in the distinction, not only of minimum training requirements for admission and workplace but also between career plans, weekly workday, time allotted to activity hours,10 and remuneration. The main differences between these careers are presented in Figure 2.
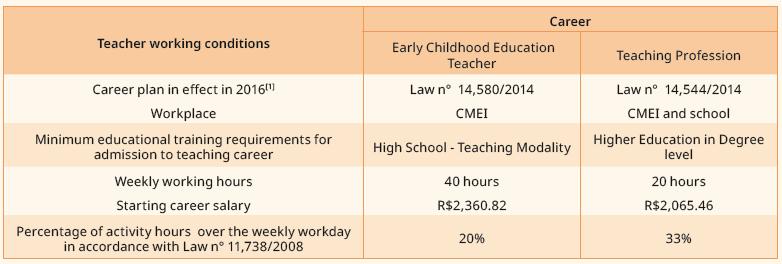
Source: Developed by the authors based on Municipal Law n° 14,580 (2014) and Municipal Law n° 14.544 (2014).
Note: [1] It is worth noting that both career plans, in effect until 2017, are suspended by Municipal Law n° 15,043 (2017) whose scope extends the suspension to all career plans of the Curitiba municipal civil service.
FIGURE 2 COMPARATIVE BETWEEN TEACHING CAREERS IN THE MUNICIPAL EDUCATION NETWORK OF CURITIBA, 2016
In the face of this, it seems essential to examine the incidence of turnover disaggregated by unit type. In 2017, the CMEIs had a higher average turnover rate and higher dispersion than the schools. Table 5 is the base for this inference.
Moreover, the values for CMEIs from the third quartile surpass the incidence obtained among schools, reaching the maximum value of 100%, while the limit for schools does not exceed 72%.
TABLE 5 TEACHER TURNOVER RATE BY SCHOOL UNIT TYPE, CURITIBA MUNICIPAL NETWORK, 2017 (ANALYSIS OF THE LEVEL OF SCHOOLS)
| Descriptive measures | values | CMEI | SCHOOL |
|---|---|---|---|
| Number of sites | N | 205 | 185 |
| Mean | % | 25.4 | 24.3 |
| Standard deviation | % | 16.7 | 10.7 |
| Coefficient of Variation | % | 65.6 | 43.8 |
| Minimum | % | 0.0 | 0.0 |
| 1st quartile | % | 15.6 | 18.1 |
| Median | % | 21.1 | 22.6 |
| 3rd quartile | % | 30.4 | 29.3 |
| Maximum | % | 100.0 | 72.0 |
Source: Developed by the authors from Censo Escolar/Inep 2016 and 2017 microdata.
Graph 1 presents a brief historical series in an attempt to situate these findings in a broader time frame. Observing the turnover trajectory for each type of teaching unit shows a gradual drop in rates from 2013 to 2017, except for 2016.
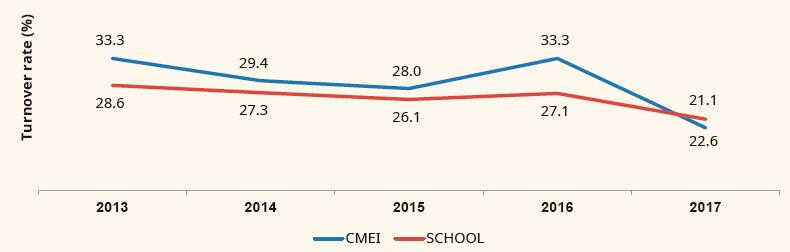
Source: Developed by the authors based on School Census/Inep microdata from 2012 to 2017.
Notes:
(1) Teachers registered as “educational assistant/assistant” in the 2013 to 2015 School Censuses were included in this analysis given their frequent occurrence on the occasion of the “educator” career.
(2) The turnover rate was calculated by the school. The values presented are the median rate for schools in each category in the analyzed years.
GRAPH 1 TEACHER TURNOVER RATE OF SCHOOLS BY TEACHING UNIT TYPE, MUNICIPAL NETWORK OF CURITIBA1, 2013 TO 2017 (MEDIAN VALUES)2
Likewise, the comparative analysis between CMEIs and schools allows us to observe a movement of progressive closeness between the rates, again except for 2016. However, until 2016, the median rates for CMEIs were higher, reaching a value 20% higher than that obtained for schools.
Given these results, it is possible to infer that the distinguishing marks for the characteristics of each type of teaching unit and the teachers’ working conditions, including those related to the careers of the teachers who work there, may have some explanatory weight on the incidence of teacher turnover, since the findings, in historical series, reveal its highest magnitude in CMEI.
Schools that are more distant from the city's more central areas and the implementation of an incentive policy to stay in school employing monetary bonuses to teachers are other potential explanatory factors.
As for the location of units in relation to the city's most central areas, its objectification takes place through the municipal education network by a metric assigned to each school/CMEI, which is used to accumulate the teacher's score to compete in the annual process of internal relocation among teaching units. This measure, called weight value (WV), ranges from 1 to 8, 1 being assigned to the most central schools and its increasing progression associated with the increasing distance of the unit in relation to the city's ground zero (downtown).
On the other hand, the policy of incentives to remain in schools, regulated in 2001 and put into effect starting in 2003, was instituted because of the difficulty in occupying positions and due to the high turnover of professional personnel in certain teaching units. This policy provides, through a decree, the definition of units considered difficult to be occupied. For these units are expected the payment of a percentage cash bonus to be paid to the public employees for as long as they remain in the unit. In 2016, the units covered by the policy represented about 34% of the total number of schools and CMEIs observed. This bonus, which induces permanence in these schools, varies from 10% to 30% of the starting career salary.
Table 6 presents the turnover rates for these variables. Its results show that there is a complex relationship between turnover rate and distance, implementation of hard-to-staff policy, and bonus percentages.
TABLE 6 TEACHER TURNOVER RATE, BY UNIT TYPE AND DISTANCE FROM GROUND ZERO AND % OF BONUSES POLICY, MUNICIPAL NETWORK OF CURITIBA, 2017 (SCHOOL-LEVEL ANALYSIS)
| Aspect | Type of teaching unit | |||||
|---|---|---|---|---|---|---|
| CMEI | School | |||||
| N | Mean (%) | Standard deviation (%) | N | Mean (%) | Standard deviation (%) | |
| Total teaching units | 205 |
 25.4 25.4
|
16.7 | 185 |
 24.3 24.3
|
10.7 |
| Distance from city's ground zero (WP) | ||||||
| 1 | 2 |
 22.7 22.7 |
10.3 | 2 |
 32.4 32.4 |
7.2 |
| 2 | 10 |
 32.6 32.6 |
24.5 | 17 |
 29.7 29.7 |
11.9 |
| 3 | 25 |
 22.9 22.9 |
13.9 | 37 |
 23.6 23.6 |
11.1 |
| 4 | 62 |
 22.7 22.7 |
14.8 | 42 |
 22.4 22.4 |
11.0 |
| 5 | 47 |
 28.3 28.3 |
18.3 | 40 |
 25.0 25.0 |
10.4 |
| 6 | 30 |
 23.9 23.9 |
13.0 | 22 |
 24.7 24.7 |
9.9 |
| 7 | 12 |
 23.6 23.6 |
19.2 | 10 |
 22.6 22.6 |
11.8 |
| 8 | 17 |
 31.0 31.0 |
20.6 | 15 |
 22.9 22.9 |
7.7 |
| Implementation of hard-to-staff policy | ||||||
| Não | 137 |
 27.8 27.8 |
19.0 | 122 |
 25.1 25.1 |
11.6 |
| Sim | 68 |
 20.6 20.6 |
9.1 | 63 |
 22.9 22.9 |
8.6 |
| Percentage of bonuses - permanence in school | ||||||
| 0 | 137 |
 27.8 27.8 |
19.0 | 122 |
 25.1 25.1 |
11.6 |
| 10% | 28 |
 22.0 22.0 |
9.0 | 25 |
 23.2 23.2 |
8.2 |
| 20% | 23 |
 17.2 17.2 |
7.5 | 21 |
 22.7 22.7 |
10.2 |
| 30% | 17 |
 23.0 23.0 |
10.4 | 17 |
 22.6 22.6 |
7.3 |
Source: Developed by the authors based on data obtained from documents and regulations issued by the Municipal Secretariat of Education (SME) and microdata from the 2016 and 2017 School Census.
Concerning distance, it is important to emphasize that among those teaching units with weighted values from 1 to 3, located in more central regions of the city, only 7.7% have the hard-to-staff policy implemented. This percentage is 6.7% in units of level four, 43.7% in level five, 49.1% in level six, 90.9% in level seven, and 93.8% in the most distant units (level eight), the latter being implemented in all schools and 88.2% of CMEIs.
Thus, considering the distance and coverage of the hard-to-staff policy, we observe that the average turnover rate among CMEI is lower for the most centralized units (22.7%), reaching 31% in the most distant schools (level 8). It is interesting to note that the highest rate is found in level 2 (32.6%), which alludes to more central locations, with less policy coverage, but inserted in vulnerable contexts from the socioeconomic and cultural point of view. A similar movement is perceived in schools, which show higher rates for schools closer to the central region of the city (weighted values 1 and 2). Rates lower than average are found in more distant schools, and those under Weight Values 7 and 8 also have greater policy coverage.
The results for the variable “policy implemented” show that the average is significantly lower between the two groups whose policy was implemented, denoting also less internal dispersion (CV of 44% among the CMEIs and 37% among the schools).
Considering the percentages of bonuses, the turnover rates among schools are lower as the percentage increases, so higher bonus percentages may be related to a decrease in the incidence of the phenomenon. Although this is not a common regularity among the CMEIs, their rates for the different percentages are lower than the overall average (24.3%).
Given the obtained results, it is possible to state that distance, implemented policy and bonus percentage are intervening factors in the turnover level, but do not keep a linear relationship. At this point, it is worth reminding the study by Campos and Malik (2008), which shows the matters of distance and prestige of the institution as variables that explain part of the incidence of professional turnover in the public sector.
Anyhow, the relationship between these variables needs to be problematized under the lens of the teaching work conditions that are operated in the units considered hard-to-staff by the municipal management, because they are not filled up every year. Thus, we have the policy as an element that induces attractiveness but disconnected from the investigation of the issues that produce the difficulty in staffing the vacancies.
To summarize, the above-mentioned analyses of the policy in question - together with Kasmirski’s (2012) finding that local policies of additional monetary payments added to the remuneration per job location show potential for reducing migration among schools - evoke the need for studies that observe, in-depth, its effects on the incidence of teacher turnover, taking as reference the universe of schools in the Municipal Education Network (RME)[Rede Municipal de Ensino].
Concluding remarks
The teacher turnover in schools, at high levels, may constitute an obstacle to the fulfillment of the educational objectives expressed in an educational and social project. This is the basic assumption of this article. The phenomenon was thought of in the light of the singularity of the teaching work, as it alludes not only to the departure of a professional from his/her workplace and eventual replacement, but to the rupture of a political, continuous, intentional, interactive, and collective work, with a view to broader human development.
Regarding the implications for educational policies, taken as necessary actions for the effectiveness of the constitutional right to education, the expressed results reiterate the need to reveal, by an indicator, the incidence of the teacher turnover phenomenon in basic education schools.
The conclusion of the general analysis of teacher turnover in Curitiba, by administrative department, and for the set of schools that comprise it, is that the phenomenon's measuring reveals an incidence at high levels. If the undertaken theoretical construction made it possible to highlight its negative effects on the school’s social function and a work of a unique nature, revealing average incidence rates that can vary from 12.3% to 55.4%, depending on the sphere in which they occur, reiterates the need to give it visibility to raise it as a pertinent theme to be included in the local political agenda.
Among the research limits, it is important to emphasize that, although we recognize the possibility of a relationship between turnover and differentiated forms of school management, since this relationship tenses, to different degrees, the teaching work, and the power relations inherent to the school, this is a dimension not observed in this study. The relationship among peers, which may explain the interest in departing from or remaining in a school, was not assessed either.
It is important to highlight the possibility of replicating the indicator for other Brazilian contexts, since it was developed from a database made available annually by Inep. This creates endless possibilities for diagnosis, analysis, and discussion. Therefore, it can be set as an agenda for future work: a) efforts that seek to identify organizational factors that contribute to turnover production, as a condition for the political decision that aims at its reduction; b) studies that capture the specificities that generate the stressed dissimilarity in the incidence of the phenomenon between CMEIs and schools; c) explanatory analyses with a broad set of independent variables and more sophisticated statistical modeling; d) analyses of the indicator's historical series to know the trajectory of the aimed phenomenon incidence, among other results, at the construction of “tolerable” parameters of teacher turnover in basic education schools.
REFERENCES
Azevedo, K. A. A. (2012). Rotatividade docente e suas implicações no contexto escolar. Secretaria de Estado de Educação. http://www.diaadiaeducacao.pr.gov.br/portals/cadernospde/pdebusca/producoes_pde/2010/2010_uel_ped_artigo_kelly_aparecida_almeida_azevedo.pdf [ Links ]
Campos, C. V. de A., & Malik, A. M. (2008). Satisfação no trabalho e rotatividade dos médicos do Programa de Saúde da Família. Revista de Administração Pública, 42(2), 347-368. [ Links ]
Constituição da República Federativa do Brasil de 1988. (1988). Senado Federal. https://www2.senado.leg.br/bdsf/bitstream/handle/id/518231/CF88_Livro_EC91_2016.pdf [ Links ]
Cunha, M. B. (2015). Rotatividade docente na Rede Municipal de Ensino da cidade do Rio de Janeiro [Tese de Doutorado, Pontifícia Universidade Católica do Rio de Janeiro]. Biblioteca Digital Brasileira de Teses e Dissertações. http://bdtd.ibict.br/vufind/Record/PUC_RIO1_a8562aefffaf012e546b66ecd9fbbfc8 [ Links ]
Decreto n. 23.020 de 17 de junho de 2003. (2003). Dispõe sobre a gratificação pelo exercício de atividades em unidades escolares situadas em local de difícil acesso. Prefeitura Municipal do Rio de Janeiro. [ Links ]
Decreto n. 235 de 27 de março de 2007. (2007). Estabelece os requisitos para o recebimento da gratificação prevista nos parágrafos 1º, 2º, 3º e 4º, do artigo 34, da Lei n. 12.083/2006 e artigos 1º, 2º e 3º da Lei n. 12.114/2007. Câmara Municipal de Curitiba. [ Links ]
Departamento Intersindical de Estatística e Estudos Socioeconômicos. (2014a). Os números da rotatividade no Brasil: Um olhar sobre os dados da RAIS 2002-2013. Dieese. https://www.dieese.org.br/notaaimprensa/2014/numerosRotatividadeBrasil.pdf [ Links ]
Departamento Intersindical de Estatística e Estudos Socioeconômicos. (2014b). Rotatividade e as pesquisas públicas para o mercado de trabalho. Dieese. https://www.dieese.org.br/livro/2014/livroRotatividade.pdf [ Links ]
Diógenes, L. C., Paschoal, T., Neiva, E. R., & Meneses, P. P. M. (2016). Intenção de rotatividade e percepção de suporte organizacional em um órgão público federal. Revista do Serviço Público, 67(2), 147-172. https://doi.org/10.21874/rsp.v67i2.655 [ Links ]
Duarte, R. G. (2009). Os determinantes da rotatividade dos professores no Brasil: Uma análise com base nos dados do SAEB 2003 [Dissertação de mestrado, Universidade de São Paulo]. Biblioteca Digital de Teses e Dissertações da USP. https://doi.org/10.11606/D.96.2009.tde-07052010-163617 [ Links ]
Fanfani, E. T. (2005). La condición docente: Analisis comparado de la Argentina, Brasil, Perú y Uruguay. Siglo XXI Editores. https://unesdoc.unesco.org/ark:/48223/pf0000144319/PDF/144319spa.pdf.multi [ Links ]
Frantz, M. G. (2018). Rotatividade docente nas escolas públicas de Educação Básica: Marcas da singularidade do fenômeno [Dissertação de Mestrado, Universidade Federal do Paraná]. Repositório Digital Institucional da UFPR. https://hdl.handle.net/1884/58638 [ Links ]
Grissom, J. A. (2011). Can good principals keep teachers in disadvantaged schools? Linking principal effectiveness to teacher satisfaction and turnover in hard-to-staff environments. Teachers College Record, 113(11), 2552-2585. [ Links ]
Ingersoll, R. (2001). Teacher turnover and teacher shortages: An organizational analysis. American Educational Research Journal, 38(3), 499-534. [ Links ]
Instituto Nacional de Estudos e Pesquisas Educacionais Anísio Teixeira. (2017). Microdados do Censo Escolar da Educação Básica 2016. Inep. http://portal.inep.gov.br/artigo/-/asset_publisher/B4AQV9zFY7Bv/content/microdados-do-censo-escolar-2016-ja-podem-ser-consultados/21206 [ Links ]
Instituto Nacional de Estudos e Pesquisas Educacionais Anísio Teixeira. (2018). Microdados do Censo Escolar da Educação Básica 2017. Inep. http://portal.inep.gov.br/artigo/-/asset_publisher/B4AQV9zFY7Bv/content/microdados-do-sistema-de-avaliacao-da-educacao-basica-de-2017-sao-divulgados/21206 [ Links ]
Jannuzzi, P. de M. (2005). Indicadores para diagnóstico, monitoramento e avaliação de programas sociais no Brasil. Revista do Serviço Público, 56(2), 137-160. https://doi.org/10.21874/rsp.v56i2.222 [ Links ]
Johnson, S. M., Berg, J. H., & Donaldson, M. L. (2005). Who stays in teaching and why: A review of the literature on teacher retention. Project on Next Generation of Teachers, Harvard Graduate School of Education. [ Links ]
Kasmirski, P. R. (2012). Mobilidade de professores na rede estadual paulista [Dissertação de mestrado, Universidade de São Paulo]. Biblioteca Digital de Teses e Dissertações da USP. https://doi.org/10.11606/D.12.2012.tde-20022013-163802 [ Links ]
Lei n. 9.394, de 20 de dezembro de 1996. (1996). Estabelece as Diretrizes e Bases da Educação Nacional. MEC. [ Links ]
Lei n. 10.190 de 28 de junho de 2001. (2001). Institui o plano de carreira do magistério público municipal, alterando as leis n. 8.580/94, 6.761/85 e 8.579/94. Câmara Municipal de Curitiba. [ Links ]
Lei n. 11.738, de 16 de julho de 2008. (2008). Regulamenta a alínea “e” do inciso III do caput do art. 60 do Ato das Disposições Constitucionais Transitórias, para instituir o piso salarial profissional nacional para os profissionais do magistério público da educação básica. Diário Oficial da União. [ Links ]
Lei n. 14.544, de 11 de novembro de 2014. (2014). Instituiu o Plano de Carreira do Profissional do Magistério de Curitiba. Câmara Municipal de Curitiba. [ Links ]
Lei n. 14.580, de 22 de dezembro de 2014. (2014). Reestrutura a carreira dos profissionais da educação infantil da Prefeitura Municipal de Curitiba. Câmara Municipal de Curitiba. [ Links ]
Lei n. 15.043 de 2017. (2017). Altera a data de pagamento do terço de férias dos servidores para o mês de férias dos trabalhadores. Câmara Municipal de Curitiba. [ Links ]
Linhares, L. M. (2014). Rotatividade no serviço público: Estudo de caso do cargo de analista de planejamento e orçamento [Dissertação de mestrado, Universidade de Brasília]. Repositório Institucional da UnB. https://repositorio.unb.br/handle/10482/36884 [ Links ]
Medeiros, C. R. G., Junqueira, Á. G. W., Schwingel, G., Carreno, I., Jungles, L. A. P., & Saldanha, O. M. de F. L. (2010). A rotatividade de enfermeiros e médicos: Um impasse na implementação da Estratégia de Saúde da Família. Ciência & Saúde Coletiva, 15(suppl 1), 1521-1531. https://doi.org/10.1590/S1413-81232010000700064 [ Links ]
Ministério do Trabalho e do Emprego. (2013). Avaliação Financeira do Fundo de Amparo ao Trabalhador - FAT. (Nota Técnica n. 043/2013/CGFAT/SPOA/SE/MTE). Secretaria Executiva. http://www.planalto.gov.br/ccivil_03/Projetos/PLN/2013/Anexos/MSG153-IV.9%20Abono%20e%20Seguro%20Desemprego.pdf [ Links ]
Nomura, F. H., & Gaidzinski, R. R. (2005). Rotatividade da equipe de enfermagem: Estudo em hospital- -escola. Revista Latino-Americana de Enfermagem, 13(5), 648-653. https://doi.org/10.1590/s0104-11692005000500007 [ Links ]
Paranaíba, N. F. (2014). Satisfação no trabalho e intenção de rotatividade de servidores das carreiras de uma autarquia federal. In M. R. de S. Camões, D. R. da F. Fonseca, & V. Porto (Eds.), Estudos de gestão de pessoas no serviço público (Cadernos ENAP, 37, pp. 119-142). ENAP. [ Links ]
Pereira, E. A., Jr. (2017). Condições de trabalho docente nas escolas de educação básica no Brasil: Uma análise quantitativa [Tese de Doutorado, Universidade Federal de Minas Gerais]. Repositório Institucional Universidade Federal de Minas Gerais. https://repositorio.ufmg.br/handle/1843/BUOS-AQQPSG [ Links ]
Pereira, E. A., Jr., & Oliveira, D. A. (2016). Indicadores de retenção e rotatividade dos docentes da educação básica. Cadernos de Pesquisa, 46(160), 312-332. https://doi.org/10.1590/198053143370 [ Links ]
Sancho, L. G., Carmo, J. M. do, Sancho, R. G., & Bahia, L. (2011). Rotatividade na força de trabalho da rede municipal de saúde de Belo Horizonte, Minas Gerais: Um estudo de caso. Trabalho, Educação e Saúde, 9(3), 431-447. [ Links ]
Silva, J. L. (2007). A rotatividade docente numa escola da rede estadual de ensino [Dissertação de mestrado, Pontifícia Universidade Católica de São Paulo]. TEDE: Sistema de Publicação Eletrônica de Teses e Dissertações. https://tede2.pucsp.br/handle/handle/10610 [ Links ]
Silva, M. R. da. (2011). Perspectivas curriculares contemporâneas. Ibpex. [ Links ]
Siqueira, W. R. de, & Alves, L. C. F. (2016). Rotatividade de professores universitários: O caso de um campus fora da sede. Revista de Administração, Contabilidade e Economia da Fundace, 7(2). https://doi.org/10.13059/racef.v7i2.324 [ Links ]
Supiot, A. (1995). A crise de espírito do serviço público. Adverso - Revista da Associação de Docentes da UFRGS, 5(7), 16-25. [ Links ]
Tardif, M., & Lessard, C. (2014). O trabalho docente: Elementos para uma teoria da docência como profissão de interações humanas. Vozes. [ Links ]
Torres, R. V. B. S. (2015). Rotatividade no poder executivo federal: Uma análise das intenções de sair e de permanecer dos servidores comissionados [Dissertação de mestrado, Universidade de Brasília]. Repositório Institucional da UnB. https://repositorio.unb.br/handle/10482/18361 [ Links ]
Vicentini, P. P., & Lugli, R. G. (2009). História da profissão docente no Brasil: Representações em disputa. Cortez. [ Links ]
Weber, M. (1994). Os três tipos de dominação legítima. In M. Weber (Ed.), Economia e sociedade. Editora UnB. [ Links ]
1Translator’s note: In Brazil, the National Educational Bases and Guidelines Law (Law 9.394/1996, Art. 21) established two levels of school education: “I - basic education, comprising early childhood education, elementary school, and high school”; and “II - higher education” comprising undergraduate and graduate courses.
2As established in Article 206, item VI of the Federal Constitution (FC) and in Article 3, item VIII of the National Educational Bases and Guidelines Law (LDB) [Lei de Diretrizes e Bases da Educação Nacional].
3Brazil offered 48.6 million enrollments in the levels of basic education in 2017. 18.3% of these enrollments were offered by private schools, of which: 2.9% were partner institutions; 1.4% were private non-profit schools; and 13.9% were for-profit establishments. Public schools offered 81.7% of the enrollments. But it is important to point out that there are three types of public schools in Brazil based on the cooperation regime set up by the Federal Constitution (Art. 211) involving the Federal Union, states, and municipalities. There are schools funded and managed by state governments (responsible for 33.4% of enrollments in 2017), municipal governments (47.5% of enrollments in 2017), and the federal government (0.8% of enrollments in 2017).
4There are two main municipal decrees, which mark the design of this policy (Decreto Municipal, 2003; Decreto Municipal, 2007).
5According to Jannuzzi (2005), “validity” is a fundamental attribute for social indicators, as it expresses the proximity of the numerical measure to the abstract concept that originated it; that is, it has a good level of validity the indicator that adequately "measures" the construct it intends to describe.
7In the statistical synopses referring to the number of teachers, Inep does not include assistants in early childhood education, teachers from complementary activity classes and teachers from Specialized Educational Services (AEE).
8Using the dictionary of variables of the 2016 School Census microdata, these filters were operationalized as follows: ‘tp_teacher_type’ = 1 or 5 and ‘tp_class_type’ = 0, 1, 2 or 3.
9For this procedure, it is essential that the unique identifier codes of schools and teachers are the same in the editions of the School Census that will be used.
10Activity hours consist of the percentage of teachers' working day (outside the classroom) dedicated to the planning and preparation of teaching activities.
Received: March 10, 2020; Accepted: February 10, 2021
 Este é um artigo publicado em acesso aberto sob uma licença Creative Commons
