


Serviços Personalizados
Journal

Artigo
 texto em
  Inglês (pdf)
 Artigo em XML
 Enviar este artigo por email
Compartilhar

 Permalink
Cadernos de Pesquisa
versão impressa ISSN 0100-1574versão On-line ISSN 1980-5314
Cad. Pesqui. vol.52 São Paulo 2022 Epub 15-Mar-2023
https://doi.org/10.1590/198053149025
PUBLIC POLICIES, EVALUATION AND MANAGEMENT
ACCESS TO DAYCARE IN BRAZILIAN MUNICIPALITIES: POSSIBILITIES FOR MONITORING

IUniversity of São Paulo (USP), São Paulo (SP), Brazil; andrecouto@usp.br
IIUniversity of São Paulo (USP), São Paulo (SP), Brazil; sanzakia@usp.br
This paper aims to present possibilities for monitoring access to daycare at the municipal level. As a methodological strategy, education provision rates were calculated using enrollment data from the school census and population data calculated through the ratio-correlation method. Results showed that, on average, municipalities serve 32.2% of children aged up to 3 years, and inequalities related to location and socioeconomic context were found. The methodology showed a potential for helping with the annual monitoring of daycare access in municipalities of the country.
Key words: DAYCARE; ACCESS TO SCHOOL; EDUCATION PROVISION RATE; RIGHT TO EDUCATION
O objetivo deste artigo é apresentar possibilidades de monitoramento do acesso à creche no nível municipal. Como estratégia metodológica foram calculadas taxas de atendimento escolar utilizando-se dados de matrículas obtidos no censo escolar e dados populacionais calculados a partir da metodologia de correlação de razões. Os resultados demonstraram que, em média, os municípios atendem 32,2% das crianças com até três anos, sendo evidenciadas desigualdades no acesso relacionadas à localização e ao contexto socioeconômico. A metodologia utilizada revelou potencial para auxiliar no monitoramento anual do acesso à creche em municípios do país.
Palavras-Chave: CRECHE; ACESSO À ESCOLA; TAXA DE ATENDIMENTO ESCOLAR; DIREITO À EDUCAÇÃO
El objetivo de este artículo es presentar el seguimiento del acceso a la guardería a nivel municipal. Como estrategia metodológica, las tasas de asistencia escolar se calcularon utilizando datos de matrícula obtenidos en el censo escolar y datos de población calculados a partir de la metodología de correlación de razones. Los resultados mostraron que, en promedio, los municipios atienden al 32,2% de los niños hasta tres años, mostrando desigualdades en el acceso relacionadas con la ubicación y el contexto socioeconómico. La metodología utilizada reveló potencial para ayudar en el monitoreo anual del acceso a guarderías en municipios del país.
Palabras-clave: GUARDERÍA; ACCESO A LA ESCUELA; TASA DE ASISTENCIA ESCOLAR; DERECHO A LA EDUCACIÓN
L’objectif de cet article est de présenter les possibilités de suivi concernant l’accueil des tout-petits dans les crèches municipales. La stratégie méthodologique est basée sur le calcul des taux de fréquentation scolaire selon les données de scolarisation collectées par le recensement scolaire ainsi que les données de population calculées à partir de la méthodologie de corrélation des ratios. Les résultats ont montré que les municipalités accueillent, en moyenne, 32,2% d’enfants de moins de trois ans, avec des disparités d’accès liées non seulement à la localisation, mais aussi au contexte socio-économique. La méthodologie utilisée a mis en évidence son potentiel pour effectuer le suivi annuel de l’accueil en crèche dans les communes du pays.
Key words: CRÈCHE; ACCÈS À L’ÉCOLE; TAUX DE FRÉQUENTATION SCOLAIRE; DROIT À L’ÉDUCATION
In Brazil, the right to education is widely guaranteed by the 1988 Federal Constitution. Education is defined by its article 6 as the first social right, and by article 205 as a universal right, the responsibility of the state, the family and society, which are to collaborate in order to ensure education provision for children, young people and for those who did not have the opportunity to study at the proper age in formal education institutions (Constituição Federal, 1988).
The Constitution represented a legal milestone in early childhood education by recognizing this right for every small child. This recognition assigned the state, as the guardian of the public good, the duty to provide conditions for and ensure the provision of center-based daycare for Brazilian citizens aged 0-5 years (Constituição Federal, 1988). While compulsory early childhood education starts at the age of 4 (Emenda Constitucional n. 59, 2009), the Plano Nacional da Educação [National Education Plan] (PNE) in course sets as a target that by 2024 at least 50% of children aged up to 3 years are served. Data from the Pesquisa Nacional por Amostra de Domicílios Contínua Anual [National Annual Continuous Household Sample Survey] (PNAD-CA) indicate that a little more than one-third of this age group (35.5%) attends daycare in the country (Instituto Brasileiro de Geografia e Estatística [IBGE], 2020).
While the target set by the PNE translates a national expectation, the responsibility to provide and manage early childhood education is mainly municipal (Constituição Federal, 1988). Thus, it is with a focus on this education stage and on this government level that public policies for expanding daycare provision should be operated. For these to be successful, one of the main points is the availability of data that allow to diagnose the analyzed scenario and assess the actions to be carried out (Jannuzzi, 2005). However, an obstacle to planning the provision of education for small children is the lack of regular statistics detailing the demand for daycare vacancies at the municipal level. That information can be calculated for Brazilian municipalities based on population censuses; however, such surveys involve 10-year intervals.
While the PNAD-CA provides annual data on daycare access through education provision rates, its results are disaggregated at the municipal level only for the capitals of the federative units; thus, it is difficult to observe variations in other municipalities. Because it is a municipal-level policy, the lack of regular data limits managers’ and researchers’ understanding of daycare access in these locations (Coutinho & Alves, 2019).
This insufficiency of data - which hinders the monitoring of daycare access in municipalities - stems from the lack of population estimates for the studied age group in intercensal periods. The recognition that regular availability of these estimates is critical to monitoring the fulfilment of the right to education motivated the present study. Therefore, its aim is to present alternatives that allow monitoring daycare access at the municipal level on a continuous basis. The study’s reference year is 2019, the year which marks the middle of the PNE’s validity period.
The discussion presented in this article is organized in five sections besides this introduction. The first section characterizes the difficulties facing works that seek to monitor early childhood education in the country. The two subsequent sections present the methodological approach and the operationalization of data, respectively. In the fourth section, the study’s results are discussed in relation to regional distribution and the socioeconomic level (SEL) of municipalities. Lastly, the final considerations about the study are presented, highlighting its achievements and limitations.
Daycare access: Methodological challenges
Conceptually, access to education can be expressed in education provision rates by simple age or age group. The provision rate, which considers school attendance in a given population, is obtained through a ratio in which the numerator corresponds to the number of students, and the denominator to the overall population, both corresponding to the same age or age group (Instituto Nacional de Estudos e Pesquisas Educacionais Anísio Teixeira [Inep], 2004; Riani & Golgher, 2004). Formula 1 presents the calculation necessary to obtain that rate:
where:
M i is the number of students at a particular age or age group i;
P i is the population at a particular age or age group i.
Different databases can be used as the basis for this calculation. The number of students can be obtained from school censuses, surveys carried out by government bodies such as the IBGE or administrative records of education management bodies such as departments of education. The overall population can be obtained through estimates derived from surveys such as population censuses, sample surveys and official census-based estimates, usually carried out by the IBGE or institutes and foundations that specialize in demographic studies.
In Brazil, the school census is the main source of information about basic education students. The numerator in Formula 1 was obtained from its data, which are made available on an annual basis. The methodological challenge lies in obtaining population estimates stratified by simple age or age group which correspond to the denominator. Because such data at the municipal level depends directly on the population census and on infrequent intercensal measurements, it is difficult to obtain that estimate at the municipal level. Specifically, for the group of children aged three or less, whose pressing demand is the expansion of daycare access, monitoring this scenario with data updated in a long interval is not appropriate for informing public policy.
Coutinho and Alves (2019) discussed the difficulties related to monitoring daycare access in their analysis of the first target of PNE in 26 municipalities of the metropolitan area of Maringá, in the state of Paraná. For their study, they used data from the 2010 and 2016 School Census editions, the 2010 Population Census, and IBGE population projections for 2016. Since the population data published by the IBGE consider age groups on a five-year basis, the authors analyzed the population variation for the 0-4 age group between 2010 and 2016 in that state. They applied the variation found for the period in question to municipal populations of children aged 0 to 5 years, assuming that, given their age proximity, a similar behavior would occur between both population cohorts. Results showed greater access for children aged 4 and 5 years, and access inequalities in the group of children aged 3 or less. According to the authors, “the main challenge to monitoring achievement of the target at the municipal level lies in the inexistence of data about the number of children in the specific early childhood education groups” (Coutinho & Alves, 2019, p. 196, own translation).
Flores et al. (2020), in a study dealing with the challenges of research on access to early childhood education in the state of Rio Grande do Sul, found difficulties that hinder longitudinal studies focused on access. By analyzing documents of the Tribunal de Contas do Estado [State Court of Accounts] (TCE) and data for 18 municipalities of that state, they identified that interruptions and irregularity in the availability of population data compromised the analysis of access scenarios. According to the authors, because the TCE reports used student and population data with different reference years, they led to inconsistencies in the monitoring of access to early childhood education, with significant alterations in the municipal provision rates. In research of population and education, using different databases is hardly unusual; in terms of provision rate, however, it is expected that these bases have the same reference calendar year.
The work of Falciano and Nunes (2020) analyzed the scenario of 16 municipalities of the state of Rio de Janeiro as to compliance with compulsory preschool attendance and highlighted a similar difficulty with population data. Given the absence of such information, the authors determined the education provision for children aged 4 to 5 years by analyzing the relationship between the number of live-born children and enrollments for each of the 15 municipalities studied. Their results indicated that the population variations in the municipalities were not totally aligned with the state and national tendencies and found inequalities in access to early childhood education in different parts of the state of Rio de Janeiro.
In order to comply with Lei [Law] n. 14.113/2020, article 28, which provides for the creation of an indicador da educação infantil [early childhood education indicator] (IEI) to guide the allocation of resources from the Fundo de Manutenção e Desenvolvimento da Educação Básica [Fund for the Maintenance and Development of Basic Education] (Fundeb), the Inep proposed, through Portaria [Ordinance] n. 276/2021, a methodology to develop such indicator. According to the document, the IEI “should consider the deficit in early childhood education identified annually, as well as the socioeconomic vulnerability of the population to be served, i.e., the population aged 0-5 years” (p. 55, own translation). This ordinance recognizes the difficulty obtaining population estimates for children aged 0-5 years at the municipal level, as observed in the following passage:
The difficulties estimating early childhood education provision at the municipal level are well known, since apart from the year in which the IBGE Population Census is run, the other population sample surveys conducted by the IBGE on an annual basis - the Continuous Household Sample Survey (PNAD-AC) - have no representation of municipalities outside the metropolitan areas of state capitals. This poses from the outset a methodological obstacle to meeting the first criterion determined by article 28 of Law 14.113/2020. (Portaria n. 276, 2021, p. 55, own translation).
To overcome this methodological obstacle, the number of children aged 6 years as recorded by the School Census was used as a proxy. The document assumed that this number, in a context of universal primary education, would provide a good basis for estimating the population aged 0-5 years by municipality (Portaria n. 276, 2021).
Thus, the different strategies used in the earlier presented references (Coutinho & Alves, 2019; Falciano & Nunes, 2020; Flores et al., 2020; Portaria n. 276, 2021) showed, in their attempt to determine the number of children at early childhood education age, the difficulty caused by the lack of population estimates by age group at the municipal level. This limitation represents a barrier to studies and, consequently, to policies that need to know the cohorts at early childhood education age.
Methodological approach
Daycare access is characterized in this article through the education provision rate for the population aged from 0 to 3 years, with 2019 as the reference year. Methodologically, the structure for calculating that access was developed over the following stages: a) obtaining the number of students aged 0-3 years from official repositories; b) reviewing the demographic literature with a focus on techniques intended to calculate populations of smaller areas; c) defining the calculation method to estimate the population aged 0-3 years; d) obtaining population data from official repositories; e) estimating the population by municipality; and f) calculating the education provision.
IBM SPSS and Ogis were used. All of the information was treated at the municipal level, involving data from 5,565 Brazilian municipalities. Calculations were not performed for five municipalities which officially came into existence after 2010, and therefore no information was available to carry out their estimates.
The results were analyzed considering municipalities’ descriptive statistics, central tendency measures and regional distribution. In addition, two PNE targets were used as reference. One refers to the rate of at least 50% of the children aged 0-3 years to be served until the end of the plan’s validity period in 2024. This rate refers to nationwide provision; however, even if this value is reached until the end of the period, there may be some municipalities serving every child in their population, and some serving none. Thus, we set for the municipal analyses the same criterion adopted at the national level.
The other target is related with access inequality induced by the socioeconomic context. According to the PNE, by the end of its validity period, the difference between the provision rates for children in the lowest and highest quintiles should be less than 10% (Lei n. 13.005, 2014). However, the document determines for that scenario to be analyzed based on the per capita household income, which also depends on data from the population census. Thus, as a strategy to characterize municipalities’ SEL, we used the percentage of families in the total population of these locations who received transfer payments under the Bolsa Família program in 2019 (Ministério da Cidadania, 2019). The program’s data are highly correlated with other socioeconomic indicators, such as the per capita household income identified by the 2010 Population Census 2010 (-8.80) and the indicador de nível socioeconômico [socioeconomic level indicator] (Inse) calculated by the Inep (-0.86). For this reason, they form a good predictor of municipalities’ SEL.1
Operationalization of data
Student data were obtained from the 2019 School Census’ microdata, using the variable NU_IDADE_REFERENCIA, with selection 0, 1, 2, 3, which corresponds to the simple ages of the children enrolled in official education institutions in 2019 (Inep, 2020a).
The literature is proficuous in that it presents methodologies and instruments that allow calculating population estimates and projections, one of the main methods being demographic components (Álvarez, 2001; Bay, 1998; Brito et al., 2010; Campos, 2017; González & Torres, 2012; IBGE, 2013; Jardim, 1992, 2003; Madeira & Simões, 1972). This method, which aims to predict future population behavior by assessing past demographic tendencies, guides projections about fertility, death and migrations, calculates the population by age group and sex, and allows obtaining the total population (IBGE, 2013). While the IBGE uses this method to estimate the populations of the country’s federative units, using it to estimate populations of smaller locations is not a simple task, since predicting fertility, death and migration behaviors at lower levels requires updated data, not always available for the local level due to big municipal variability and territorial limits (Brito et al., 2010).
For municipal projections, the IBGE has been using a method known as growth partitioning, or simply AiBi. This method, introduced by Madeira and Simões (1972), assumes that population growth in smaller areas is proportional to that of the larger areas they are in, federative units being the larger areas and municipalities being the smaller areas.
While the upsides of this method are that the sum of the populations of smaller areas equals the total population of the larger area, and that it uses projections already established for the federative units, as well as estimates already consolidated in population censuses, a downside is that negative populations may appear if the population growth pattern is not the same between smaller and larger areas. An example is when the population of a municipality decreases while that of the state it is in increases, or vice-versa.2 Another disadvantage of the method is its non-adequacy to long projection periods. Since the relationship between populations of smaller and larger areas is linear and acceptable only for smaller periods of time, on larger horizons, that relationship needs to be carefully observed, and may not repeat.
The literature presents another group of methodologies that propose to calculate population estimates for small areas based on indirect indicators of the size of a population (Álvarez, 2001; Bay, 1998; González & Torres, 2012). These indicators, called symptomatic variables, are formed by official administrative records representing the population, such as births, deaths, school enrollments, voter registrations, drivers licenses, cadastro de pessoas físicas [individual taxpayer registrations] (CPF), among others. This methodology is convenient as it uses population records available and allows updating local populations during intercensal periods. Another advantage is related with the fact that studies have found that these techniques have better results than other mathematical methods regarding longer projection horizons (Brito et al., 2010; Barros & Cavenaghi, 2016).
The method chosen for the present study was ratio-correlation, a linear regression model which uses symptomatic variables and is anchored in the hypothesis that a population’s growth is accompanied by growth in these variables. It is characterized by the relationship between the ratios of the population proportions and symptomatic variables of municipalities and states at two points in time (Brito et al., 2010; González & Torres, 2012; Jardim, 2003). Formula 2 represents the regression equation used in this method:
where:
Y = dependent variable;
X = independent variable;
e = regression error.
Because this is a linear regression model, its variables must be defined. For this study, the following criteria were adopted: time 0 refers to data obtained from the 2000 Population Census, and time t to data from the 2010 Population Census as these are the latest official census measures of the country (IBGE, 2000, 2010). The variable Y i (t) represents the ratio between the population proportions of municipalities and states, obtained at time 0 and time t. Formula 3 describes how this variable was obtained.
where:
P i (0) = the population aged 0-3 of municipality i at time 0;
P i (t) = the population aged 0-3 of municipality i at time t;
P T (0) = the population aged 0-3 of state T at time 0;
P T (t) = the population aged 0-3 of state T at time t.
The variable X h,i (t) represents the ratio between the proportions of the symptomatic variables of municipalities and states, also at two times, just like variable Y i (t). If there is more than one symptomatic variable, then this calculation must be performed for each of them separately as described in Formula 4.
where:
S h,i (0) = symptomatic variable h of municipality i at time 0;
S h,i (t) = symptomatic variable h of municipality i at time t;
S h,T (0) = symptomatic variable h of state T at time 0;
S h,T (t) = symptomatic variable h of state T at time t.
By performing the linear regression model, the municipal population P i (t+n) for the target year can be calculated through Formula 5. In this formula, the component Y i (t+n) refers to the value estimated from the parameters adjusted in the linear regression model, considering period t to t+n. The term P T (t+n) refers to populations aged 0-3 of the federative units.3 The other components of the formula have been previously described.
It is relevant to highlight that in the municipal administrative division in 2000 Brazil had 5,507 municipalities, and in the 2010 division there were 5,565 municipalities. The difference of 58 municipalities between the two periods was not an obstacle to estimating the population of these locations. One advantage of the ratio-correlation method is that defining its parameters does not require that the information for these particular areas has been used as reference. In this case, estimates of subsequent years can be obtained so long as the symptomatic variables used in the model are available for the last referenced period (Jardim, 2003).
The process of defining symptomatic variables met two basic requirements: good correlation between the variables and the age group to be estimated; and regular availability and disaggregation for the municipalities (Bay, 1998; Jardim, 2003). The symptomatic variables used in the study correspond to the number of live-born children by mother’s place of residence and the number of child deaths according to the deceased’s place of residence. Both variables were obtained from the Ministério da Saúde [Ministry of Health]’s website (Datasus) (Ministério da Saúde, 1998a, 1998b, 1999a, 1999b, 2000a, 2000b, 2008a, 2008b, 2009a, 2009b, 2010a, 2010b).
Considering the value of the symptomatic variable as the arithmetic mean of three years centralized on the reference year is a common procedure in studies (Bay, 1998; Jardim, 1992), for example: live-born children of 1999, 2000 and 2001 for 2000. However, for the present study, an adjustment was necessary. In 2022 the Ministério da Saúde altered its data collection instrument for live-born children and child deaths, and in the year in question two instruments were used simultaneously.4 For this reason, when determining the symptomatic variables we did not consider the arithmetic mean of live-born children and child deaths centralized on 2000 and 2010. In this case, those variables correspond to the mean of years 1998 to 2000 (for 2000) and 2008 to 2010 (for 2010).
Since the basic assumption is the existence of a correlation between the symptomatic variables and the population to be estimated, a strong Pearson correlation5 was found between the population aged 0-3 years and those variables for 2000 and 2010. The results showed a positive correlation for 2000 (0.99 for live-born children and 9.97 for child deaths) and 2010 (a 0.99 correlation for both variables), all with statistical significance (p < 0.05).
Better public statistics contribute to better estimates; however, it is relevant to observe that every type of method carries in itself imprecisions that need to be considered. Many works which propose methodologies to estimate populations seek to assess those methodologies with official estimates in order to determine their efficiency and precision (Bay, 1998; Brito et al., 2010; González & Torres, 2012; Jardim, 1992).
Tests were performed to determine whether the ratio-correlation method would show a good behavior in producing estimates for the population aged 0-3 in relation to an official measure. The references for determining this were the municipal intercensal estimates for 2012, calculated by the IBGE for the Fundo de Participação dos Municípios [Municipalities Participation Fund] (FPM). These data are available at Datasus, stratified by simple age (IBGE, 2012).6 For this procedure, the following criteria were observed: mean percentage error, which assesses the estimate bias; and mean percentage error in a module, which shows how close the calculated estimate is to the official measure. In both cases, the closer the values are to zero, the better the results (Brito et al., 2010). These two criteria were also assessed in the 5 and 95 percentiles, which reflect the errors in the extremes of the measure, i.e., the behavior of estimates between smaller and larger municipalities (Álvarez, 2001).
The percentage error is defined by the precision error for the estimated population in relation to the observed population, expressed in percentage values. The percentage error in module represents the measure’s absolute value, i.e., no value can be negative (Álvarez, 2001; Brito et al., 2010; González & Torres, 2012). The error means can be obtained through formulas 6 and 7.
where:
MPE = mean percentage error;
MPEM = mean percentage error in module;
k = number of municipalities;
t = year of measure.
Another criterion used to evaluate the method’s efficiency was the percentage of municipalities situated within an acceptable error margin. There is a debate in the literature about the references for determining that margin: in general, with limits between 5% and 14%, with a predominance of 10% (Brito et al., 2010; Jardim, 1992; Santos & Barbieri, 2015). For the present study, we considered as an acceptable reference that at least 50% of municipalities were situated within the error margin between -10% and 10%. The error’s standard deviation, in which smaller values show more uniform models, was also evaluated (Jardim, 1992, 2003).
Results
Precision statistics and population estimates
Population estimates and precision statistics were calculated and analyzed in three models: the first containing the symptomatic variable live-born children; the second containing only the variable child deaths; and the third with both variables. The aim of this procedure was to determine which model would have the most suitable adjustment to estimate the population aged 0-3 years. Table 1 presents the precision statistics considering the three models calculated in relation with intercensal estimates for 2012.
Table 1 Precision statistics for estimates of the population aged 0-3 of Brazilian municipalities
| Statistics | Model 1 Live-born | Model 2 Deaths | Model 3 Live-born and deaths |
|---|---|---|---|
| Mean percentage error | -3.56 | -4.56 | -8.18 |
| Mean p. error module | 4.22 | 5.01 | 8.29 |
| Mean p. error module - 05 | 5.98 | 6.32 | 8.50 |
| Mean p. error module - 95 | 4.50 | 5.49 | 9.08 |
| Between -10% and 10% | 97.3 | 95.7 | 74.6 |
| Error’s standard deviation | 3.63 | 3.60 | 3.46 |
Source: The authors based on data from IBGE (2000, 2010, 2012) and Ministério da Saúde (1998a, 1998b, 1999a, 1999b, 2000a, 2000b, 2008a, 2008b, 2009a, 2009b, 2010a, 2010b 2012a, 2012b).
Overall, the precision statistics showed a good behavior in the three models used. The mean percentage error indicates, by its negative signal, that all three models had underestimated results in relation to the 2012 official estimate. The mean percentage error in module indicates that Model 1 (4.22) had estimates closer to the official measure, and Model 3 (8.29), farther ones. Considering the measures’ extremes in the 5 and 95 percentiles, the percentage errors in module indicate better results in both cases for Model 1 (5.98 and 4.50).
Considering the criterion of at least 50% of municipalities with errors between -10% and 10%, Model 1 had the best result, with 97.3% of municipal estimates with errors within the preset margin. Model 2 also had a good behavior, with results close to those of Model 1, with 95.7%. Although it met this criterion, Model 3 had the farthest results, with 74.6% of municipalities within the preset error margin. The standard deviation had little difference between the three models.
According to precision statistics, Model 1 had the best result, and was therefore used to estimate the population for 2019. The results described in Table 2 indicate that Brazilian municipalities had on average 2,033 children aged 0-3 years, Coqueiro de Baixo (RS) being the municipality with the smallest population, while São Paulo (SP) had the largest one, with 621,359. State capitals had on average 92,756 children, Palmas (TO) being the capital with the smallest population for this age group, with 16,081 children. For non-capital municipalities, the mean is 1,590 children aged 0-3, Guarulhos (SP) being the one with the largest population, with 78,195 children. In the distribution by region, the North region has the greatest municipal mean, with 2,746 children, and the South region, the smallest mean, with 1,282.
Table 2 Descriptive statistics of municipal populations aged 0-3 years - 2019
| Mean | Minimum | Maximum | Units | |
|---|---|---|---|---|
| Total | 2,033 | 33 | 621,359 | 5,565 |
| Hierarchy | ||||
| Mean | Minimum | Maximum | Units | |
| Capital | 92,756 | 16,081 | 621,359 | 27 |
| Non-capital | 1,590 | 33 | 78,195 | 5,538 |
| Regions | ||||
| Mean | Minimum | Maximum | Units | |
| Central-West | 2,010 | 54 | 159,724 | 466 |
| Northeast | 1,774 | 65 | 133,317 | 1,794 |
| North | 2,746 | 76 | 136,368 | 449 |
| Southeast | 2,660 | 35 | 621,359 | 1,668 |
| South | 1,282 | 33 | 92,422 | 1,188 |
Source: The authors based on data from IBGE (2000, 2010, 2018) and Ministério da Saúde (1998a, 1999a, 2000a, 2008a, 2009a, 2010a).
Number of students
Table 3 shows that, on average, in the country’s state capitals, 32,923 children aged 0-3 years were enrolled in 2019, São Paulo (SP) being the capital with the greatest number of enrollments, 369,425, and Macapá (AP) with the smallest, 1,498. Of non-capital municipalities, Campinas (SP) had the greatest number of children aged 0-3 years enrolled, 28,947. One hundred and fifteen municipalities were detected which did not have any enrollment for this age group in 2019, and in every region there were municipalities with this characteristic. The Southeast region had the greatest mean for enrollments at the municipal level, 1,059, and the North region, the smallest mean, 377.
Table 3 Descriptive statistics of enrollments of children aged 0-3 years in Brazilian municipalities - 2019
| Hierarchy | ||||
|---|---|---|---|---|
| Mean | Minimum | Maximum | Units | |
| Capital | 32,923 | 1,498 | 369,425 | 27 |
| Non-capital | 497 | 0 | 28,974 | 5,538 |
| Regions | ||||
| Mean | Minimum | Maximum | Units | |
| Central-West | 519 | 0 | 30,366 | 466 |
| Northeast | 475 | 0 | 39,446 | 1,794 |
| North | 377 | 0 | 9,168 | 449 |
| Southeast | 1,059 | 0 | 369,425 | 1,668 |
| South | 517 | 0 | 34,227 | 1,188 |
Source: The authors based on data from the School Census (Inep, 2020a).
Daycare access
Table 4 shows the descriptive results for education provision considering the total of municipalities, as well as their distribution in capitals and non-capital cities and by region. The results evidence that, on average, Brazilian municipalities serve 32.2% of children aged 0-3, that 115 municipalities do not serve any child (0.0%), and that 15 municipalities serve a greater number of children than their population aged from 0 to 3 years (the greatest observed provision rate being 133.4%). The provision mean for non-capital municipalities is similar to the national mean (32.2%) and greater when compared with the means of capitals (29%); however, in every capital record is found of education provision for this age group (4.3% minimum), which is not the case with non-capital municipalities (0.0% minimum).
Table 4 Descriptive statistics of education provision in percentages in Brazilian municipalities - 2019
| Mean | Minimum | Maximum | Units | |
|---|---|---|---|---|
| Total | 32.2 | 0.0 | 133.4 | 5,565 |
| Hierarchy | ||||
| Mean | Minimum | Maximum | Units | |
| Capital | 29.0 | 4.3 | 63.3 | 27 |
| Non-capital | 32.2 | 0.0 | 133.4 | 5,538 |
| Regions | ||||
| Mean | Minimum | Maximum | Units | |
| Central-West | 26.6 | 0.0 | 85.4 | 466 |
| Northeast | 29.2 | 0.0 | 110.1 | 1,794 |
| North | 17.7 | 0.0 | 86.6 | 449 |
| Southeast | 33.5 | 0.0 | 133.4 | 1,668 |
| South | 42.5 | 0.0 | 132.8 | 1,188 |
Source: The authors based on data from IBGE (2000, 2010, 2018), Ministério da Saúde (1998a, 1999a, 2000a, 2008a, 2009a, 2010a) and Inep (2020a).
The distribution by region reveals that in municipalities of the South region the mean provision rate is greater than those of the other regions (42.5%) and that the North region concentrates the smallest municipal mean provision rate (17.7%). In every region there are municipalities that do not serve any child aged 0-3 (0.0%), this being most frequently observed in the Southeast region, in the state of Minas Gerais, with 63 municipalities in this situation. In the Central-West and North regions there are no records of municipalities serving every child of the age group in question, the greatest observed provision rates being approximately 85%. In the Northeast, Southeast and South regions, on the other hand, there are municipalities serving a greater number of children than their resident population aged 0-3. This scenario was most frequently observed in the South region, specifically in the state of Rio Grande do Sul, with 11 municipalities in this situation.
In the cases that have provision rates greater than 100%, two hypotheses can be listed. The first concerns service being provided for children from neighboring municipalities, which increases enrollments but not the local population, resulting in provision rates greater than 100%. The other hypothesis is related with an undercount of small children by census surveys. This phenomenon, which is recurrent in population censuses in different parts of the world, results from a smaller count of individuals than their actual numbers. This gap is not unusual with small children and communities with high urban mobility rates, like the homeless population. With children, particularly those younger than 1 year, the omission may be due to forgetting in census surveys. In other words, the fact that an infant is still a new member to the family may lead the respondent not to consider them as one of the household’s dwellers. Another issue may be not recognizing children as “people” (but rather just as children - as if they were a separate category), resulting in not counting an individual who lives in the household (Grupo de Foz, 2021).
Figure 1 presents the distribution of municipalities according to their education provision rate. It shows that the municipalities with greater provision rates are mainly located towards the country’s south and only in small concentrations in the Central-West and Northeast regions. Few municipalities are seen that serve more than 75% of the population aged 0-3. A concentration of municipalities with provision rates below 25% is seen in the North and Northeast regions and in locations near the country’s borders, along the North and Central-West regions.
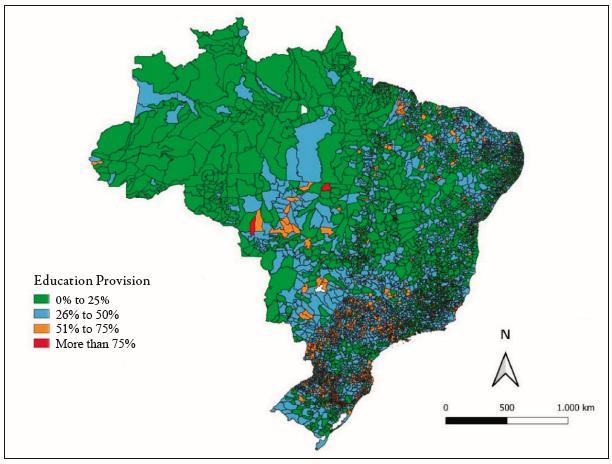
Source: the authors based on data from IBGE (2000, 2010, 2018), Ministério da Saúde (1998a, 1999a, 2000a, 2008a, 2009a, 2010a) and Inep (2020a).
* Five municipalities in white did not have their provision rates calculated.
Figure 1 Education provision - 0 to 3 years - 2019
Overall, the results in Table 5 indicate that the majority of Brazilian municipalities do not serve more than 50% of children aged 0-3 years. Only 14.4% of the 5,565 municipalities serve more than this percentage. The situation of capitals and non-capital municipalities is similar in respect to provision rates, and only 14% of these municipalities serve more than the established criterion. The distribution by region reveals that in three regions (Central-West, Northeast and North), at least 90% of municipalities serve less than 50% of children. The South region had the best provision scenario, where approximately one-third of municipalities serve more than 50% of children aged 0-3 years.
Table 5 Distribution of municipalities according to the 50% target for education provision - 2019
| 0% a 50% | Units | More than 50% | Units | |
|---|---|---|---|---|
| Total | 85.6% | 4,765 | 14.4% | 800 |
| Hierarchy | ||||
| 0% a 50% | Units | More than 50% | Units | |
| Capital | 85.2% | 23 | 14.8% | 4 |
| Non-capital | 85.6% | 4,742 | 14.4% | 796 |
| Regions | ||||
| 0% a 50% | Units | More than 50% | Units | |
| Central-West | 93.3% | 435 | 6.7% | 31 |
| Northeast | 93.0% | 1,668 | 7.0% | 126 |
| North | 98.2% | 441 | 1.8% | 8 |
| Southeast | 84.8% | 1,414 | 15.2% | 254 |
| South | 67.9% | 807 | 32.1% | 381 |
Source: The authors based on data from IBGE (2000, 2010, 2018), Ministério da Saúde (1998a, 1999a, 2000a, 2008a, 2009a, 2010a) and Inep (2020a).
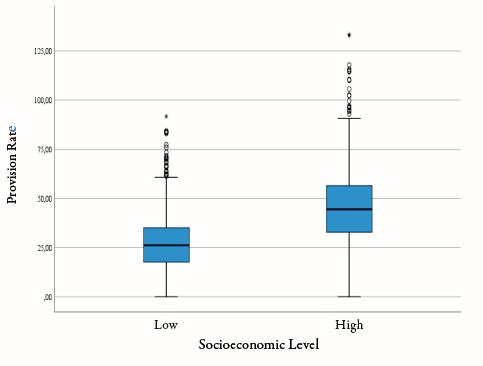
Figure 2, which reflects the mean provision considering the socioeconomic level of municipalities, suggests the existence of daycare access inequality. The results showed that in municipalities with a lower SEL (lowest quintile) the mean provision rate is 27.4%, whereas in municipalities with a higher SEL (highest quintile) the mean rate is 45.6%, a difference of 18.2% between the groups. However, it is worth observing that even in the group with a higher SEL there are municipalities with a rate equal to or smaller than those of municipalities with a lower SEL.
Discussion
The aim of this article is to present alternatives that allow monitoring daycare access for children aged from 0 to 3 years. Access is the first dimension of the right to education, since by entering education institutions, children begin their path through basic education and their experience with processes that will educate them as individuals and citizens (Arelaro, 2010).
The planning of public policies that can meet population demands for goods and services should consider aspects that reflect directly population growth, composition and distribution in the geographic space. In a policy making that focuses on access to school, the first step is to know the size of the population to be targeted by the actions. With that information, it is possible to plan provision strategies, as well as their evaluation, in order for policies to be successful (Rios-Neto et al., 2009).
In a country like Brazil, with approximately 11 million children aged 0-3 years (IBGE, 2018) and whose daycare provision is focused on municipalities, the planning of this provision cannot rely on calculations of the size of this age group carried out each ten years. The approach presented in this article showed a potential for determining this population in shorter intervals and calculating the provision rate at the local level. Using methods with symptomatic variables represents an alternative that can help with municipal monitoring, since Brazil has a public statistics system that is consolidated and well developed by bodies such as the IBGE and the Inep.
The ratio-correlation methodology showed good results, and for this study, in which two symptomatic variables were evaluated, the models using only one of them reached greater precision in relation to the official estimates. Bay (1998) used a similar procedure to estimate populations of smaller areas in Chile and Costa Rica. According to the author, the ratio-correlation method had a good behavior compared to other methods she used to estimate such populations. Just as proposed in this article, the author performed different simulations to find the best model-symptomatic variable relationship. According to Bay (1998, p. 204), “in order to choose an optimal model, it is useful to conduct a previous study that allows evaluating the situation in each case, and to become familiar with the information and the different models used”.7
Jardim (2003) applied eight models of the ratio-correlation method to estimate the population of the municipalities of Rio Grande do Sul between 1990 and 2000. She used symptomatic variables which are more representative of the population: live-born children by mother’s place of residence, child deaths by the deceased’s place of residence, initial enrollment in primary education, and number of voters. In this case, to estimate the total population, the author chose to use information associated with different age groups, such as primary education enrollment for older children and adolescents, and voter registration for adults. Besides this, she also combined different methods to obtain the population estimate from the arithmetic mean. In this case, the ratio-correlation method was combined with Duchesne’s (1987) cohorts relation method.
Using the same group of symptomatic variables as Jardim (2003), González (2010) undertook to estimate populations in the metropolitan area of Córdoba, in Argentina. With an association of different techniques and migration data, González (2010) said that the use of methodologies with symptomatic variables allows updating census data, making this procedure a relevant tool for planning public policy actions.
With a focus on municipalities of the state of Rio de Janeiro, Brito et al. (2010) evaluated three population projection methods for smaller locations, i.e., AiBi, Duchesne’s cohort relation, and ratio-correlation. According to the authors, ratio-correlation resulted in better precision statistics compared to the other methodologies. One advantage of this method is incorporating information from recent years in the regression models, which enables a better behavior vis-à-vis methodologies using past trends, such as AiBi.
In this study, a point of attention concerns the precision statistics that consider at least 50% of municipalities with mean errors between -10% and 10%. While Model1 (live-born children) recorded 97.3% of municipalities within the margin of error, in 2.7% of the total there were errors greater than acceptable. In this case, it would be interesting to conduct a separate study on this group of municipalities in order to identify which factor is affecting their estimates. A component with a strong effect is migration (Muniz, 2018), therefore other methodologies could be used for these cases, as did Gonzáles (2010). However, such procedures are beyond the scope of this study.
The education provision results that reflect daycare access in municipalities showed heterogenous scenarios in the country. Considering the criterion of at least 50% of children aged 0-3 years served by daycare, Brazilian municipalities are on average 17.8% below that rate (32.2%). These results are close to the panorama reported by the 2019 PNAD-CA, which identified 35.6% of the population aged 0-3 served in the country (IBGE, 2020).
Specifically, three factors need to be observed: at least 85% of municipalities do not serve 50% of children aged 0-3 years; there are municipalities which do not serve any child of this age group; there are municipalities which serve more children than their estimated population.
The first factor is concerning, since while the target used as reference in this work is similar to the national target, it had already been set by the 2001 PNE (Lei n. 10.172, 2001). In this case, more than 4,700 municipalities have failed to reach the minimum rate established 20 years ago. The second factor affects directly the right to education. The existence in all regions of municipalities that did not record education provision for children aged 0-3 years suggests failure to fulfill the right to education or the government’s duty to the population.
The third factor regards municipalities that record a provision rate greater than 100%. This scenario suggests two situations. The first is related with locations serving children from neighboring cities. This deserves attention as these municipalities’ early childhood education programs and institutions may be overloaded from serving more children than they should. The other situation may be related with an undercount of children, which can lead to underestimating younger populations. In this case, the number of enrollments may reflect a greater number of children in relation to the existing number in municipalities when compared with the counted population (which may be underestimated), raising the provision rate to over 100%. An interesting exercise for another study would be to scrutinize the situation of these municipalities by analyzing elements like census coverage, the provision rate in neighboring municipalities and in the microregion, commuting migrations in which parents drop their children at schools near their work, and issues related with the underrecording and undernotification of births.
The regional heterogeneity of education provision revealed a major daycare access inequality. Results indicate that the municipalities located in the country’s South region serve, on average, 42.5% of children aged 0-3 years, whereas in the North region the mean rate is 17.7%, a difference of 24.8%. The provision inequality considering the regions has been documented in official monitoring reports of the PNE. According to a report published by the Inep in 2020, the South region had a provision rate of 39.6%, and the North region only 19.2%, a difference of 20.4% (Inep, 2020a). The results of the PNAD-CA 2019 also confirm the existence of inequality between Brazil’s regions. According to the results of that survey, the provision difference between the country’s North and South regions is 25.7% (IBGE, 2020).
Access inequality induced by the socioeconomic context is a subject extensively explored in the literature. Studies have identified that children of lower socioeconomic strata have more difficulty accessing education services (European Commission, 2011; Fundação Maria Cecília Souto Vidigal, 2020; Simões & Lima, 2016; Vandenbroeck & Lazzari, 2014). This is a pressing demand targeted by the PNE in course in the country, which sets as a strategy that by the end of its validity period, the difference between the provision rates for the lowest and highest quintiles is less than 10% (Lei n. 12.005, 2014). The results presented in this article evidenced the existence of daycare access inequality between children aged 0-3 years by demonstrating a difference of 18.2% between the mean access in the group of municipalities of lower SEL, of 27.4%, and in the group of higher SEL, of 45.6%. These findings are in line with the results reported by official bodies, such as the PNE Monitoring Report made by the Inep (2020b).
Final considerations
Municipalities are federate entities with responsibilities assigned by the Constitution to provide in a priority manner early childhood education (Constituição Federal, 1988). While the attendance of children aged 0-3 years is conditioned on parental choice, it is a legal duty of government to offer vacancies at daycare centers and provide suitable conditions for children of this age group to be served at those institutions. Because access to education is a right, every Brazilian citizen is entitled to demand that the state fulfills its duty. Therefore, daycare vacancies should be available to families who wish to enroll their children (Constituição Federal, 1988; Cury, 2002).
The right so established must be monitored in such a way as to inform public policies and allow the social control of its fulfilment. Daycare access, understood as a dimension of the right to education for children aged 0-3 years in Brazil, is an urgent demand which lacks attention and policies carried out at the municipal level that can significantly increase the percentage of children served. The methodological approaches presented in this article, which allow determining the percentage of children served in the country’s municipalities, revealed a potential to help design public policies.
The results evidenced a country with scarce access to daycare and major inequalities between its regions, further aggravated by their socioeconomic level. It is clearly necessary to focus on policies at the municipal level which allow not only meeting the target set in the PNE, but also that children aged 0-3 years have their right to education met through access to daycare.
Acknowledgments
The authors are thankful to the Coordenação de Aperfeiçoamento de Pessoal de Nível Superior [Coordination for the Improvement of Higher Education Personnel] (Capes) for funding this study through a Ph.D. grant.
REFERENCES
Álvarez, G. (2001). Estimación de población en áreas menores mediante variables sintomáticas: Una aplicación para los departamentos de la República Argentina (1991 y 1996) (Serie Población y Desarrollo, 13, pp. 5-35). Cepal. https://www.cepal.org/sites/default/files/publication/files/7145/S2001700_es.pdf [ Links ]
Arelaro, L. R. G. (2010). Acesso à educação. In D. A. Oliveira, A. M. C. Duarte, & L. M. F. Vieira, Dicionário: Trabalho, profissão e condição docente. Faculdade de Educação da Universidade Federal de Minas Gerais. https://gestrado.net.br/dicionario-de-verbetes/ [ Links ]
Barros, L. F. W., & Cavenaghi, S. M. (2016). Potencialidades e desafios no uso de registros administrativos nas estimativas populacionais municipais: Uma análise exploratória para o Brasil no período 1990- -2010. In Anais do 7. Congresso da Associação Latino Americana de População - 20. Encontro Nacional de Estudos Populacionais. Abep. [ Links ]
Bay, G. (1998). El uso de variables sintomáticas en la estimación de la población de áreas menores. Revista Notas de Población, 67-68. [ Links ]
Brito, L., Cavenaghi, S., & Jannuzzi, P. (2010). Estimativas e projeções populacionais para pequenos domínios: Uma avaliação da precisão para municípios do Rio de Janeiro em 2000 e 2007. Revista Brasileira de Estudos de População, 27(1), 35-57. [ Links ]
Campos, J. (2017). Estimativas populacionais a partir de dados orbitais de média resolução espacial: Aplicações em municípios da Região Metropolitana de Belo Horizonte [Tese de Doutorado em Demografia]. Universidade Federal de Minas Gerais. [ Links ]
Constituição da República Federativa do Brasil. (1988). Brasília, DF. http://www.planalto.gov.br/ccivil_03/constituicao/constituicao.htm [ Links ]
Coutinho, A., & Alves, T. (2019). Desigualdade de acesso à educação infantil: Uma análise da meta 1 do PNE na região metropolitana de Maringá. Educar em Revista, 35(75), 194-217. [ Links ]
Cury, C. R. J. (2002). A educação básica no Brasil. Educação & Sociedade, 23(80), 168-200. [ Links ]
Duchesne, L. (1987). Proyecciones de población por sexo y edad para áreas intermedias y menores: Método relación de cohortes (Series Históricas, 187). Naciones Unidas Comisión Económica para América Latina y el Caribe (Cepal). [ Links ]
Emenda Constitucional n. 59 de 12 de novembro de 2009. (2009). Acrescenta § 3º ao art. 76 do Ato das Disposições Constitucionais Transitórias para reduzir, anualmente, a partir do exercício de 2009, o percentual da Desvinculação das Receitas da União incidente sobre os recursos destinados à manutenção e desenvolvimento do ensino de que trata o art. 212 da Constituição Federal, dá nova redação aos incisos I e VII do art. 208, de forma a prever a obrigatoriedade do ensino de quatro a dezessete anos e ampliar a abrangência dos programas suplementares para todas as etapas da educação básica, e dá nova redação ao § 4º do art. 211 e ao § 3º do art. 212 e ao caput do art. 214, com a inserção neste dispositivo de inciso VI. Brasília, DF. http://www.planalto.gov.br/ccivil_03/constituicao/emendas/emc/emc59.htm [ Links ]
European Comission. (2011). Early childhood education and care: Providing all our children with the best start for the world of tomorrow. https://eur-lex.europa.eu/legal-content/EN/ALL/?uri=celex%3A52011DC0066 [ Links ]
Falciano, B. T., & Nunes, M. F. R. (2020). Obrigatoriedade da pré-escola em perspectiva: Avaliação do atendimento no estado do Rio de Janeiro. Pesquisa e Debate em Educação, 10(1), 1047-1063. https://doi.org/10.34019/2237-9444.2020.v10.32019 [ Links ]
Flores, M. L. R., Brusius, A., Bonneau, C. S., & Seixas, J. C. (2020). Desafios em pesquisas sobre o acesso à educação infantil: Um estudo de caso no Rio Grande do Sul. Políticas Educativas, 14(1), 98-110. [ Links ]
Frias, L. A. de M. (1987). Projeções da população residente e do número de domicílios particulares ocupados por situação urbana e rural, segundo as unidades da Federação no período 1985-2020. In L. R. Wong et al., Futuro da população brasileira: Projeções, previsões e técnicas (pp. 148-172). Abep. [ Links ]
Fundação Maria Cecília Souto Vidigal. (2020). Desafios do acesso à creche no Brasil: Subsídios para o debate. https://www.fmcsv.org.br/pt-BR/biblioteca/desafio-acesso-creche-brasil/ [ Links ]
González, L. M. (2010). Ajuste de proyecciones de poblaciones menores con variables sintomáticas: El caso del Gran Córdoba (Argentina). Notas de Población, 37(91), 105-128. https://www.cepal.org/es/publicaciones/37691-notas-poblacion-vol37-ndeg-91 [ Links ]
González, L., & Torres, E. (2012). Estimaciones de población en áreas menores en América Latina: Revisión de métodos utilizados. In S. Cavenaghi (Org.), Estimaciones y proyecciones de población en América Latina: Desafíos de una agenda pendiente (pp. 105-137). Asociación Latinoamericana de Población. [ Links ]
Grupo de Foz. (2021). Métodos demográficos: Uma visão desde os países de Língua Portuguesa. Blucher. https://www.blucher.com.br/metodos-demograficos-uma-visao-desde-os-paises-de-lingua-portuguesa_9786555500837 [ Links ]
Instituto Brasileiro de Geografia e Estatística (IBGE). (2000). Censo Demográfico 2000. https://sidra.ibge.gov.br/pesquisa/censo-demografico/demografico-2000/amostra-educacao [ Links ]
Instituto Brasileiro de Geografia e Estatística (IBGE). (2010). Censo Demográfico 2010. https://sidra.ibge.gov.br/pesquisa/censo-demografico/demografico-2010/amostra-educacao-e-deslocamento [ Links ]
Instituto Brasileiro de Geografia e Estatística (IBGE). (2012). Estimativas da população. https://www.ibge.gov.br/estatisticas/sociais/populacao/9103-estimativas-de-populacao.html?edicao=17283&t=downloads [ Links ]
Instituto Brasileiro de Geografia e Estatística (IBGE). (2013). Projeções da população: Brasil e Unidades da Federação. (Série Relatórios Metodológicos, 40). https://www.ibge.gov.br/estatisticas/sociais/populacao/9109-projecao-da-populacao.html?edicao=9116&t=resultados [ Links ]
Instituto Brasileiro de Geografia e Estatística (IBGE). (2018). Projeções da população do Brasil e Unidades da Federação por sexo e idade simples: 2010-2060. https://www.ibge.gov.br/estatisticas/sociais/populacao/9109-projecao-da%20populacao.html?=&t=resultados [ Links ]
Instituto Brasileiro de Geografia e Estatística (IBGE). (2020). Pesquisa Nacional por Amostra de Domicílios Contínua Anual - 2º trimestre 2019. https://www.ibge.gov.br/estatisticas/sociais/trabalho/17270-pnad-continua.html?edicao=28203&t=resultados [ Links ]
Instituto Nacional de Estudos e Pesquisas Educacionais Anísio Teixeira (Inep). (2004). Dicionário de indicadores educacionais: Fórmulas de cálculo. https://www.gov.br/inep/pt-br/centrais-de-conteudo/acervo-linha-editorial/publicacoes-institucionais/estatisticas-e-indicadores-educacionais/dicionario-de-indicadores-educacionais-2013-formulas-de-calculo [ Links ]
Instituto Nacional de Estudos e Pesquisas Educacionais Anísio Teixeira (Inep). (2020a). Censo da Educação Básica 2019. https://www.gov.br/inep/pt-br/areas-de-atuacao/pesquisas-estatisticas-e-indicadores/censo-escolar/resultados [ Links ]
Instituto Nacional de Estudos e Pesquisas Educacionais Anísio Teixeira. (2020b). Relatório do 3º ciclo de monitoramento das metas do Plano Nacional de Educação. https://www.gov.br/inep/pt-br/centrais-de-conteudo/acervo-linha-editorial/publicacoes-institucionais/plano-nacional-de-educacao/relatorio-do-3o-ciclo-de-monitoramento-das-metas-do-plano-nacional-de-educacao-2020 [ Links ]
Jannuzzi, P. M. (2005). Indicadores para diagnóstico, monitoramento e avaliação de programas sociais no Brasil. Revista do Serviço Público, 56(2), 137-160. [ Links ]
Jardim, M. L. T. (1992). O uso de variáveis sintomáticas para estimar a distribuição espacial de população: Aplicação em municípios do Rio Grande do Sul. In Anais do 8. Encontro Nacional de Estudos Populacionais. Abep. [ Links ]
Jardim, M. L. T. (2003). Metodologias de estimativas e projeções populacionais para o Rio Grande do Sul e seus municípios (Documentos FEE, 56). http://cdn.fee.tche.br/documentos/documentos_fee_56.pdf [ Links ]
Lei n. 10.172, de 9 de janeiro de 2001. (2001). Aprova o Plano Nacional de Educação e dá outras providências. Brasília, DF. http://www.planalto.gov.br/ccivil_03/leis/leis_2001/l10172.htm [ Links ]
Lei n. 13.005, de 25 de junho de 2014. (2014). Aprova o Plano Nacional de Educação - PNE e dá outras providências. Brasília, DF. http://www.planalto.gov.br/ccivil_03/_ato2011-2014/2014/lei/l13005.htm [ Links ]
Madeira, J. L., & Simões, C. C. S. (1972). Estimativas preliminares da população urbana e rural, segundo as unidades da federação, 1960/1980: Por uma nova metodologia. Revista Brasileira de Estatística, 33(129), 3-11. [ Links ]
Ministério da Cidadania. (2019). Famílias beneficiárias do programa Bolsa Família. https://portaldatransparencia.gov.br/download-de-dados/bolsa-familia-pagamentos [ Links ]
Ministério da Saúde. (1998a). Nascidos vivos por residência da mãe segundo município. http://tabnet.datasus.gov.br/cgi/tabcgi.exe?sinasc/cnv/nvbr.def [ Links ]
Ministério da Saúde. (1998b). Óbitos infantis por residência segundo município. http://tabnet.datasus.gov.br/cgi/tabcgi.exe?sim/cnv/inf10br.def [ Links ]
Ministério da Saúde. (1999a). Nascidos vivos por residência da mãe segundo município. http://tabnet.datasus.gov.br/cgi/tabcgi.exe?sinasc/cnv/nvbr.def [ Links ]
Ministério da Saúde. (1999b). Óbitos infantis por residência segundo município. http://tabnet.datasus.gov.br/cgi/tabcgi.exe?sim/cnv/inf10br.def [ Links ]
Ministério da Saúde. (2000a). Nascidos vivos por residência da mãe segundo município. http://tabnet.datasus.gov.br/cgi/tabcgi.exe?sinasc/cnv/nvbr.def [ Links ]
Ministério da Saúde. (2000b). Óbitos infantis por residência segundo município. http://tabnet.datasus.gov.br/cgi/tabcgi.exe?sim/cnv/inf10br.def [ Links ]
Ministério da Saúde. (2008a). Nascidos vivos por residência da mãe segundo município. http://tabnet.datasus.gov.br/cgi/tabcgi.exe?sinasc/cnv/nvbr.def [ Links ]
Ministério da Saúde. (2008b). Óbitos infantis por residência segundo município. http://tabnet.datasus.gov.br/cgi/tabcgi.exe?sim/cnv/inf10br.def [ Links ]
Ministério da Saúde. (2009a). Nascidos vivos por residência da mãe segundo município. http://tabnet.datasus.gov.br/cgi/tabcgi.exe?sinasc/cnv/nvbr.def [ Links ]
Ministério da Saúde. (2009b). Óbitos infantis por residência segundo município. http://tabnet.datasus.gov.br/cgi/tabcgi.exe?sim/cnv/inf10br.def [ Links ]
Ministério da Saúde. (2010a). Nascidos vivos por residência da mãe segundo município. http://tabnet.datasus.gov.br/cgi/tabcgi.exe?sinasc/cnv/nvbr.def [ Links ]
Ministério da Saúde. (2010b). Óbitos infantis por residência segundo município. http://tabnet.datasus.gov.br/cgi/tabcgi.exe?sim/cnv/inf10br.def [ Links ]
Ministério da Saúde. (2012a). Nascidos vivos por residência da mãe segundo município. http://tabnet.datasus.gov.br/cgi/tabcgi.exe?sinasc/cnv/nvbr.def [ Links ]
Ministério da Saúde. (2012b). Óbitos infantis por residência segundo município. http://tabnet.datasus.gov.br/cgi/tabcgi.exe?sim/cnv/inf10br.def [ Links ]
Muniz, J. O. (2018). Análise e previsão demográfica utilizando matrizes de crescimento e distribuição populacional intermunicipal. Revista Brasileira de Estudos de População, 35(3), 1-36. [ Links ]
Portaria n. 276, de 28 de julho de 2021. (2021). Dispõe sobre o indicador para educação infantil de que trata o parágrafo único do art. 28 da Lei n. 14.113, de 2020, que definirá os percentuais mínimos da complementação Valor Aluno Ano Total - VAAT - a serem aplicados pelos Municípios à educação infantil. Brasília, DF. https://in.gov.br/web/dou/-/portaria-n-276-de-28-de-julho-de-2021-335443853 [ Links ]
Riani, J., & Golgher, A. (2004). Indicadores educacionais confeccionados a partir de bases de dados do IBGE. In Introdução à demografia da educação (pp. 89-128). Abep. [ Links ]
Rios-Neto, E., Martine, G., & Alves, J. (2009). Oportunidades perdidas e desafios críticos: A dinâmica demográfica brasileira e as políticas públicas (Demografia em Debate, 3). Abep. [ Links ]
Rosseti, E. S. (2014). Documento técnico contendo descrição da metodologia aplicada na determinação das projeções e das estimativas das populações dos municípios, por sexo e idade - em papel e meio magnético. Ministério da Saúde, Secretaria de Gestão Estratégica e Participativa Departamento de Informática do SUS Coordenação Geral de Disseminação de Informações em Saúde. [ Links ]
Santos, R. O., & Barbieri, A. F. (2015). Projeções populacionais em pequenas áreas: Uma avaliação comparativa de técnicas de extrapolação matemática. Revista Brasileira de Estudos de População, 32(1), 139-163. https://www.rebep.org.br/revista/article/view/698 [ Links ]
Simões, P., & Lima, J. (2016). Infância, educação e desigualdade no Brasil. Revista Iberoamericana de Educación, 72, 45-64. [ Links ]
Vandenbroeck, M., & Lazzari, A. (2014). Accessibility of early childhood education and care: A state of affairs. European Early Childhood Education Research Journal, 22(3), 327-335. http://dx.doi.org/10.1080/1350293X.2014.912895 [ Links ]
Data availability statement This work’s data are not available, since other studies are still being conducted. However, once these are finished, data may be made available upon request to the authors.
1The Pearson correlation is negative, since the greater the percentage of families in the municipality who receive the transfer payments, the lower the SEL - therefore, the smaller the average per capita household income and the Inse.
2In cases where population variations between smaller and larger areas occur in opposite directions, the estimates for the smaller areas can be calculated separately, or a logistic function can be added to the method. Descriptions of these alternatives can be found in Frias (1987) and Rosseti (2014).
3The populations of the federative units calculated through demographic components were obtained from IBGE’s website in the Population Projections for Brazil and Federation Units by sex and age: 2010-2060. Methodological note: https://biblioteca.ibge.gov.br/index.php/biblioteca-catalogo?view=detalhes&id=2101597
4Reports on the change of instruments can be consulted at: http://tabnet.datasus.gov.br/cgi/sim/Consolida_Sim_2011.pdf and http://tabnet.datasus.gov.br/cgi/sinasc/Consolida_Sinasc_2011.pdf
5The Pearson correlation provides results in a numerical range from -1 to 1. Values near -1 or 1 show a strong correlation, which can be either positive or negative.
6Although they are available at the Ministério da Saúde website (Datasus), the municipal estimates were calculated by the IBGE through the method of population growth trend (AiBi) and, for the federative units, through demographic components. Methodological notes: https://www.ibge.gov.br/estatisticas/sociais/populacao/9103-estimativas-de-populacao.html?=&t=notas-tecnicas
7T. N.: This direct quote in English was translated from Portuguese, i.e., from the quote translated into Portuguese by the authors of this article.
Received: September 24, 2021; Accepted: November 08, 2022
 Este é um artigo publicado em acesso aberto sob uma licença Creative Commons
