


Servicios Personalizados
Revista

Articulo
 texto en
  Inglés (pdf)
 Articulo en XML
 Enviar articulo por email
Compartir

 Permalink
Cadernos de Pesquisa
versión impresa ISSN 0100-1574versión On-line ISSN 1980-5314
Cad. Pesqui. vol.53 São Paulo 2023 Epub 13-Oct-2023
https://doi.org/10.1590/1980531410153
BASIC EDUCATION, CULTURE, CURRICULUM
THE REPRODUCTION OF INEQUALITIES IN ACCESS TO EDUCATIONAL STATISTICS
I
, data analysis, revision of the bibliography, definition of the methodology, writing, final revision http://orcid.org/0000-0002-3076-0815
II
, revision of the bibliography, definition of the methodology, writing, final revisionhttp://orcid.org/0000-0001-8361-0186
III
, revision of the bibliography, definition of the methodology, writing, final revisionhttp://orcid.org/0009-0001-4688-4564
IInstituto Unibanco, São Paulo (SP), Brazil; vitor.matheus-menezes@institutounibanco.org.br
IIInstituto Unibanco; Fundação Getulio Vargas (FGV), São Paulo (SP), Brazil; fabiana.bento@institutounibanco.org.br
IIIInstituto Unibanco, São Paulo (SP), Brazil; beatriz.silva-garcia@institutounibanco.org.br
This article analyzes the factors that restrict the availability of educational data. Focusing on secondary school, the article demonstrates that most of those municipalities and schools which, in 2022, did not have data available for the Sistema de Avaliação da Educação Básica [Basic Education Assessment System] (Saeb), either presented low average proficiency indicators in 2019, or did not have data available in 2019. By means of logistic regression, the article demonstrates that the likelihood of a municipality achieving the minimum participation rate for the Saeb, in 2022, was greater amongst those with a high average proficiency in 2019, a greater number of enrollments, and more effective responses to the Covid-19 pandemic. The results demonstrate a reproduction of educational inequalities in the availability of data.
Key words: BASIC EDUCATION; EDUCATIONAL INDICATORS; SAEB; SOCIO-EDUCATIONAL INEQUALITIES
Este artigo analisa quais fatores condicionam a disponibilidade dos dados educacionais. Com foco no ensino médio, o artigo demonstra que os municípios e as escolas que, em 2022, não tinham dados disponíveis para o Sistema de Avaliação da Educação Básica (Saeb) apresentaram, em sua maioria, baixos indicadores médios de proficiência em 2019, ou também não tinham dados disponíveis em 2019. Por meio de uma regressão logística, o artigo demonstra que a probabilidade de um município ter alcançado a taxa mínima de participação para o Saeb, em 2022, foi maior entre aqueles com alta proficiência média em 2019, maior quantidade de matrículas e respostas mais efetivas à pandemia de covid-19. Os resultados indicam uma reprodução das desigualdades educacionais na disponibilidade dos dados.
Palavras-Chave: EDUCAÇÃO BÁSICA; INDICADORES EDUCACIONAIS; SAEB; DESIGUALDADES SOCIOEDUCACIONAIS
Este artículo analiza cuales factores condicionan la disponibilidad de los datos educativos. Centrándose en la educación secundaria, el artículo demuestra que los municipios y las escuelas que, en 2022, no contaban con datos disponibles para el Sistema de Avaliação da Educação Básica [Sistema de Evaluación de la Educación Básica] (Saeb) presentaron, en su mayoría, bajos indicadores en el promedio de competencia en 2019, o tampoco tenían datos disponibles en 2019. Por medio de una regresión logística, el artículo demuestra que la probabilidad de que un municipio haya alcanzado la tasa mínima de participación para el Saeb, en 2022, fue mayor entre aquellos con alto promedio de competencia en 2019, mayor cantidad de matrículas y respuestas más efectivas a la pandemia de covid-19. Los resultados indican una reproducción de las desigualdades educativas en la disponibilidad de los datos.
Palabras-clave: EDUCACIÓN BÁSICA; INDICADORES EDUCATIVOS; SAEB; DESIGUALDADES SOCIOEDUCATIVAS
Cet article analyse les facteurs qui conditionnent la disponibilité des données sur l’éducation. Centré sur l’enseignement secondaire, l’article montre que les municipalités et les écoles qui, en 2022, ne disposaient pas de données à intégrer dans le Sistema de Avaliação da Educação Básica [Système d’évaluation de l’enseignement de base] (Saeb) avaient, pour la plupart, de faibles indicateurs moyens de performance en 2019, ou ne disposaient pas de données en 2019. À l’aide d’une régression logistique, l’article montre que la probabilité qu’une municipalité atteigne le taux de participation minimum requis par le Saeb en 2022 était plus élevé parmi celles avec un indicateur moyen de performance élevé en 2019, un plus grand nombre d’inscriptions scolaires et des réponses plus efficaces à la pandémie de covid-19. Les résultats indiquent une reproduction des inégalités éducatives dans la disponibilité des données.
Key words: ÉDUCATION DE BASE; INDICATEURS ÉDUCATIFS; SAEB; INÉGALITÉS SOCIO-ÉDUCATIVES
For educational policies to be capable of reducing inequalities in learning and school flow, the public authorities need to periodically make indicators on the teaching-learning conditions available. Only by this means can we understand the shift that took place between the end of the 20th century and the beginning of the 21st, when Brazilian democratization and the expansion of the public debate surrounding basic education were followed by the development of school information systems.
The quantitative studies on educational inequalities have tended to focus on the data obtained from the School Census and the Sistema de Avaliação da Educação Básica [Basic Education Assessment System] (Saeb). However, those young people who leave school early, or in some way avoid the formal teaching system, are not included in the administrative records or the large-scale assessments. In parallel with this situation, the performance of the assessments is unequal between the municipalities and schools. This finding was a driving factor for the proposal to use the participation rate in the tests as a factor for adjustment of the final score (Acosta et al., 2021). Besides skewing the results, low rates of participation can hinder access to missing information, in so far as only the results of the assessments of municipalities and schools which achieve a given proportion of their students are published. In 2021, this sum was 50% of municipalities and 80% of schools.
We begin with the hypothesis that the participation of students in the Saeb is not a random phenomenon, since it depends upon local abilities to be able to apply the tests. It is possible that certain municipalities and schools (precisely those with fewer resources, poorer learning indicators and lower socioeconomic levels) are less likely to achieve the minimum participation rates required for publication of the available data. One important effect is the reproduction of pre-existing inequalities in the calculation and disclosure of public data. If this hypothesis is confirmed, we are facing a process of institutional erasure of certain locations and groups of students, making a portion of the school community invisible in the educational diagnoses (Soares, 2020; Welter & Werle, 2021).
The investigation focuses on the period from 2017 to 2021 which, amongst other changes, included the Covid-19 pandemic. Although this article does not assess the impacts of the pandemic on the application of the tests, the influence of this external factor on the objective of the study allows us to verify not only the existence of a structural problem, relating to the lack of information on the schools and municipalities, but also the possible deterioration of this situation in an extreme scenario. Faced with the adoption of social lockdown measures to contain the transmission of the virus, the interruption of the in-person teaching activities affected all students in the same way. This leads us to question whether the measures adopted by the schools during the pandemic, grouped around a synthetic indicator (Senkevics & Bof, 2022), affected the capillarity of the Saeb. As such, the article questions the shortfall of information in Brazil and its impacts on the creation and implementation of public policies, considering the different structural and contextual factors that could have interfered in the ability to apply the tests on a large scale during the last quadrennium.
Some methodological choices deserve to be addressed: i) historically, secondary education has suffered the worst indicators in learning and truancy in Brazil, a fact which led us to focusing on this stage of education; ii) the public system at secondary education level can be managed by the state and federal governments. As such, we have limited the study to those schools within the state (rather than federal) system to guarantee the minimum level of comparability of the results over time; iii) due to its methodological structure, the article does not analyze the impacts of the Covid-19 pandemic on the association between educational inequalities and publication of the results. Rather, the aim is to consider how a structural problem was either mitigated or aggravated in the municipalities and schools during the pandemic; and iv) the capillarity of the large-scale tests can be examined both by looking at the rates of participation and by looking at the minimum indicator that should be achieved for publication of the results. The cut-off point for non-publication identifies which municipalities and schools have missing information on the learning results, explaining the use of this cut-off point, which is discussed over the course of this article, as an indicator that is capable of synthesizing the capillarity of the large-scale tests.
This article is divided into another four sections. The first analyzes the development of Brazilian educational statistics following democratization. The second section examines the data obtained from the period between 2005 and 2021, considering the educational results and how the lack of information is distributed around Brazil as a whole. Following this, the third section focuses on the transition patterns of the schools and municipalities between 2019 and 2021. The municipalities and schools which published their results are compared with those without results, underlining the socioeconomic characteristics and the past indicators of learning and pass rates. Finally, the fourth and final section highlights the challenges facing the field of study in relation to the development of diagnoses on the extent and limits of school statistics in Brazil.
A history of the development of educational statistics in Brazil
In Brazil, the return to democracy was accompanied by an increase in access to basic education. The Constitution of 1988 established free, public education as a basic right. This initiative was complemented, over the years that followed, by the implementation of democratic management mechanisms and by the attempt to guarantee proper conditions in schools for learning and for ensuring that young people remained in school until graduation.
In the 1990s, the decentralization of the educational policies occurred via the municipal management of enrollments in elementary school, and greater administrative and financial autonomy of schools (Arretche, 2002; Lotta et al., 2014). In order to improve the ability of monitoring schools’ results, the Saeb was created in 1990, including the start of large-scale standardized tests in Portuguese language and mathematics. Within a context notable for the restructuring of the Brazilian State and the strengthening of its managerial operations, the Saeb assumed a strategic role in the assessment of school effectiveness (Araújo et al., 2019).
In 1996, the Lei de Diretrizes e Bases da Educação Nacional [Law of Directives and Bases of National Education] (LDB) (Lei n. 9.394, 1996, own translation) sought to ensure a “national process of assessment of school performance . . . in collaboration with the teaching systems”. The LDB established that the Federal Union would be responsible for collecting, analyzing and publishing information on the education system, whilst the states and municipalities should make a record of all young people and adults enrolled in basic education. Also in 1996, the creation of the Fundo de Manutenção e Desenvolvimento do Ensino Fundamental e de Valorização do Magistério [Fund for the Maintenance and Development of Elementary Education and the Enhancement of Teaching] (Fundef) established incentives for increasing the number of places available in elementary school, by means of automatic transfers of funds to the municipalities (Gomes, 2019).
Educational statistics underwent a new cycle of reinforcement over the following decade. In 2001, Lei [Law] n. 10.172 approved the Plano Nacional de Educação [National Education Plan] (PNE). As well as making Primary School obligatory, and expanding the other levels of teaching, the PNE established that public policies should be based upon “qualitative and quantitative data and analyses provided by the assessment system”, which represent “important mechanisms for promoting the efficiency and equality of the secondary education offered in all regions of the country” (Lei n. 10.172, 2001, own translation). Shortly afterwards, in 2006, the creation of the Fundo de Manutenção e Desenvolvimento da Educação Básica [Fund for the Maintenance and Development of Primary Education] (Fundeb) made the objective of providing this stage of education to all a reality.1
In 2007, Decreto [Decree] n. 6.094 instituted the Plano de Metas Compromisso Todos pela Educação [All for Education Targets Commitment Plan]. The plan established an agreement on directives and objectives between the federal government, regional entities and civil society. By offering technical and financial support to the states and municipalities, the plan reaffirmed the need to monitor the students’ attendance and performance, making use of the Índice de Desenvolvimento da Educação Básica [Basic Education Development Index] (Ideb) as a benchmark that can synthesize the degree of implementation of the plan’s directives in the regional governments.
Two other important initiatives were implemented in 2007. Portaria n. 316 (2007) of the Ministério da Educação [Ministry of Education] created the School Census, which aims to collect information on the students and schools via a system of collaboration between the municipalities, states and the Federal Union. The data ascertained each year come to form a base for the calculation of the coefficients of distribution of the Fundeb funds. The Ideb, meanwhile, came to form part of the Plano de Desenvolvimento da Educação [Education Development Plan] (PDE), bringing together the results of the Saeb2 and the pass rates of the students provided by the School Census. The Ideb became the most important indicator for the monitoring of basic education, allowing educational goals to be monitored and investigation of which individual, family and school variables affect the learning and continuance of young people in schools (Duarte, 2013; Lourenço et al., 2017).
Until the beginning of the 2010s, the pursuit of school equality became a common initiative for the creation of regulations. The return to democracy established a new model for education policy, the rules and practices of such being defined over the following decades. Guaranteed learning and the reduction of educational inequalities guided the public debate, whilst access to basic education expanded across the country, in a process of incremental evolution of the educational initiatives (Arretche et al., 2021). Despite these advances, the Brazilian people’s average level of education remained extremely low, and the indicators relating to school attendance and graduation continued to vary a great deal between the racial groups, income levels and regions of the country (Castro, 2009; Medeiros & Oliveira, 2014).
The organization of basic education experienced several changes in the 2010s. In 2014, Lei n. 13.005 instituted a new PNE, applicable for the ten-year period between 2014 and 2024. Amongst the targets established for Brazilian education were the improvement of learning scores on the Saeb, the balancing of the average level of education between Black and non-Black students, and reaching at least 12 years of study for the poorest quartile of the population. The new PNE defined the Saeb as the most important measurement of the quality of basic education, which marked out the offer of technical and financial support to the municipalities (Gesqui, 2016).
In 2017, Medida Provisória [Provisional Measure] n. 746 was converted into Lei n. 13.415, altering important points contained in the LDB, an initiative referred to as the Reforma do Ensino Médio [Restructuring of Secondary Education]. The restructuring has gradually raised the number of hours of basic education, divided between training curricula and an obligatory component. Within this structure, the pass-through funding should prioritize those states “with lower results in the national secondary education assessment processes” (Lei n. 13.415, 2017, own translation). However, the limitation of the Saeb census data to the subjects of Portuguese language and mathematics res- tricts the assessment of the school results, taking into account the curricular diversification advanced by the new Base Nacional Comum Curricular [National Common Curriculum Base] (BNCC).3
Soon after, in 2020, the new Fundeb was regulated by Projeto de Lei [Bill of Law] n. 4.372, which was converted into Lei n. 14.113. As well as increasing the pass-through of funds to those states with lower levels of spending per student, the new law provided financial incentives for those state education systems demonstrating good performance and inequality reduction indicators. It was decided that 2.5% of the total complementary funding provided by the Federal Union would come from the Valor Aluno Ano Resultado [Student Value Year Result] (Vaar), offered to those systems which “achieved an evolution of indicators that are to be defined, attendance, and improvement of learning with a reduction of inequalities” (Lei n. 14.113, 2020, own translation). Based upon this regulation, in 2022, the Intergovernmental Commission on Financing for Quality Basic Education approved a methodology for measurement of socioeconomic and racial inequalities. The educational inequalities should be gauged using the ratio between the proficiency averages obtained from the Saeb between 2017 and 2019 for socioeconomic quartiles, as well as between students from Category 2 (Black, mixed-race and indigenous students) and Category 1 (white and Asian-Brazilian students). Amongst the requirements, the calculations are conditional upon the “existence of a valid public for the application of the Saeb” and the “existence of enough students” for the precise calculation of the averages.
This background illustrates a duality in the Brazilian system of educational information. As well as supporting diagnoses of the characteristics of basic education, this system has set out the creation of performance metrics for the schools and states. The idea is that school effectiveness and the achievement of the goals agreed upon by the public authorities depend upon the decisions of the managers and, as such, there is a need to identify good practices and present them to the school community as examples of “success”. We can, however, see limits to this paradigm, which means critical reflections should be applied to the shortcomings in educational data in the municipalities and schools.
The evolution of the results of secondary education in Brazil and the availability of data in the municipalities
As a synthetic indicator, the Ideb is the product of two components: the standardized average score in mathematics and Portuguese language (IN), which is measured by the Saeb scores at the end of each teaching stage; and the Performance Index (IP), which is drawn from the harmonic mean of the pass rates provided by the School Census. The multiplication of the IN by the IP rectifies possible imbalances between the indicators, for instance in relation to those schools which pass a great many students with a low level of proficiency. Figure 1 shows the evolution of the Ideb components in the state system at secondary school level between 2005 and 2021.4
The IP increased continuously between 2005 and 2019, when the increase in pass rates was also accompanied by drops in early leaving and failure to graduate. Despite this trend having continued between 2019 and 2021, the indicator should be analyzed with caution, since 99.3% of Brazilian schools suspended their in-person teaching activities during the Covid-19 pandemic (Instituto Nacional de Estudos e Pesquisas Educacionais Anísio Teixeira [Inep], 2021). The provision of online activities took different forms, and the guidelines for monitoring the students were relaxed, both in terms of registering the classes and attendance, and the criteria for passing and enrolling students.5 Between 2019 and 2021, the make up of the flow shows a sharp drop in the fail rate (from 10% to 4.4%), with this being complemented by a stabilization of the drop-out rate (from 5.5% to 5.8%). However, the analyses of primary data also observed an increase in the number of students leaving school early which was not detected in the administrative reports.6
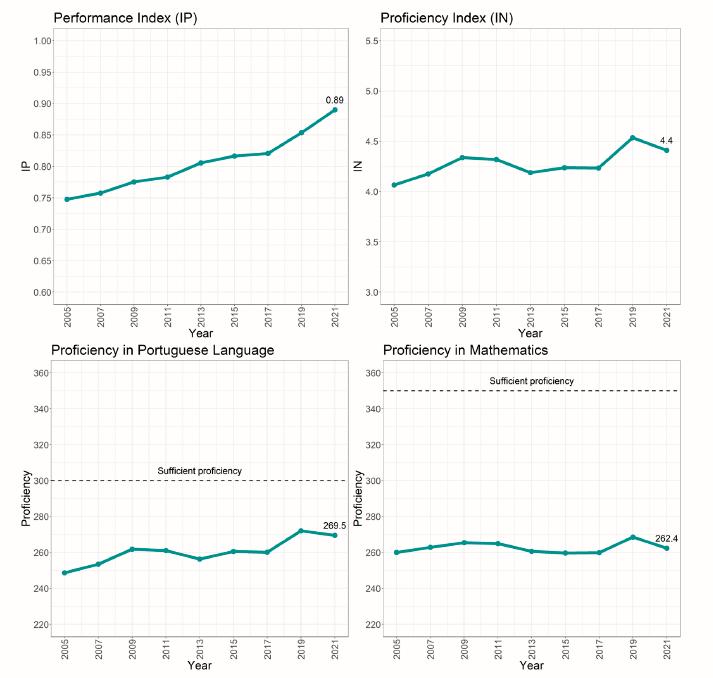
Source: Prepared by the authors based upon Inep data (2005-2021).
Figure 1 Components of the Ideb in the state secondary education system (2005-2021)
The evolution of the IN followed a different route. Proficiency in Portuguese language evolved slowly and irregularly between 2005 and 2019, while proficiency in mathematics remained stable throughout this period, since the drop between 2011 and 2017 was offset by an increase in the period through to 2019. Figure 1 shows that the average proficiency in mathematics is further from the learning level considered to be sufficient,7 a trend that follows the recorded data.
Between 2019 and 2021, the drop in the IN results was important, but less significant than had been expected in the field of education.8 This meant that the 2021 index was the second highest since the records began. Given the exceptional nature of the context in which the tests were applied, and the variation observed between the regions, the indicator came to be contemporized, since it was possible that a lower coverage of the standardized tests in regions and groups with lower proficiency indicators had skewed the test results. This matter also struck researchers considering the recent, although incomplete, release of individual microdata.
Figure 2 brings together these components to present the Ideb from the state secondary education system. The index increased from 2005 to 2009, remained stable through until 2017, and experienced new growth between 2017 and 2019. The evolution was slower than that registered in elementary education, despite the hypothesis, widely disseminated at the time, that the positive trend at the beginning of elementary education would have a knock-on effect in terms of medium-term gains in secondary education (Fernandes, 2016). As of 2013, the Ideb employed in the state secondary education systems deviated from the target established by Inep, a deviation that only increased as the years passed.9 Between 2019 and 2021, the drop in proficiency was balanced out by a rise in the students’ pass rates, which meant that the Ideb remained practically stable. Since the criteria of pass grades and attendance in 2021 were more heterogeneous between the states than they had been in previous years, the creation of performance rankings and a critical assessment of the evolution over time became inviable.
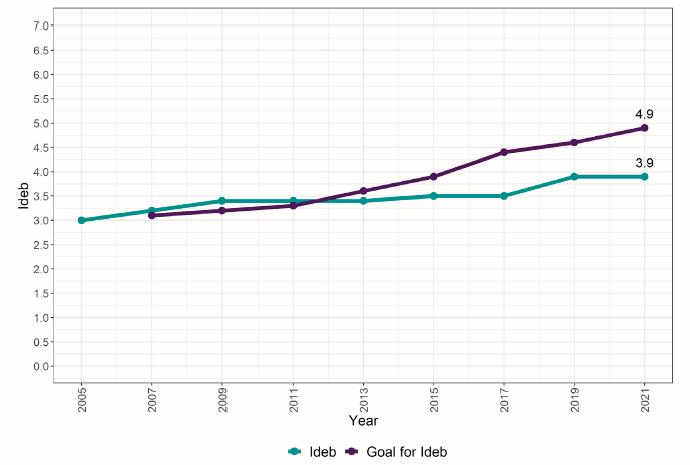
Source: Prepared by the authors based upon Inep data (2005-2021).
Figure 2 Evolution of the Ideb for the state secondary education system (2005-2021)
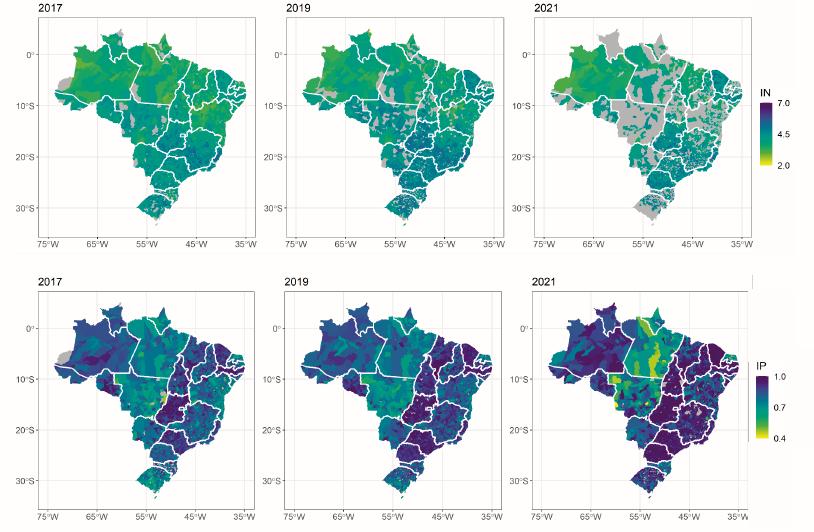
Figure 3 shows the evolution of the IN and the IP in the state secondary education system in Brazilian municipalities, from 2017 to 2021. Looking at the colors, the darker areas achieved higher indicators, whilst the gray areas represent the municipalities in which the data were not published. In relation to the IN, the availability of data depends upon achievement of the minimum participation rate in the Saeb, as a proportion of the students planned to take the tests. This rate shifted from 50% in 2017 (Portaria n. 447, 2017) to 80% in 2019 (Portaria n. 366, 2019). In 2021, the minimum rate was reduced once again to 50% (Portaria n. 250, 2021), except for those municipalities with just one school, for which the rate remained fixed at 80%. The IP depends on the existence of secondary schools and the proper completion of the School Census.
Two elements should be highlighted. First, the calculation of the Ideb does not depend upon the coverage of the system, meaning, therefore, that a municipality can combine a high rate with an exclusion of young people from the public education system (Padilha et al., 2012). If these factors provided cause for concern in 2000 and 2010, they took on even more importance in the period from 2019 to 2021, due to the unequal effects of the pandemic on students remaining in school and the teaching-learning conditions. Second, the IP increased throughout almost the entire country, when the pass rate came to be affected by the administrative decisions of the states’ education systems; in particular the measures taken to relax the monitoring of students during the pandemic.10
For the purposes of this article, it is important to recognize that the problem of a lack of information grew in the municipalities. In relation to the Saeb, just 5.2% of the municipalities in 2017 did not reach the minimum participation rate. This indicator increased to 14.4% in 2019 and 39.2% in 2021, even though the criteria for publication had been relaxed during the pandemic. The variation of the IP was less notable, rising from 2.8% to 2.9% of the municipalities between 2017 and 2021, given that the completion of the administrative records was less affected by the transformation of the teaching-learning conditions. To better understand how this phenomenon affected the state secondary education system, the next topic analyzes the distribution patterns observed in the lack of information in Brazil.
The problem of the lack of information and the transitions of schools and municipalities between 2019 and 2021
It is hoped that the production and dissemination of educational information can structure a system of accountability (Vidal & Vieira, 2011). The aim is to guide educational policies and encourage initiatives considered to have been successful. The idea behind this system is that the availability of information will provide incentives for the education system, by means of a model of competition (Alves & Soares, 2013) typified by a “weak” type of accountability (Fernandes, 2016).11 The use of the Ideb to identify those municipalities that are most vulnerable, served as a starting point for technical support agreements between the federal government and the regional entities (Souza & Batista, 2016; Fernandes & Nogueira, 2020). Over recent years, the symbolic awards made to schools and municipalities were complemented by financial awards that are tied to the reduction of educational inequalities.
However, the results of the large-scale testing are limited. Only those students present on the day of the tests are included in the Saeb calculations. To avoid information that is not representative being used by the public authorities, the Inep required a minimum participation rate before allowing the data from the schools and municipalities to be published. In those units that fail to achieve this minimum rate, the results are included in the calculation of the average proficiency of the states of the federation but are not made available in disaggregated form. This calculation is based upon the calibration of the importance of the schools, classes and students, in order to ensure that the sample estimates correspond to the population counts established by the School Census. In relation to the students, the weighting of the results redresses the loss of students in the classes as a means of dealing with the effect of “no response”.
If the sample does not reflect the numbers of the overall public, the weighting could aggravate biases (França & Gonçalves, 2010). The students included in the tests may, for example, be drawn from that portion of the student body performing best at school. Within this scenario, the weighting aims to deal with the absence of the other students, but ends up overstating the average performance of the school. The establishment of a minimum participation rate, meanwhile, conditions the availability of the results on the local ability to apply the Saeb, intersecting the socioeconomic conditions and the characteristics of the education system. When there are no significant differences between the students who are present and those who are absent, the measurement makes it impossible to use data validated by the municipal authorities.
To address this topic, the first step involves verifying how the problem of a lack of information is distributed across the country.12 Figure 4 shows the proportion of municipalities and schools which did not publish their results in 2019 and 2021. In general, the indicator increased in the states, due to the effect of the pandemic on the conditions for application of the tests. It is worth remembering that the criteria for publication of the results was relaxed for the municipalities but remained as it had been for the schools. The states with the lowest rates of publication were, generally, found to be in the Northern and Northeastern regions of the country. On the other hand, the highest rates of publication came from Ceará and Pernambuco, two states located in the Northeast. The states of Roraima, Bahia and Paraíba suffered the most acute rise in the proportion of municipalities without published results between 2019 and 2021, whilst in relation to schools, the greatest increase in publication was recorded in the states of Espírito Santo, Paraíba and Bahia.
In 2021, in 12 of the 26 Brazilian states, at least half the municipalities did not have Saeb data available. The number rises to 21 states when considering those schools with available data. The lack of information limits the assessment system, especially in those states with worse infrastructure conditions. Even so, the initiatives that coordinate the school principals, the municipalities, and the state systems could improve the capillarity of the tests, which shows the positive effect of a system of collaboration that accompanies the federal agreement. It is no coincidence that the states on the left of Figure 4 are regularly cited in studies on successful models of collaboration and mobilization of the school network (Barbosa, 2006; Vieira & Vidal, 2013; Oliveira, 2020).
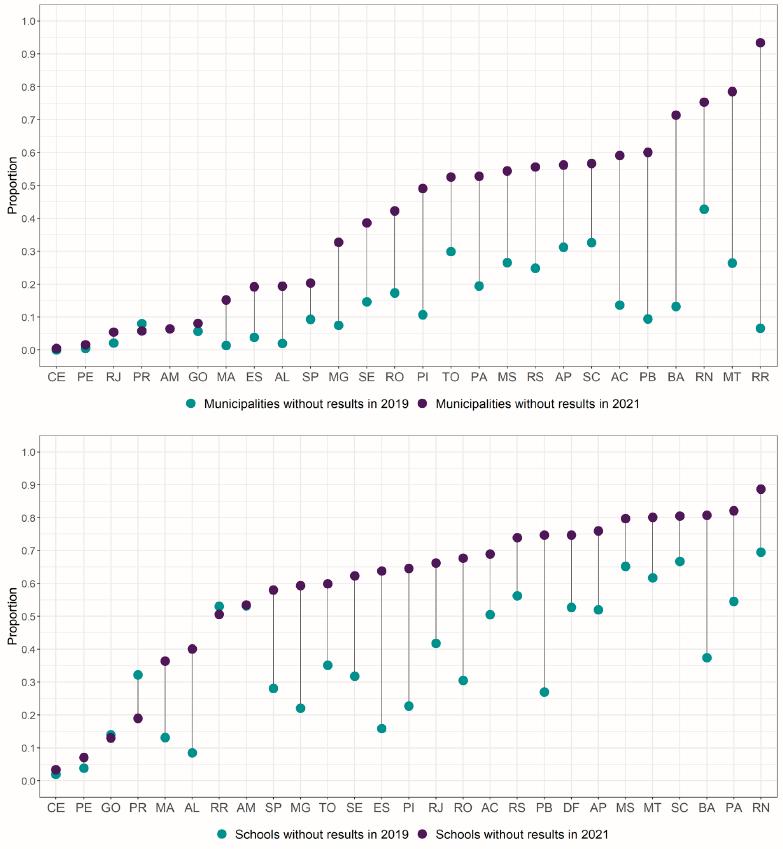
Source: Prepared by the authors based upon Inep data (2019-2021).
Figure 4 Percentage of municipalities and schools without published results in 2019 and 2021, by state
Of the municipalities without published results in 2021, 27% had not achieved the minimum participation rate in 2019. Even though this fact illustrates a reduction in the capillarity of the Saeb, it should be noted that 9.8% of municipalities did not have data available in either 2019 or 2021. Appendix A shows the distribution of this indicator across the states. With 40.4% of its municipalities without available data in the last quadrennium, Rio Grande do Norte can be negatively highlighted amongst Brazilian states, followed by Santa Catarina (27.8%) and Mato Grosso (24.3%). On the other hand, there are no municipalities in Ceará or Pernambuco found to be in this situation.13 In the case of those states with a high proportion of municipalities without available data, the state assessments, when performed periodically and in standardized form, provide the only source of information on school performance. However, this does not fill the vacuum left by the Saeb results, which occupy a central position in the basic education monitoring and management system, guiding the comparison of the states, federal agreements and distribution of funds.
The analysis of basic education should recognize the inequalities that determine access to opportunities and the role of the school in young people’s paths through life. The literature highlights that educational inequalities combine the characteristics of the schools, the management models and the composition of the school community (Gonçalves & França, 2008; Alves, 2020). In Brazil, the studies performed suggest a high correlation between school proficiency and the socioeconomic level of the schools (Inse),14 which means that the results of the standardized tests reflect the structural inequalities of access to basic education (Soares & Xavier, 2013; Mello & Bertagna, 2016). On the other hand, and recognizing the scope of this article, we could ask whether the socioeconomic characteristics of the municipalities and schools are also associated with the availability of the results of the large-scale tests. Another important issue concerns how the learning indicators in the past illustrate the regional inequalities in the capillarity of these assessments.
Table 1 presents four indicators aggregated in 2019 by the status of the municipalities and schools in 2021. In this “portrait” of the past, the results in 2019 were, on average, lower amongst those units that did not achieve a minimum participation rate in the Saeb in 2021. The results point to the existence of a possible bias in the selection of students, since the municipalities and schools with lower learning and school flow indicators are less represented in the composition of the final aggregate. These municipalities and schools are cause for special concern in the creation and implementation of educational policies, since, as well as being the most vulnerable during the pre-pandemic period, they do not have information for Saeb in 2021.
Table 1 Components of the Ideb and Inse average in 2019, by schools with and without published results in 2021
| Status in 2021 | Average of the IN (2019) | Average of the IP (2019) | Average of the Ideb (2019) | Average of the Inse (2019) |
|---|---|---|---|---|
| Municipalities | ||||
| Published results | 4.63 | 0.89 | 4.14 | 4.67 |
| Results not published | 4.44 | 0.83 | 3.72 | 4.62 |
| Schools | ||||
| Published results | 4.76 | 0.91 | 4.4 | 4.76 |
| Results not published | 4.53 | 0.83 | 3.93 | 4.78 |
Source: Prepared by the authors based upon Inep data (2019-2021).
The publication of the results appears to be more associated with prior performance on the Saeb than on the Inse. In other words, the socioeconomic characteristics of the schools and municipalities in 2019 are similar in the groups both with and without available data in 2021. The low capillarity of the Saeb could possibly reflect different experiences and problems, by bringing together schools and municipalities with different experiences of transition between the groups of educational proficiency.
In order to look at this in more detail, it is worthwhile performing an analysis of the typical paths taken by the municipalities and schools, whose characteristics require specific public responses. Below, the levels of the IN have been divided by the distribution of their quartiles in 2019, a procedure that is complemented by the identification of the units without available data (SD).15 The data presented relates to municipalities (Table 2) and schools (Table 3), with denominators of the proportions calculated for each line in the tables.
Table 2 Matrix of transition of the municipalities from 2019 to 2021, by IN groups
| IN in 2021 | ||||||
|---|---|---|---|---|---|---|
| Group 1 | Group 2 | Group 3 | Group 4 | SD | ||
| IN in 2019 | Group 1 | 591 (49.5%) |
76 (6.4%) |
6 (0.5%) |
3 (0.25%) |
517 (43.3%) |
| Group 2 | 266 (23.1%) |
371 (32.2%) |
100 (8.7%) |
18 (1.56%) |
397 (34.5%) |
|
| Group 3 | 63 (5.3%) |
376 (31.9%) |
368 (31.2%) |
79 (6.7%) |
295 (25%) |
|
| Group 4 | 25 (2.2%) |
140 (12.2%) |
329 (28.7%) |
385 (33.6%) |
268 (23.4%) |
|
| SD | 55 (7.8%) |
48 (6.8%) |
44 (6.2%) |
23 (3.3%) |
534 (75.8%) |
|
Source: Prepared by the authors based upon Inep data (2019-2021).
Note: Red fields: municipalities experiencing a drop in proficiency between 2019 and 2021; green fields: municipalities that saw an increase in proficiency; gray fields: municipalities without available data in just one of the years; purple field: municipalities without available data in 2019 and 2021.
Table 3 Matrix of transition of the schools from 2019 to 2021, by IN groups
| IN in 2021 | ||||||
|---|---|---|---|---|---|---|
| Group 1 | Group 2 | Group 3 | Group 4 | SD | ||
| IN in 2019 | Group 1 | 852 (31.1%) |
220 (8%) |
36 (1.3%) |
11 (0.4%) |
1,617 (59.1%) |
| Group 2 | 449 (15.9%) |
591 (20.9%) |
202 (7.2%) |
47 (1.7%) |
1,532 (54.3%) |
|
| Group 3 | 164 (5.8%) |
565 (19.8%) |
572 (20.1%) |
176 (6.2%) |
1,369 (48.1%) |
|
| Group 4 | 47 (1.6%) |
190 (6.6%) |
468 (16.4%) |
1,056 (36,9%) |
1,099 (38.4%) |
|
| SD | 334 (5.9%) |
336 (5.9%) |
279 (4.9%) |
178 (3.1%) |
4,534 (80.1%) |
|
Source: Prepared by the authors based upon Inep data (2019-2021).
Note: Red fields: schools experiencing a drop in proficiency between 2019 and 2021; green fields: schools that saw an increase in proficiency; gray fields: schools without available data in just one of the years; purple field: schools without available data in 2019 and 2021.
Between 2019 and 2021, the majority of the municipalities and schools suffered an average reduction in proficiency, followed by those which remained in the same distribution quartile. For many municipalities, this drop was significant, such as amongst those which fell from Group 4 to Group 2 (12.2% of the total). Also worthy of mention is the high number of municipalities and schools which continued to not publish their results, suggesting the existence of structural problems that affect the capillarity of the educational evaluation.
The transition to non-publication is more common in the initial groups of proficiency. In tables 2 and 3, the final column shows a trend of reduction, with a higher proportion in Group 1 and considerably less in Group 4. Complementing the findings of Table 1, this data shows that the barriers between the proficiency groups and the problem of non-publication are porous in the municipalities and schools with the lowest past learning indicators.
The transition groups can be analyzed both by using their geographical distribution and by identifying the local characteristics that affect their occurrence. From this perspective, the following passages address the municipalities which did not publish results in 2021, given the structural inequalities of the state system at high school level.
Figure 5 identifies the municipalities which did not publish results in 2021. These 2,011 municipalities (36.3% of the total) occupy the final column of Table 2 and are divided by types of transition between 2019 and 2021. Appendix B, meanwhile, shows the relative frequency of the types of transition in each state. For the purposes of this article, two movements are relevant: first, the Group 1 shift from proficiency in 2019 to the category that includes the municipalities that did not publish their results in 2021, since this shift highlights a lack of information in the municipalities that had already presented problematic rates of academic performance (and which, very probably, were not overcome during the peak period of the pandemic); and second, the continuity of municipalities not publishing their Saeb results, a situation that reflects the continued lack of missing information, in a kind of vacuum of large scale tests.
The municipalities in the Northern and Northeastern regions demonstrate greater frequencies relating to the transition from Group 1 to non-publication, especially in the states of Roraima (86.7% of municipalities),16 Amapá (37.5%), Bahia (35.8%) and Pará (31.2%). In relation to the municipalities which did not achieve the minimum participation rate in 2019 and 2021, the states in the Southern and Central Western regions were notable for their poor performance. Even so, the indicator was led by Rio Grande do Norte (40.4% of the municipalities), followed by Santa Catarina (27.5%), Mato Grosso (23.6%), Mato Grosso do Sul (20.25%) and Pará (19.4%). It should be noted that these states have different profiles. It can be affirmed that distinct factors lead to a failure to achieve the minimum participation rate, including difficulties in coordinating the actions between the federal entities and the challenge of guaranteeing school transport on the day of the tests in those regions with poor infrastructures. A closer look at this issue would require a study of the state capacities that exist in the different regions, in order to identify those operational aspects that most influence the rates of participation.
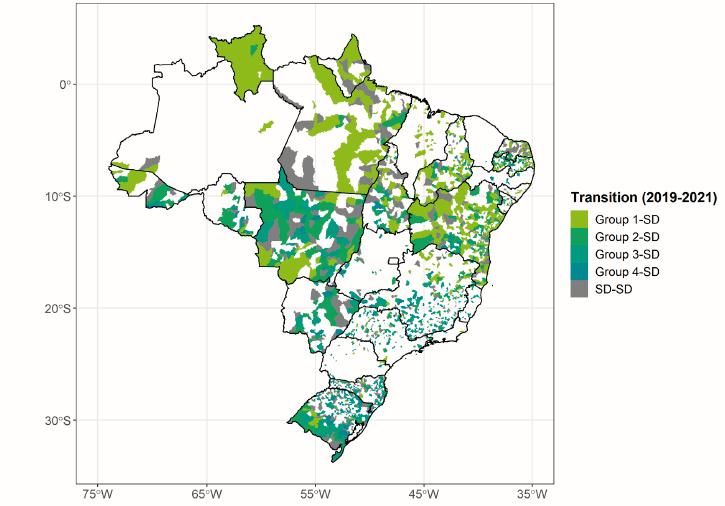
Source: Prepared by the authors based upon Inep data (2019-2021).
Figure 5 Municipalities which did not publish their results in 2021, by type of transition between 2019 and 2021
Since the data raise doubts over which factors lead a municipality to achieve the minimum participation rate in the Saeb in order for their results to be published (50% of the students), we are listing a number of variables that can be used to check on possible associations. To calculate the likelihood of this phenomenon in 2021, a logistic regression model was applied, with binomial distribution of the dependent variable. Amongst the explanatory variables are the categories of proficiency in 2019, once again following the distribution of the proficiency quartiles; the average of the Inse in 2019; the natural logarithm (ln)17 of the number of enrollments in the state secondary education system in 2021; the natural logarithm of the funds of the Vaat following the contribution of complementary funds from the Federal Union in 2021;18 and the Pandemic Response Index (IRP). The IRP varies along a scale of 0 to 10 and was proposed by Senkevics and Bof (2022) based upon information from the 2020 School Census. Its purpose is to assess the schools’ technical-pedagogical responses to the interruption of in-person activities, considering the online teaching strategies, contact with the school community, and didactic and technological support provided for the teachers, students and their families. In the regression model, the index is the average of the results obtained by the state system schools in each municipality, weighted by the number of enrollments.
With results controlled for the states, Figure 6 shows the average marginal effect of each variable. Or in other words, the average difference in percentage points of the likelihood of a municipality achieving the minimum participation rate in the Saeb in 2021, when each explanatory variable is altered in all the units of the sample, whilst maintaining all the other variables constant.
The likelihood of a municipality having achieved the minimum participation rate in the Saeb in 2021 was higher in those municipalities with better proficiency in 2019. In a municipality located in the fourth proficiency quartile, this likelihood was around 11 p.p. higher than that calculated for a municipality in the first quartile. Only the second proficiency quartile failed to exercise any significant effect on the model, due to its proximity to the reference category. Also in comparison with the reference category, not having achieved the minimum participation rate in 2019 reduced the likelihood of a municipality having available data in 2021 by 17.8 p.p. (Table 4).
Table 4 Logistic regression for calculation of the likelihood of a municipality achieving the minimum participation rate in the Saeb (2021)
| Variables | Coefficient |
|---|---|
| Categories of proficiency in 2019 (reference = 1st quartile) |
|
| 2nd quartile | 0.083 (0.116) |
| 3rd quartile | 0.366** (0.130) |
| 4th quartile | 0.66*** (0.141) |
| SD | -1.027*** (0.142) |
| Quantitative variables | |
| Pandemic Response Index (IRP) | 0.127* (0.062) |
| Ln of the number of enrollments | 0.37*** (0.039) |
| Ln of the Vaat following complementary funding | 0.045 (0.299) |
| Inse average | 0.227 (0.165) |
| Controlled results by state | Yes |
| Interception | -4.025*** (0.837) |
| Number of municipalities | 5,543 |
Source: Prepared by the authors based upon Inep data (2019-2021).
Note: Standard error between brackets.
* p < 0.05; ** p < 0.01; *** p < 0.001.
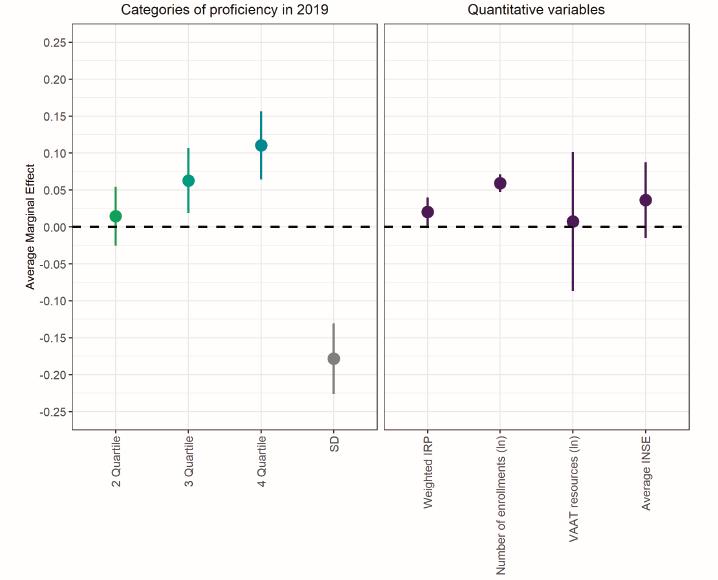
Source: Prepared by the authors based upon Inep data (2019-2021).
Note: Confidence interval of 95% and controlled results by state.
Figure 6 Average marginal effect on the likelihood of a municipality achieving the minimum participation rate in the Saeb (2021)
In a scenario notable for the relaxation of school monitoring, those municipalities in which a high number of students (above all those with learning difficulties and/or setbacks in their school progress) had dropped out of school, but whose enrollments remained active, faced serious obstacles in achieving the minimum rates of participation. These students were included in the calculation of the denominator of participation rate, whilst their presence on the day of the tests was, from the off, unlikely. Previous performance in the Saeb is a synthetic indicator of the local conditions of inclusion of the students in the school assessment system, whilst the statistics on early school leaving were found to be masked by the pandemic scenario. It should be underlined that the transition is based upon two movements of time and, as such, the evidence is limited to a specific period of Brazil’s basic education. More assertive affirmations on the association between the variables would require an understanding of a longer historical context.
Figure 6 shows that the IRP presented a positive effect on the dependent variable. Each unit of the IRP raised the likelihood of a municipality having available data in the Saeb by 2 p.p. In other words, achievement of the minimum participation rate is associated with the provision of technical and pedagogical responses to the pandemic. It is worth remembering that the capillarity of the Saeb depends upon certain logistics in the application of the tests and on the mobilization of the school community, further depending upon incentives for the students to be present on the day of the tests. In the regression model, the IRP can be interpreted as a contextual indicator of the planning of the school activities and the articulation between the players operating in the state system.
Finally, those municipalities with a higher number of enrollments in the state secondary education system present greater chances of achieving the minimum participation rate established for the Saeb. It is worth noting that, since 1990, the expansion of primary education has increased the potential number of students in secondary school, a phenomenon which is added to the expansion of the public teaching system and the strengthening of social welfare policies, with positive effects on young people remaining in and graduating from schools (Brito, 2017; Sposito et al., 2018). Considering the increase in the reach of the public teaching system in less economically dynamic locations, and taking into account the effect of other variables included in the model, the number of enrollments does not result so much from the presence of schools in the region, or from the existence of individuals of secondary school age, but rather from the size of the municipalities and their role in the organization of the state education system. Figure 6 could possibly indicate a greater capacity for articulation of the state capitals and metropolitan regions with the state and federal governments, which would guarantee a more effective mobilization of material and human resources in the application of the tests. Those municipalities with a higher number of enrollments also tend to concentrate students from urban areas, who face fewer obstacles in accessing school transportation on the day of the tests.
Neither the Inse average nor the Vaat following the contribution of complementary funding, have significant effects on the regression model.19 The results are controlled by the states and include the average proficiency indicators, which could mitigate the effects of other variables associated with inter-municipal inequalities. It should also be noted that the Inse is an aggregate indicator and, as such, the extremes of its distribution tend to be offset in unequal munici- palities. In relation to the Vaat, the complementary funding from the Federal Union alleviates the insecurities experienced by those municipalities with fewer resources, thus guaranteeing the execution of their essential activities.
Final considerations
This article has analyzed the process involved in the formation of educational statistics in Brazil, considering their premises, advances and challenges. In view of the difficulties that many municipalities and schools have in achieving the minimum participation rate established for the large-scale tests, we have highlighted some of the limits involved in the system of accountability that has been developed in Brazil since the 1990s. The use of the Ideb as a metric of school effectiveness and as an indicator of the cooperation agreements has assumed a central role in the assessment of basic education. However, this standardization contrasts with the unequal coverage provided by the educational statistics in the municipalities and schools. In addition to aggravating the situation over the past few years, the presence of an extreme situation (in this case, the Covid-19 pandemic) stretched the state capacities in place in the different regions.
We have seen that some states, above all those with the poorest educational indicators, have a high concentration of municipalities and schools without available data. The states of Rio Grande do Norte, Mato Grosso, Tocantins, Pará, Amapá and Bahia together have an extremely high frequency of municipalities which shift from the initial proficiency group to the group without available data and remain in the latter group in 2019 and 2021. This scenario challenges the creation and implementation of educational policies, given that the lack of information on school proficiency is complemented by the loss of information on those municipalities with the poorest learning indicators.
A transition matrix of the school and municipalities between 2019 and 2021 has helped shed some light on the recent scenario concerning basic education, whilst the application of a logistic regression model, focused on the municipalities, identified the factors that are associated with the provision of the available data. The results were presented according to the coefficients of the regression model and the average marginal effects of the explanatory variables, confirming that i) the low average proficiency and the inability to achieve the minimum participation rate, in 2019, are associated with a lower chance of the municipality achieving the minimum participation rate in Saeb in 2021; ii) the number of enrollments and the municipal average of the Pandemic Response Index (Senkevics & Bof, 2022) are positively associated with the likelihood of a municipality being able to include its data; and iii) the results from the Vaat, following the complementary funding from the Federal Union, and the average of the Inse do not affect the likelihood of a municipality achieving the minimum participation rate.
These results partially confirm the hypothesis that was outlined at the beginning of the study, namely, that participation in the large-scale tests depends upon structural factors, such as the initial position of the municipalities in the distribution of the past learning indicators. The only exception was found in the socioeconomic characteristics, brought together in the Inse, since this is an average indicator that is unequally distributed amongst schools and even within the same school. Furthermore, the results should be interpreted with caution, above all with respect to the context of the period of 2019 to 2021. We should stress that the aim of the article has not been to gauge the impact of the Covid-19 pandemic on the capillarity of the large scale assessments, but rather to question how, in a scenario notable for a drop in the capillarity of the Saeb, a structural problem (reproduction of the educational inequalities in the availability of the missing data) challenges the creation and implementation of public policies.
This scenario puts a limit on a decentralized and competition-focused educational management model that is based upon the periodic monitoring of the learning conditions in secondary education. Consequently, the public debate concerning the next cycle of the Saeb should take into consideration the local conditions for application of the tests, with a view to mitigating the effects of different inequalities in the capillarity of the assessment of basic education. The findings indicate that, on top of the need to have taken a more relaxed approach to the rates of approval during the pandemic, the capillarity of the Saeb was more selective and limited in 2021, providing a starting point for reflections on school proficiency.
Some issues should be addressed in more depth. This article has focused on the inequalities between municipalities and schools in the state secondary education system. In addition to expanding the study to other systems and elementary education and using a broader historical base in secondary education itself, there is a need for studies that analyze the intra-school inequalities or those that exist between regions of the same municipality. It is possible that not only the characteristics of the municipalities affect the achievement of the minimum participation rates in the Saeb, but also, in a complementary manner, the capillarity of the assessment system is lower in certain schools as well as the conditions for participation in the tests are unequally distributed between student groups. When considering the results of this article, these issues may come to form the basis for renewed reflections upon the factors that influence the capillarity of educational statistics.
Data availability statement
The data used in this article are available on the Inep electronic website or from sources informed throughout the text.
REFERENCES
Acosta, P., Loureiro, A., & Azevedo, J. (2021). A importância do Saeb e de um novo Ideb para medir os impactos da pandemia. The World Bank. https://www.worldbank.org/pt/news/opinion/2021/04/06/a-importancia-do-saeb-e-de-um-novo-ideb-para-medir-os-impactos-da-pandemia [ Links ]
Alves, M. (2020). Caracterização das desigualdades educacionais com dados públicos: Desafios para a conceituação e operacionalização empírica. Lua Nova: Revista de Cultura e Política, (110), 189-214. https://doi.org/10.1590/0102-189214/110 [ Links ]
Alves, M., & Soares, F. (2013). Contexto escolar e indicadores educacionais: Condições desiguais para a efetivação de uma política de avaliação educacional. Educação e Pesquisa, 39(1), 177-194. https://doi.org/10.1590/S1517-97022013000100012 [ Links ]
Araújo, H., Codes, A., & Uderman, L. (2019). O Ideb como instrumento de gestão para uma educação de qualidade: A educação brasileira vista pelas lentes do Ideb. Instituto de Pesquisa Econômica Aplicada. [ Links ]
Arretche, M. (2002). Relações federativas nas políticas sociais. Educação & Sociedade, 23(80), 25-48. https://doi.org/10.1590/S0101-73302002008000003 [ Links ]
Arretche, M., Marques, E., & Faria, C. (2021). Produzindo mudanças por estratégias incrementais: A inclusão social no Brasil pós-1988. In M. Arretche, E. Marques, & C. Faria (Orgs.), As políticas da política: Desigualdade e inclusão nos governos no PSDB e do PT (pp. 352-367). Editora Unesp. [ Links ]
Barbosa, L. (2006). As relações intergovernamentais entre o estado e os municípios: Um estudo sobre o regime de colaboração entre os sistemas de ensino em Pernambuco [Dissertação de mestrado, Universidade Federal de Pernambuco]. Attena: Repositório Digital de UFPE. https://repositorio.ufpe.br/handle/123456789/4420 [ Links ]
Bof, A. M. (2022). Quais são os níveis adequados de aprendizagem para os estudantes brasileiros da educação básica? Cadernos de Estudos e Pesquisas em Políticas Educacionais, 6, 11-47. https://doi.org/10.24109/9786558010531.ceppe.v6.5376 [ Links ]
Brito, M. (2017). Novas tendências ou velhas persistências? Modernização e expansão educacional no Brasil. Cadernos de Pesquisa, 47(163), 224-263. https://doi.org/10.1590/198053143789 [ Links ]
Castro, J. (2009). Evolução e desigualdade na educação brasileira. Educação & Sociedade, 30(108), 673-697. https://doi.org/10.1590/S0101-73302009000300003 [ Links ]
Centro Regional de Estudos para o Desenvolvimento da Sociedade da Informação. (2020). Painel TIC COVID-19: Pesquisa sobre o uso da Internet no Brasil durante a pandemia do novo Coronavírus. Cetic. https://cetic.br/media/docs/publicacoes/2/20201104182616/painel_tic_covid19_3edicao_livro%20eletr%C3%B4nico.pdf [ Links ]
Conselho Nacional da Juventude (Conjuve). (2021). Juventudes e a pandemia do coronavírus. Atlas das Juventudes. https://atlasdasjuventudes.com.br/biblioteca/pesquisa-juventudes-e-a-pandemia-do-coronavirus-2021/ [ Links ]
Decreto n. 6.094, de 24 de abril de 2007. (2007). Dispõe sobre a implementação do plano de metas Compromisso Todos Pela Educação, pela União federal, em regime de colaboração com municípios, distrito federal e estados, e a participação das famílias e da comunidade, mediante programas e ações de assistência técnica e financeira, visando a mobilização social pela melhoria da qualidade da educação básica. Brasília, DF. [ Links ]
Duarte, N. (2013). O impacto da pobreza no Ideb: Um estudo multinível. Revista Brasileira de Estudos Pedagógicos, 94(237), 343-363. [ Links ]
Fernandes, J., & Nogueira, J. F. F. (2020). Plano de Ações Articuladas: Melhoria da educação e redução das desigualdades. In J. Mello, V. Ribeiro, G. Lotta, A. Bonamino, & C. Carvalho (Orgs.), Implementação de políticas e atuação de gestores públicos: Experiências recentes das políticas de redução das desigualdades (pp. 175-190). Instituto de Pesquisa Econômica Aplicada. [ Links ]
Fernandes, R. (2016). A universalização da avaliação e a criação do Ideb: Pressupostos e perspectivas. Em Aberto, 29(96), 99-111. https://doi.org/10.24109/2176-6673.emaberto.29i96.%25p [ Links ]
França, M., & Gonçalves, F. (2010). Provisão pública e privada de educação fundamental: Diferenças de qualidade medidas por meio de propensity score. Economia Aplicada, 14(4), 373-390. https://doi.org/10.1590/S1413-80502010000400006 [ Links ]
Gesqui, L. (2016). O Ideb como parâmetro de qualidade da educação básica no Brasil: Algumas preocupações. Cadernos de Pesquisa, 23(3), 88-99. https://doi.org/10.18764/2178-2229.v23n3p88-99 [ Links ]
Gomes, S. (2019). Sobre a viabilidade de uma agenda de pesquisa coletiva integrando implementação de políticas, formulação e resultados. In G. Lotta (Org.), Teorias e análise sobre implementação de políticas públicas no Brasil (pp. 39-66). Escola Nacional de Administração Pública. [ Links ]
Gonçalves, F., & França, M. (2008). Transmissão intergeracional de desigualdade e qualidade educacional: Avaliando o sistema educacional brasileiro a partir do Saeb 2003. Ensaio: Avaliação e Políticas Públicas em Educação, 16(61), 639-662. https://doi.org/10.1590/S0104-40362008000400009 [ Links ]
Instituto Nacional de Estudos e Pesquisas Educacionais Anísio Teixeira (Inep). (2021). Resultados da segunda edição da pesquisa: Resposta educacional à pandemia de covid-19 no Brasil. Inep. https://download.inep.gov.br/censo_escolar/resultados/2021/apresentacao_pesquisa_covid19_censo_escolar_2021.pdf [ Links ]
Lei n. 9.394, de 20 de dezembro de 1996. (1996). Estabelece as diretrizes e bases da educação nacional. Brasília, DF. [ Links ]
Lei n. 10.172, de 9 de janeiro de 2001. (2001). Aprova o Plano Nacional de Educação e dá outras providências. Brasília, DF. [ Links ]
Lei n. 13.005, de 25 de junho de 2014. (2014). Aprova o Plano Nacional de Educação - PNE e dá outras providências. Brasília, DF. [ Links ]
Lei n. 13.415, de 16 de fevereiro de 2017. (2017). Altera as Leis n. 9.394, de 20 de dezembro de 1996, que estabelece as diretrizes e bases da educação nacional, e 11.494, de 20 de junho 2007, que regulamenta o Fundo de Manutenção e Desenvolvimento da Educação Básica e de Valorização dos Profissionais da Educação, a Consolidação das Leis do Trabalho - CLT, aprovada pelo Decreto-Lei n. 5.452, de 1º de maio de 1943, e o Decreto-Lei nº 236, de 28 de fevereiro de 1967; revoga a Lei n. 11.161, de 5 de agosto de 2005; e institui a Política de Fomento à Implementação de Escolas de Ensino Médio em Tempo Integral. Brasília, DF. [ Links ]
Lei n. 14.113, de 25 de dezembro de 2020. (2020). Regulamenta o Fundo de Manutenção e Desenvolvimento da Educação Básica e de Valorização dos Profissionais da Educação (Fundeb), de que trata o art. 212-A da Constituição Federal; revoga dispositivos da Lei n. 11.494, de 20 de junho de 2007; e dá outras providências. Brasília, DF. [ Links ]
Lotta, G., Gonçalves, R., & Bitelman, M. (2014). A coordenação federativa de políticas públicas: Uma análise das políticas brasileiras nas últimas décadas. Cadernos Gestão Pública e Cidadania, 19(64), 2-18. [ Links ]
Lourenço, R., Nascimento, J., Sauerbronn, F., & Macedo, M. (2017). Determinantes sociais e pedagógicos das notas do Ideb. Revista Pensamento Contemporâneo em Administração, 11(4), 27-43. [ Links ]
Medeiros, M., & Oliveira, L. (2014). Desigualdades regionais em educação: Potencial de convergência. Revista Sociedade e Estado, 29(2), 561-585. [ Links ]
Mello, L., & Bertagna, R. (2016). Apontamentos iniciais sobre qualidade educacional: Resultados do Ideb e fatores socioeconômicos. Revista Iberoamericana de Estudos em Educação, 11(3), 1132-1148. [ Links ]
Oliveira, A. (2020). Educação de qualidade em regime de colaboração. Governo do Estado do Ceará. https://www.ceara.gov.br/wp-content/uploads/2020/12/livro_educacao_em_regime_de_colaboracao_virtual.pdf [ Links ]
Oliveira, V., & Couto, C. (2019). Diretrizes prioritárias e fases da implementação: Como mudam as políticas públicas. In G. Lotta (Org.), Teorias e análise sobre implementação de políticas públicas no Brasil (pp. 67-98). Escola Nacional de Administração Pública. [ Links ]
Padilha, F., Êrnica, M., Batista, A., & Pudenzi, L. (2012). As regularidades e exceções no desempenho do Ideb dos municípios. Estudos em Avaliação Educacional, 25(51), 58-81. https://doi.org/10.18222/eae235120121948 [ Links ]
Portaria n. 250, de 5 de julho de 2021. (2021). Estabelece as diretrizes de realização do Sistema de Avaliação da Educação Básica (Saeb) no ano de 2021. Brasília, DF. [ Links ]
Portaria n. 316, de 4 de abril de 2007. (2007). Dispõe sobre o Censo Escolar da Educação Básica que será realizado em regime de colaboração entre a União, os Estados e os municípios, coordenado pelo Instituto Nacional de Estudos e Pesquisas Educacionais Anísio Teixeira - INEP. Brasília, DF. [ Links ]
Portaria n. 366, de 29 de abril de 2019. (2019). Estabelece as diretrizes de realização do Sistema de Avaliação da Educação Básica (SAEB) no ano de 2019. Brasília, DF. [ Links ]
Portaria n. 447, de 24 de maio de 2017. (2017). Estabelece diretrizes para o planejamento e a operacionalização do Sistema de Avaliação da Educação Básica (Saeb) no ano de 2017. Brasília, DF. [ Links ]
Schneider, M., & Nardi, E. (2014). O Ideb e a construção de um modelo de accountability na educação básica brasileira. Revista Portuguesa de Educação, 27(1), 7-28. [ Links ]
Senkevics, A., & Bof, A. M. (2022). Desigualdades educacionais na pandemia: Análise das respostas das escolas brasileiras à suspensão das atividades presenciais em 2020. Caderno de Estudos e Pesquisas em Políticas Educacionais, 7, 173-209. https://doi.org/10.24109/9786558010630.ceppe.v7.5574 [ Links ]
Soares, J. (2020). José Francisco Soares: Está na hora de mudar o Ideb? Simon’s Site. https://www.schwartzman.org.br/sitesimon/2020/09/ [ Links ]
Soares, J., & Xavier, F. (2013). Pressupostos educacionais e estatísticos do Ideb. Educação & Sociedade, 34(124), 903-923. https://doi.org/10.1590/S0101-73302013000300013 [ Links ]
Souza, D., & Batista, N. (2016). Balanço das avaliações municipais do Plano de Ações Articuladas: Desafios atuais ao desenvolvimento da Política Nacional PAR. Educação em Revista, 32(1), 105-131. https://doi.org/10.1590/0102-4698140705 [ Links ]
Sposito, M., Souza, R., & Silva, F. (2018). A pesquisa sobre jovens no Brasil: Traçando novos desafios a partir de dados quantitativos. Educação e Pesquisa, 44, Artigo e170308. https://doi.org/10.1590/S1678-4634201712170308 [ Links ]
Vidal, E., & Vieira, S. (2011). Gestão educacional e resultados no Ideb: Um estudo de caso em dez municípios cearenses. Estudos em Avaliação Educacional, 22(50), 419-434. https://doi.org/10.18222/eae225020111963 [ Links ]
Vieira, S., & Vidal, E. (2013). Construindo uma história de colaboração na educação: A experiência do Ceará. Educação & Sociedade, 34(125), 1075-1093. https://doi.org/10.1590/S0101-73302013000400004 [ Links ]
Welter, C., & Werle, F. (2021). Processos de invisibilização na avaliação em larga escala. Ensaio: Avaliação e Políticas Públicas em Educação, 29(111), 441-460. https://doi.org/10.1590/S0104-40362020002802542 [ Links ]
1One important decision concerned the establishment of minimum sums for the funding of each student, with the Federal Union being responsible for supplementing the funds of the municipal and state governments (Oliveira & Couto, 2019).
2In 2005, the Saeb was divided into two assessments: the Prova Brasil [Brazil Exam] and the Avaliação Nacional da Educação Básica [National Basic Education Assessment] (Aneb). The Aneb maintained the characteristics of the Saeb and, as such, continued to be referred to as this in official publications (Schneider & Nardi, 2014).
3The restructuring is still under way in the public system, with a need for studies designed to evaluate its impacts on educational inequalities.
5This relaxation was recommended by the Conselho Nacional de Educação [National Board of Education] (CNE), with the aim of ensuring that schools were able to adapt their activities to online teaching.
6According to a study performed by the Conselho Nacional da Juventude [National Youth Council] (Conjuve, 2021), 10% of young people aged between 15 and 17 were enrolled in schools but had not been participating in the classes.
7The sufficient level of learning is established by a proficiency scale created by Todos pela Educação [All for Education] and is divided into four levels of learning. The sufficient level of learning brings together the “proficient” and “advanced” categories (Bof, 2022).
8Prior to publishing the 2021 Saeb results, some state governments applied diagnostic assessments involving samples of students. The results were extremely discouraging. In the state of São Paulo, for example, the results of a sample study highlighted a divergence of 18.2 points on the Saeb scale in mathematics and 10.9 points in Portuguese language, when comparing the data obtained in 2021 and 2019. Amongst other problems, the unequal access of schools and homes to information and communication technologies (ICT) made the balanced and equal implementation of online teaching impossible (Centro Regional de Estudos para o Desenvolvimento da Sociedade da Informação, 2020).
9The Ideb also varied between the public and private systems. In 2021, the index was around 1.4 times higher in the private secondary education system than in the public one (5.6 against 3.9).
10Of the Brazilian municipalities, 28.2% demonstrated stability or growth of the IN between 2019 and 2021, whilst 75% experienced the same in relation to the IP.
11Whilst the “weak” accountability is limited to the publication of results, in the “strong” accountability programs, the measurement of performance is used as a criterion for rewards and/or penalties (Fernandes, 2016).
12The municipalities and schools which failed to publish their results were those without available Saeb data, but which had registered their information in the state secondary education system School Census. This procedure excludes the municipalities and schools without enrolled students.
13Roraima also falls into this category. However, the state is made up of just 15 municipalities, which limits the assessment.
14The Inse combines the educational level achieved by the parents, the ownership of the durable consumer goods at the home, and the family income.
15Group 1 contains the municipalities with an IN less than or equal to 4.19; Group 2, with an IN higher than 4.19 and less than or equal to 4.6; Group 3, with an IN higher than 4.6 and less than or equal to 4.95; Group 4, the municipalities with an IN higher than 4.95; and SD, the municipalities which did not publish their results. Amongst the schools, the respective values were: IN less than 4.21; higher than 4.21 and less than or equal to 4.63; higher than 4.63 and less than or equal to 5.03; and higher than 5.03.
17The logarithmic transformation is recommended when the distribution of the quantitative variables is asymmetric, which could affect the results of a regression. This was observed in two of the model’s variables, thus justifying the application of this procedure.
18In 2021, the municipalities with investment per student lower than BRL 4,821.99 received complementary funding from the Federal Union within the sphere of distribution of Fundeb funds. The data used in the regression relate to the investment per student after the contribution of this complementary funding.
19With a very high p-value and/or confidence interval, which precludes precise analyses of the effects of these variables. This is applicable both to the coefficients and to the average marginal effects.
Appendix A
Table A1 Proportion of municipalities which did not publish their results in 2021 and proportion of municipalities which did not publish their results in 2019 and 2021 (in % of municipalities of the state)
| State | Proportion of municipalities which did not publish their results in 2021 | Proportion of municipalities which did not publish their results in 2019 and 2021 |
|---|---|---|
| Acre | 50 | 9.09 |
| Alagoas | 17.35 | 2.04 |
| Amazonas | 4.84 | 1.61 |
| Amapá | 37.50 | 18.75 |
| Bahia | 59.13 | 12.26 |
| Ceará | 0.54 | - |
| Espírito Santo | 17.95 | 2.56 |
| Goiás | 6.5 | 2.85 |
| Maranhão | 14.29 | 0.92 |
| Minas Gerais | 32.78 | 5.41 |
| Mato Grosso do Sul | 34.18 | 20.25 |
| Mato Grosso | 55 | 24.29 |
| Pará | 33.33 | 19.44 |
| Paraíba | 54.71 | 8.07 |
| Pernambuco | 1.62 | - |
| Piauí | 39.73 | 9.38 |
| Paraná | 5.28 | 1.01 |
| Rio de Janeiro | 4.35 | 1.09 |
| Rio Grande do Norte | 36.14 | 40.36 |
| Rondônia | 36.54 | 5.77 |
| Roraima | 93.33 | - |
| Rio Grande do Sul | 40.66 | 19.51 |
| Santa Catarina | 30.93 | 27.84 |
| Sergipe | 26.67 | 12 |
| São Paulo | 16.77 | 4.19 |
| Tocantins | 35.04 | 18.98 |
Source: Prepared by the authors based upon Inep data (2019-2021).
Appendix B
Table B1 Proportion of municipalities which experienced each type of transition between 2019 and 2021 (in % of municipalities of the state)
| State | Group 1 - SD | Group 2 - SD | Group 3 - SD | Group 4 - SD | SD - SD |
|---|---|---|---|---|---|
| Acre | 18.18 | 13.64 | 13.64 | 4.55 | 9.09 |
| Alagoas | 14.29 | 2.04 | 1.02 | - | 2.04 |
| Amazonas | 4.84 | - | - | - | 1.61 |
| Amapá | 37.5 | - | - | - | 18.75 |
| Bahia | 35.82 | 17.07 | 3.85 | 2.4 | 12.26 |
| Ceará | - | - | - | 0.54 | - |
| Espírito Santo | - | 1.28 | 5.13 | 10.26 | 2.56 |
| Goiás | - | 1.22 | 2.03 | 2.03 | 1.63 |
| Maranhão | 12.9 | 1.38 | - | - | 0.92 |
| Minas Gerais | 4 | 7.87 | 7.29 | 8.23 | 5.41 |
| Mato Grosso do Sul | - | 16.46 | 11.39 | 6.33 | 20.25 |
| Mato Grosso | 15.71 | 22.14 | 13.57 | 2.86 | 23.57 |
| Pará | 31.25 | 2.08 | - | - | 19.44 |
| Paraíba | 21.08 | 17.94 | 8.97 | 4.04 | 8.07 |
| Pernambuco | - | - | 0.54 | 1.08 | - |
| Piauí | 25.45 | 9.82 | 3.57 | 0.89 | 9.38 |
| Paraná | 0.5 | 1.51 | 1.01 | 1.76 | 1.01 |
| Rio de Janeiro | 1.09 | 1.09 | 1.09 | 1.09 | 1.09 |
| Rio Grande do Norte | 20.48 | 10.84 | 3.01 | 0.6 | 40.36 |
| Rondônia | 3.85 | 17.31 | 7.69 | 7.69 | 5.77 |
| Roraima | 86.67 | 6.67 | - | - | - |
| Rio Grande do Sul | 2.05 | 5.75 | 12.32 | 16.02 | 18.28 |
| Santa Catarina | 1.72 | 6.19 | 10.65 | 10.31 | 27.49 |
| Sergipe | 12 | 12 | 2.67 | - | 12 |
| São Paulo | 1.86 | 4.81 | 5.59 | 3.88 | 4.04 |
| Tocantins | 14.6 | 12.41 | 2.92 | 3.65 | 18.98 |
Source: Prepared by the authors based upon Inep data (2019-2021).
Received: March 15, 2023; Accepted: August 02, 2023
 Este é um artigo publicado em acesso aberto sob uma licença Creative Commons
