


Serviços Personalizados
Journal

Artigo
 texto em
  Inglês (pdf)
 Artigo em XML
 Enviar este artigo por email
Compartilhar

 Permalink
Educação e Realidade
versão impressa ISSN 0100-3143versão On-line ISSN 2175-6236
Educ. Real. vol.45 no.4 Porto Alegre 2020 Epub 24-Nov-2020
https://doi.org/10.1590/2175-623693008
OTHER THEMES
Class Condition and Educational Performance in Brazil

IUniversidade Federal da Fronteira Sul (UFFS), Erechim/RS - Brazil
This paper analyzes the effects of social class on the educational performance of young Brazilians students. Our theoretical approach in this study is based on Pierre Bourdieu’s concept of social class. We opted for a quantitative methodology using the database of the Basic Education Evaluation System (Saeb) tests carried out in 2013. We used descriptive statistics, correspondence analysis and multiple linear regression. Empirical results showed the persistence of the effects of social class on academic performance, although these results coexist with the impacts of variables related to schooling, individual life story and pedagogical aspects.
Keywords: Social Class; Economic Capital; Cultural Capital; Educational Performance
O objetivo do artigo é analisar o impacto da condição de classe dos estudantes brasileiros da educação básica nos seus desempenhos educacionais. Os fundamentos teóricos da pesquisa remetem ao conceito de classe social de Pierre Bourdieu. A partir de uma abordagem quantitativa, utilizamos a base de dados do Sistema de Avaliação da Educação Básica (Saeb), realizado em 2013. As técnicas analíticas mobilizadas foram a estatística descritiva, a análise de correspondência e a regressão linear múltipla. Os resultados empíricos demonstraram a persistência dos efeitos da classe social na conformação dos rendimentos acadêmicos, ainda que coexistindo com os impactos das variáveis de escolarização, de trajetória individual e de caráter pedagógico.
Palavras-chave: Classe Social; Capital Econômico; Capital Cultural; Desempenho Educacional
Introduction
The aim of this paper is to examine the impacts of class condition on the performance of Brazilian students in basic education. The relationship between social origin and success or failure in formal education is recurrent in academic literature, in Brazil as well as around the world (Barbosa, 2009; Soares; Collares, 2006; Bourdieu, 2008; Bowles; Gintis, 1974).
Despite this, even if inequalities remain at the center of public debates at the beginning of this century (Scalon; Salata, 2016; Piketty, 2014), the quality of Brazilian basic education has not been progressing, as indicated by the poor results often found in evaluations such as the Program for International Student Assessment (PISA). The intersection of these phenomena justifies paying careful attention - in a continuous updating - to the determinants of our students’ performance focusing on multiple areas, one of which is class condition.
The theoretical/empirical approach of Pierre Bourdieu (2008, 2007) is at the basis of our study. As a measure of educational performance, we used the data for 2013 of the country’s main large-scale educational assessment, the Basic Education Evaluation System (Saeb). Saeb is composed of tests that assess proficiency in Portuguese and mathematics, in addition to contextual questionnaires on the lives of students and characteristics of schools and teachers.
Wide-ranging evaluations should be considered only one of the measures for assessing an education system (Dourado, 2007). There are many discussions about reducing the notion of educational performance to proficiency in just two school subjects. On the other hand, this does not detract from the fact that knowing how to read and write, while interacting with a variety of texts, and knowing how to perform logical and mathematical operations are basic skills for life in society.
This paper is divided into three parts: first, an overview of the relationship between education and inequality; next, we discuss the methodology of our empirical work, presenting how we applied the concept of social class and a description of statistical techniques; finally, we discuss the research’s main results and address the weight and particularities of the influence of social class on the educational performance of Brazilian students.
Social Inequalities and Formal Education
The second half of the twentieth century saw the consolidation of a whole field of studies that started to discuss the bases of formal education, reflecting on the role that schooling plays as a central institution for the reproduction of inequalities in modern capitalist societies. Neomarxists approaches argue that the school would serve to reproduce the social relations of production. The function of the school would be to prepare a passive workforce well adjusted to the economic hierarchies of capitalism. Differences in school performance would mirror work inequalities. The school would be the means for reinforcing the ideology of the dominant classes, making young workers adapt from an early age to the dictates of capital (Althusser, 1980; Baudelot; Establet, 1975; Bowles; Gintis, 1974).
It was Pierre Bourdieu (2008, 2007) who gave a broader outline to the thesis that educational systems help in the reproduction of social inequalities. For the French sociologist, society must be understood through the notion of social space, a space of social positions and power relations in dispute and movement. The basis of the notion of social space is the idea of difference, or of a gap, in a complex set of coexisting but distinct positions, “[...] exterior to one another and which are defined in relation to one another through their mutual exteriority and their relations of proximity, vicinity, or distance, as well as through relations of order, such as above, below, and between” (Bourdieu, 1996, p. 18-19).
In modern times, the social space was fragmented in different fields, which started to have autonomy in relation to each other. These fields are microcosms with their own rules, in which agents dispute positions of power on the basis of the volume and composition of the capital they own. Bourdieu (2008) talks about four types of capital, of which two are determinants of the performance of agents in different fields, and, thus, of the position of these agents in the social space. Economic capital is defined in terms of income, relationship with the means of production and possession of material goods. Cultural capital is divided into three different, interrelated dimensions:
Cultural capital can exist in three forms: in the embodied state, i.e., in the form of long-lasting dispositions of the mind and body; in the objectified state, in the form of cultural goods (pictures, books, dictionaries, instruments, machines, etc.), which are the trace or realization of theories or critiques of these theories, problematics, etc.; and in the institutionalized state, a form of objectification which must be set apart because, as will be seen in the case of educational qualifications (author’s emphasis), it confers entirely original properties on the cultural capital which it is presumed to guarantee (Bourdieu, 2007, p. 74).
What does the school have to do with all this? According to Bourdieu, the global cultural stock (cultural capital) of nuclear families explains the success or failure of students in educational institutions. “In all fields of culture, theater, music, painting, jazz, cinema, the students’ knowledge is so much richer and more extensive the higher their social origin” (Bourdieu, 2007, p. 45). In addition to direct contact with cultural goods and family training, young people from privileged classes inherit knowledge, tastes and cultural dispositions that fit the demands of institutionalized education.
The social space has a synchronic dimension (properties, capital) and a diachronic dimension that is shaped by modal trajectories, i.e. routes more often traveled by agents, connecting particular origins and destinations and representing the typical forms of capital appropriation (Bertoncelo, 2013). The composition of the agents’ capital and the modal trajectories are the two most relevant elements to differentiate relative positions in the social space, since they form the main lines of division and conflict in modernity. The positions in the social space differ relationally in the face of a variety of social determinants (the class condition).
Social groups, and especially social classes, exist twice, so to speak, and they do so prior to the intervention of the scientific gaze itself: they exist in the objectivity of the first order, that which is recorded by distributions of material properties; and they exist in the objectivity of the second order, that of the contrasted classifications and representations produced by agents on the basis of a practical knowledge of these distributions such as they are expressed in lifestyles. These two modes of existence are not independent, even as representations enjoy a definite autonomy with respect to distributions (Bourdieu, 2013, p. 111).
To socialize in this or that region of the social space means that the agent has incorporated a set of dispositions for action, a class habitus, systems of long-lasting and transposable dispositions that inform the perceptions, actions and classifications of agents in different social fields. The habitus acts as a pre-reflexive principle that coordinates the agents’ perceptions and classifications, in addition to establishing probabilities of action. Through the mediation of habitus, the generation of classifiable and classifying practices, the objective social space of the first order is transformed into a symbolic space and the practices of agents become signs of distinction. The habitus organizes the production of a homology between the symbolic space and the social space, making the hierarchy of lifestyles appear as a new expressive translation of the social space’s objective dissimilarities.
In short, the theoretical model proposed by Bourdieu implies the overlapping of three analytical schemes: the social space, the habitus and the space of lifestyles, with the habitus being the element that mediates the transmutation of objective differences into distinctive signs. It seems clear, thus, that the social space is, simultaneously, a structure of objective relationships, which is at the origin of the perception, classification and action schemes that guide practices, and a set of strategic places from which the agents struggle around the appropriation (and appreciation) of capital and the imposition of principles of classification and (di)vision of the world (author’s emphasis) (Bertoncelo, 2016a, p. 75).
Social conflicts in modernity mainly revolve around symbolic disputes over access to scarce goods and resources, but this does not mean disregard for the objective conditions for survival. On the one hand, symbolic disputes are conditioned, in part, by the objective properties of social space; on the other hand, they influence the social space itself (Wacquant, 2007).
Bourdieu (2008, 2007) argues that the school privileges the privileged, as it does not take into account cultural disparities among students before to their entry in the school’s game. Similar methods, similar forms of evaluations and similar pedagogies are applied to people with very different class habitus, especially with regard to cultural capital. “It is, in short, the inner logic of a system whose objective function is to preserve the values which are the basis of the social order” (Bourdieu, 2007, p. 56).
Agreeing or not with Bourdieu, more diverse research approaches began to guide studies on education, society and inequalities. Ethnomethodologists argue that students’ failure or success in educational establishments should be studied as practical constructions of agents. Charlot (2000) proposes that the school has to be seen as a place that goes beyond social differentiation, but that congregates and organizes itself around the transmission of knowledge.
The relationship between social conditions and schooling results is addressed in the recent works of Duncan and Murnane (2011), both Americans. They point out that the widening gap between the academic achievement of children growing up in wealthy and poor families is a reality in the United States. Between 1978 and 2008, the gap between the reading test scores of children from high and low income families grew by one third. This is reflected in a growing gap in completed schooling. In the past 20 years, the rate of wealthy children who completed college has increased by 21 percentage points, while the rate of college graduation of children from low-income families has increased by only four percentage points (Duncan; Murnane, 2011).
In Brazil, Barbosa (2009) analyzes the school institution, examining the social relations internal to the school, to study the reasons or, at least, the school factors that can be associated with the increase in social inequalities (Barbosa, 2009, p. 21). Barbosa’s research shows the strong effect of the presence of parents at home, the differences in social resources in families headed by men and women, the mother’s occupation and available time, the help received at home and the number of children in the family. Moreover, Barbosa (2009, p. 183) summarizes “[...] the effect of the school can, at least in part, reduce the effects of the social position of students on their school performance.”
In detailing the class structure of Brazilian society, Costa Ribeiro (2014) observes some decrease in the impact of social origin on Brazilian educational outcomes in recent decades. The author also warns that “[...] analyzes show that, even when we take into account the type of school, socioeconomic inequalities in opportunities remain” (Costa Ribeiro, 2011, p. 79).
Methodology
This study uses the database of the Basic Education Evaluation System (Saeb), launched in 1990 by the National Institute for Educational Studies and Research Anísio Teixeira (INEP) of the Ministry of Education (MEC). Saeb is a system for sample evaluation of Brazilian students’ performance conducted every two years. Together with information on the quality of teaching, Saeb produces data that make it possible to better understand the external and internal conditions involved in learning, through questionnaires answered by students, teachers and school directors. Saeb also collect information on the schools’ physical structure and the didactic and pedagogical resources available at each school.
Saeb prepares evaluations for students from all regions and education systems. The math and Portuguese language tests are applied to students in the 5th and 9th years of basic education and to students in the 3rd year of high school, providing data on student achievement in three key moments of basic education.
Saeb is divided into a census component and a sample component. The census evaluation includes public schools with more than 20 students, from the 5th to the 9th grade of basic education. The sample evaluation involves private schools with 10 or more students in regular classes, in addition to public and private schools with 10 or more students in regular classes attending the 3rd year of high school. In order to allow more specific analyzes, another sample is added including public schools with 10 to 19 students.
Saeb editions are comparable at least since 2003, due to the similarities in sample planning. Students are divided into six groups of fundamental populations, according to the grade they are attending and the administrative affiliation of the school. A cross-classified sampling of students is used, considering that it is not possible to select student by student.
Data from Saeb 2013
Saeb micro data is made available online by INEP at its institutional website. After downloading the raw data, we have carried out a series of operations to organize the database according to our research interests2. We used IBM-SPSS software, version 21, to handle data and produce statistics.
Initially, it was necessary to merge all TS_ALUNOS spreadsheets, which contain the students’ data for each grade, in a single spreadsheet. Because of the difference in the sequence of questions and answers in the questionnaires, we made some changes to the variables in these spreadsheets. The variables were named according to the equivalence of questions and answers, that is, in the TS_ALUNO_3EM spreadsheet, the variable TX_RESP_Q032 is related to the following question: “How often do you read news magazines in general?”; in the spreadsheets TS_ALUNO_5EF and TS_ALUNO_9EF the corresponding variables are the TX_RESP_Q034. Thus, all equivalent questions were renamed to ensure the proper equivalence of questions after the merger of these spreadsheets. Variables that exist in a single spreadsheet and not in the others remained after the merger with only the data for that spreadsheet.
To avoid conflicts in the naming of the variables that contain the answers to the questionnaires of the teacher, students and school spreadsheets, when these spreadsheets were merged, TX_RESPA_000 variables came from the student spreadsheet; TX_RESPE_000 from the school spreadsheet and TX_RESPP_000 from the teacher spreadsheet. In the respective separate spreadsheets they are all named as TX_RESP_000. However, after the spreadsheets were merged and the variables common to all of them were identified, the variables were renamed again considering their main characteristic, such as RESIDENCIAPAI_AQ022 when referring to the question addressed to the student: Do you live with your father?
The first merger of spreadsheets resulted in the TS_ALUNO_3EM+9EF+5EF spreadsheet created from the TS_ESCOLA spreadsheet, using the key variable ID_ESCOLA in SPSS. Thus, all the student spreadsheet items associated with the ID of school X, received the variables referring to this school X. The second merger was of this spreadsheet (Student + School) with the TS_PROFESSOR spreadsheet. Using the variable ID_TURMA as the key variable, the merger was performed making each class (turma) on the Student + School spreadsheet receive all the variables related to it from the TS_PROFESSOR spreadsheet. However, each ID_TURMA may appear more than once, since it is possible to have more than one teacher per class, and since only one teacher per ID_TURMA is needed to perform the merger, we selected the first teachers in each case. In this way, the final spreadsheet associates students, school and teacher and supports further analysis with these associated data.
Sampling
The final sample used for our analysis contains 269,693 cases, representing students from all the country’s regions, from the 5th and 9th years of basic education, from the 3rd year of high school and from all school systems, in both rural and urban areas.
To ensure this proportional representation, stratified random sampling is used, which consists of: (1) identifying these significant subgroups; (2) calculating the relative weight (%) of each subgroup in the population; (3) using, for each subgroup, a simple random sampling procedure to choose (in the same proportion that they are represented in the population) the subjects who will integrate the sample. The SPSS software can perform this sampling in a simple and automatic way, just by defining in which variable the strata will be identified and what percentage of the total population (and, consequently, of each stratum) will compose the sample. In this case, the ID_UF variable (states) was chosen to select the respective strata (27 strata - RO, AC, AM, RR, PA, AP, TO, MA, PI, CE, RN, PB, PE, AL, SE, BA, MG, ES, RJ, SP, PR, SC, RS, MS, MT, GO, DF). The sample was defined as 5% of the population, considering that, for large populations (with about 100,000 cases or more), it is not necessary to increase the sample size, as the margin of error will not be reduced by much (Ramos, 2014 , p. 32).
Statistics
We used descriptive statistics, correspondence analysis and multiple linear regression. Correspondence analysis is an exploratory analysis of categorical data, useful for examining double entry tables, investigating the correspondence measures of rows and columns. It allows visualizing the proximity relationships between variables in a kind of two-dimensional map, while associations can be interpreted by their proximity or distances (Bertoncelo, 2016b; Greenacre; Blasius, 1994). It can be applied in its simple form, producing graphics with the categories for only two variables. It can also be applied in its multiple form, generating graphs with several variables simultaneously.
By using multiple correspondence analysis, we were able to simplify the assessment of complex data relationships with the geometric observation of the associations between the categories of the variables used by the researcher (Cyrino, 2011). The logic of the multiple correspondence analysis involves a matrix in which the lines are the cases (here the students evaluated by Saeb 2013) and the columns the characteristics, such as their volume of capital, the location in the class strata, the quality level of the school attended, etc. The graphs illustrating the relative positions in the geometric space are derived from this matrix. Each student (matrix line) has a profile related to the answers given for each topic of the information collecting instruments (questionnaires and scores), and each variable (column) has a profile related to the distribution of students.
As our aim is to analyze the influence of social issues on school performance, another technique used is multiple linear regression. We were thus able to reveal the influence of a set of independent variables on a quantitative dependent variable (student proficiency). In order to avoid working with too many variables, we need to experiment with exchanging one or more variables for others, either manually or by some variable selection algorithm, such as the stepwise method, selected for this research. It adds the most significant variable and removes the least significant variable at each step, but for that it is necessary to define the partial F statistics (for testing the statistical significance) that will be used. Due to the large number of variables available, we chose to use a FIN = 0.01, that is, the variable enters the model if the F statistic is higher than this value, and a FOUT = 0.05, the variable is removed from the model if the F statistic is lower than this value.
Indicators
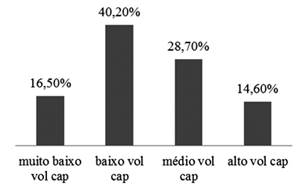
In order to perform correspondence analysis, which demands the use of categorical variables, we built an indicator of capital volume (class condition in Bourdieu) with the levels very low, low, medium and high. The cutoff point between each category was based on the mean and more or less one standard deviation. It means that students in the very low capital volume category scored between zero and 10 points on the capital scale; students in the low category scored between 11 and 15 points; those in the medium category scored between 16 and 20 points; and students in the high capital volume category scored between 21 and 47 on the scale that indicates the volume of economic and cultural capital of students and their families. Students were distributed as follows among the different categories:
To perform multivariate regression, we used individual categorical variables to indicate the objective dimension of the concept of class in Bourdieu (2013), based on economic capital and cultural capital. Five variables for economic capital and five variables for cultural capital were used. With regard to economic capital, since it was not possible able to use family income (information that young people often do not know), or the occupation of parents (information that the database does not provide), we worked with indirect measures, based on the existence of comfort goods in the students’ households (Buchmann; Dalton, 2002; Willms, 1992). We used these variables and others, such as early entry in the labor market and the size of the residence.
Bourdieu’s notion of cultural capital (2007) is rather polysemic and difficult to apply to quantitative research (Soares; Collares, 2006, p. 621). One of the main sociological studies that quantitatively operationalized the concept of cultural capital is Paul DiMaggio’s (1982). The author focused on the access to high-culture symbolic goods, such attending theaters, exhibitions and concerts. In Brazil, it seems more appropriate to assess this cultural dimension on the basis of aspects relevant to the acquisition of academic knowledge, such as reading habits and the education of parents (Soares; Collares, 2006). In other works, we operationalized the concept of cultural capital by measuring cultural resources or by measuring different categorical variables of family education level or the student’s cultural habits (Caprara, 2017, 2016, 2013).
We operationalized cultural capital here on the basis of two of its three dimensions: the capital institutionalized in the family and the capital incorporated by the student. The institutionalized cultural capital is measured by the high educational level of the students’ parents (complete college education). It is possible to think of this variable also as an incorporated cultural capital, as a kind of inheritance transmitted by the family to the students, considering that these, attending basic education, are in the process of primary institutionalization of their cultural capital, not yet possessing themselves school certifications. However, we chose to think of the parents’ high level of education as a cultural capital institutionalized in the family, as this family heritage may or may not be transmitted to the children. Incorporated cultural capital, on the other hand, is measured by the habit of reading books in general and literary books in particular, as part of the habitus acquired by the students.
Due to the large number of questions in Saeb, at first we grouped a set of variables to assess aspects of the objective dimension of the students’ class condition, schooling and faculty, in addition to demographic variables. Analyzes of these questions showed that, for the application of the chosen statistical techniques, the vast majority of the questions could be grouped into dichotomous categorical variables (such as 0 and 1), or should be transformed into binary (dummy) or ordinal categorical variables (1, 2, 3, etc.). In multivariate regressions, the dependent variables are proficiency in Portuguese language and proficiency in mathematics, measured in a scale ranging from zero to 500 points for each subject. Below we can see that both dependent variables have a normal distribution.
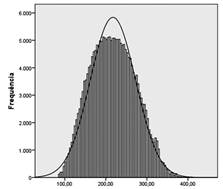
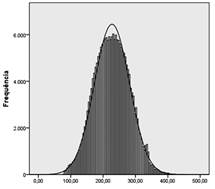
The standard deviation for both dependent variables was not very high, being much less than half the average (in Portuguese, mean of 217.38, standard deviation of 55.299 and median of 215.89; in mathematics, mean of 227, 53, standard deviation of 54.258 and median of 227.03).
Social Classes and Educational Performance in Brazil
Initially, it is interesting to look at a synthesis of the distribution of scores across different social classes. Among students from social classes with very low volume of capital (economic and cultural), 62.8% scored very low or low in Portuguese, and only 9.1% scored high. Among those from classes with high capital volume, 35.2% obtained very low or low math scores, while 29% scored high.
Table 1 shows the distribution of the volume of capital among students from different regions. In the Northeast region, only 7% of students have a high volume of capital. This region also has the highest rate of students possessing very low and low volume of economic and cultural capital - 30.2% and 43.8%, respectively. In short, 74% of students have a low volume of capital. In the South, on the contrary, we find the highest rate of students with a high volume of capital among all regions: 21.6%. The southern region also has the lowest number of students among the lower brackets of capital volume, with 7.1% in the very low bracket and 35.6% in the low bracket - totaling 42.7%.
Table 1: Cross Tabulation of Country Regions and Capital Volume
| Region | volume of economic and cultural capital | Total | ||||
| very low | low | medium | high | |||
| North | Number of students | 2921 | 5606 | 3475 | 1968 | 13970 |
| % in the region | 20.9% | 40.1% | 24.9% | 14.1% | 100.0% | |
| Northeast | Number of students | 13327 | 19280 | 8365 | 3085 | 44057 |
| % in the region | 30.2% | 43.8% | 19.0% | 7.0% | 100.0% | |
| Southeast | Number of students | 8827 | 29736 | 24198 | 12150 | 74911 |
| % in the region | 11.8% | 39.7% | 32.3% | 16.2% | 100.0% | |
| South | Number of students | 1925 | 9584 | 9612 | 5815 | 26936 |
| % in the region | 7.1% | 35.6% | 35.7% | 21.6% | 100.0% | |
| Center-West | Number of students | 1742 | 5850 | 4425 | 2382 | 14399 |
| % in the region | 12.1% | 40.6% | 30.7% | 16.5% | 100.0% | |
| Total | Number of students | 28742 | 70056 | 50075 | 25400 | 174273 |
| % in the region | 16,5% | 40.2% | 28.7% | 14.6% | 100.0% | |
Source: The Author / Saeb 2013.
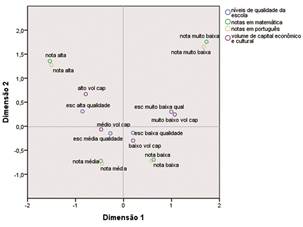
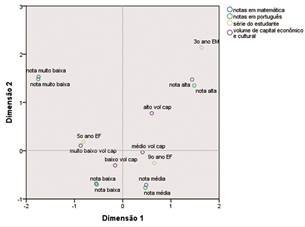
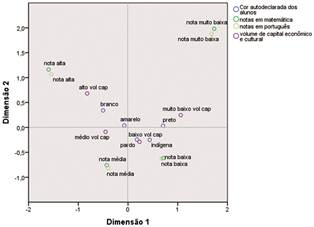
We should also examine the association between class and scores and the effects of economic and cultural capital on proficiency in mathematics and Portuguese. Figure 1 shows the multiple correspondence analysis of capital volume, school quality and scores in Saeb 2013, for cases from all over Brazil.
Source: The Author / Saeb 2013
Figure 1: Multiple Correspondence Analysis of Capital Volume, Scores in Portuguese and Mathematics and School Quality
Dimension 1 explained 47% of the variation in the data, while Dimension 2 explained 34.2%. The left quadrants (Dimension 1) evidenced the associations between high scores in mathematics and Portuguese language, high volume of capital and high quality of the school. On the other hand, in the right quadrants, we can observe the associations between very low scores in Portuguese and mathematics, very low volume of capital on the part of students and their families and schools of very low quality. Figure 1 also shows an opposition between these modal groups: on the one hand, high levels (of schooling, capital, scores) and, on the other, very low levels for the same categories.
The regression model that best explained the variation of the students’ scores found an adjusted R² of 0.36, indicating that 36% of the proficiency in Portuguese obtained by the evaluated students can be explained by the set of independent variables that make up the model. We did not find collinearity between the variables and the relationships were all statistically significant at the 99% level. Table 2 shows the ranking of effects of independent variables on educational performance in Portuguese language, considering the class condition of Brazilian students.
Table 2: Economic and cultural capital and performance in Portuguese throughout Brazil - Ranking of effects
| Variable | Effect |
| Students of the 3rd year of high school (ref. 5th grade of basic education) | 66.603 |
| Students of the 9th grade of elementary school (ref. 5th grade of basic education) | 43.628 |
| Federal school | 32.513 |
| Student that never repeated a year | 23.819 |
| Private school | 22.013 |
| Student with parents that encourage studying | 17.605 |
| Student who are a regular book reader | 10.253 |
| Student who has a computer at home | 9.685 |
| Female student | 9.195 |
| Student who have never quit school | 6.875 |
| Student in urban school | 6.679 |
| Student with a mother with complete college education | 5.649 |
| Student with 3 or more bathrooms at home | 4.661 |
| School with someone responsible for the library or reading room | 3.424 |
| School without signs of vandalism | 3.102 |
| Teacher uses projector in classes | 3.097 |
| School with a diversified book collection in the library | 2.877 |
| Student who are a regular literary book reader | 2.569 |
| Student whose family owns a car | 2.352 |
| Teacher who teaches ten or more years in the same school | 2.163 |
| Teacher with specialization | 2.114 |
| Teacher who uses internet in classes | 2.019 |
| Southeast region (ref. south) | 1.840 |
| Teacher graduated from a public university | 1.479 |
| Student who self-declared as brown | -1.889 |
| Teacher without complete college education | -2.734 |
| Student who self-declared as black | -9.014 |
| North region (ref. south) | -11.156 |
| Northeast region (ref. south) | -13.530 |
| Student who works outside the home | -15.062 |
Source: The Author / Saeb 2013.
Seven of the ten variables used to operationalize class condition stood out in this model. The class variable with the greatest impact was the one indicating whether the student works outside the home, besides studying; working students obtained, on average, 15.062 points less than those who do not work. This is an economic capital variable. And this is an important piece of information, since working outside the home during basic education studies probably reveal an economic need typical of poor families. The impact of this variable makes it clear that belonging to classes that need to dedicate part of their time to work and earn money, while also studying, negatively affects scores in Portuguese language.
Another economic capital aspect, owning a computer at home, which may seem commonplace in times of widespread adoption of information technologies, showed to have a strong impact, with students who have computers at home scoring, on average, 9.685 more points on Saeb 2013 in Portuguese. Students whose family owns a car tend to score, on average, 2.352 more points. The size of the student’s residence also matters. Students who have three or more bathrooms at home obtained, on average, 4.846 points more than those who have less than three bathrooms in their homes.
Cultural capital is the other objective class dimension. Students who are regular readers of books on general topics scored, on average, 10.253 more points than students who do not read books. Those who usually read literary books obtained, on average, 2.569 more points than those who do not read this type of book. Another class variable, capable of reflecting a more cultural aspect of social class, is the mother’s education level. Students who have mothers with complete college education scored, on average, 5.649 more points than those who do not have a mother with a college degree. These effects are shown in Graph 4.
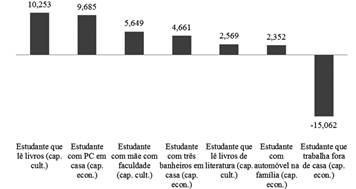
Source: The Author / Saeb 2013
Graph 4: Economic capital and cultural capital and performance in Portuguese language
Let us now examine the particularities of the effects of economic and cultural capital on performance in mathematics. Among the models found by stepwise regression, the one that was able to better explain the variations in math scores of the students evaluated by Saeb 2013 obtained an adjusted R² of 0.30. We can see that 30% of the variation in math proficiency can be explained by this model - with statistical significance at 99% and without collinearity between the variables. Table 3 presents information for the whole of Brazil. The list of impacts of the variables goes from the greatest positive effect to the greatest negative effect.
Table 3: Economic and cultural capital and performance in Mathematics in Brazil - ranking of effects
| Variable | Effect |
| Students of the 3rd year of high school (ref. 5th grade of basic education) | 59.274 |
| Federal School | 41.163 |
| Students of the 9th grade of elementary school (ref. 5th grade of basic education) | 31.591 |
| Private school | 25.547 |
| Student that never repeated a year | 23.935 |
| Student with parents that encourage studying | 16.519 |
| Student who have never quit school | 8.285 |
| Student who has a computer at home | 8.211 |
| Student who are a regular book reader | 6.726 |
| Student in urban school | 5.115 |
| Student with 3 or more bathrooms at home | 4.802 |
| Student with a mother with complete college education | 4.465 |
| Student whose family owns a car | 4.209 |
| School without signs of vandalism | 3.913 |
| School with someone responsible for the library or reading room | 3.577 |
| Teacher uses projector in classes | 3.511 |
| Teacher with specialization | 3.027 |
| Teacher uses internet in classes | 2.772 |
| Teacher have worked ten or more years in the same school | 2.715 |
| Student with 3 or more bedrooms at home | 2.670 |
| School with datashow available | 2.435 |
| Student with parents who attend school meetings | 2.327 |
| School with a diversified book collection in the library | 2.216 |
| Student who are a regular literary book reader | 2.163 |
| Southeast region (ref. south) | 1.988 |
| Teacher graduated from a public university | 1.320 |
| Teacher without complete college education | -3.019 |
| Center-West region (ref. south) | -3.143 |
| Female student | -7.894 |
| Student who self-declared as black | -8.622 |
| Student who works outside the home | -11.589 |
| North region (ref. south) | -15.702 |
| Northeast region (ref. south) | -16.067 |
Source: The Author / Saeb 2013.
Of the ten variables that indicate possession of capital - five of economic capital and five of cultural capital - eight were found to have important effects in multiple linear regressions: three of cultural capital and five of economic capital. The social class variable that stood out concerns students who work outside the home, besides studying. This is an economic capital variable. These students scored, on average, 11.589 less points than students who do not work, but only study. Close behind, we found that owning a computer at home is an important element. Students who have a computer at home obtained, on average, 8.211 more points than those who do not have this consumer good. Students whose families own a car tend to score, on average, 4.209 more points. The influence of social class on performance in mathematics, in economic terms, is also evidenced by the variables that indicate the students’ housing conditions. Students living in a home with three or more bathrooms tend to obtain, on average, 4.802 more points. Students living in a home with three bedrooms or more tend to score, on average, 2.670 more points.
Let us continue the examination of the influence of class on educational achievement. The mother’s education also stands out with regard to class cultural aspects. If the mother has a complete college education, students scored, on average, 4.465 more points. But the most relevant effect found is that of the variable that indicates reading habits. Students who are regular book readers tend to obtain, on average, 6.726 more points. On the other hand, students who usually read literary books obtain, on average, 2.163 more points. This allows us to observe the impact of social class in different dimensions, indicating that a larger home, the possession of a personal computer, a family with a higher education level and the habit of reading books have a direct, positive impact on the performance in mathematics in Brazilian basic education. Graph 5 shows all the effects of the economic and cultural capital variables on proficiency in mathematics.
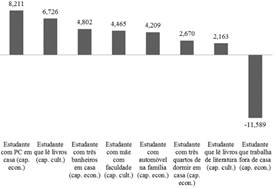
Source: The Author / Saeb 2013
Graph 5: Economic capital and cultural capital and performance in Mathematics
The variable that indicates working students deserves a closer look. So far, we have been treating this variable as an indicator of economic capital, considering that the need for early entry in the labor market tends to be related to the need for supplementing the family income in some degree. However, if we think about it, this is a variable that can establish a boundary between economic capital and cultural capital, as students who do not work have more free time, which thus can be spent in various activities, including cultural activities. Souza (2015) addresses this issue, tangentially, arguing that the reproduction of class inequalities involves the fact that classes possessing medium and high volumes of capital can hire low-skilled workers to perform domestic tasks, such as cleaning and maintenance, freeing up time to invest in strategies to increase capital volume. A daily life with more free time, in which students do not need to work to help their families, can reveal a connection between the possession of economic capital and the increase in cultural capital.
Among the variables of most impact on performance in Portuguese and mathematics, there are some that indicate elements apparently unrelated to social class. Their main effects are found in variables of individual life stories, in the school system, in the urban or rural location of the school, in the involvement of families that encourage the engagement in studies, in rates of school abandonment and failure and in the students’ skin color. So far, we have treated these relationships as diverse indicators, unrelated to the class condition of students and their families. It turns out that we can raise some valuable questions: who are the students who drop out of school, fail or study in rural schools, for example? How are they distributed across classes with different volumes of economic and cultural capital in Brazilian schools? What is their skin color? Do high scores, school system and encouragement to study from the family might have any association with differences in access to the two fundamental forms of capital?
Let us start by describing how students are distributed according to their volume of capital and the school system they attend. Among private school students, 52% possess a high volume of economic and cultural capital; while among public school students, only 13.5% possess a high volume of cultural capital. It seems that families with higher volumes of capital tend to invest in a private education, which may indicate that cultural capital is being institutionalized by students. This may also be linked to the assumption that private schools are better than public schools, which makes sense when they are compared with the state and municipal public systems, but not when compared with the federal system. Among private schools (2.7% of the sample), 65.2% present a high quality level. In the state and municipal systems (42.7% and 54.3% of the sample), we found 15.2% and 10.9% of schools with a high quality level. Among federal schools, 77.3% have a high quality level. In the federal system, 70.9% of students obtained high scores in Portuguese; in the private system, they were 50.4%.
Given this scenario, we performed a multiple correspondence analysis between school system, volume of capital possessed by students and their families and the scores in Portuguese and mathematics.
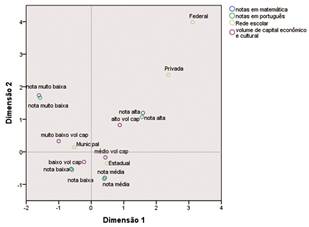
Source: The Author / Saeb 2013
Figure 2: Multiple Correspondence Analysis between School System, Capital Volume and Scores in Portuguese and Mathematics
Dimension 1, which explained 48.3% of the data variation (Dimension 2 explained 35.3%), shows the existence of an association between private and federal systems and the high volume of capital possessed by students and their families, in addition to the proximity to high scores. Figure 2 also shows an opposition between these systems and the very low scores on that axis. However, this set of variables related to the volume of capital also provides a measure of economic capital, so it is necessary to verify these associations with the use of a specific variable for cultural capital. In this sense, we adopted as a proxy the categorical variables of education of the mother and father, in order to observe whether there is an association between high education levels and attending public or private schools. Figure 3 shows the multiple correspondence analysis between parent’s educational level, school system and scores of Saeb 2013 participants.
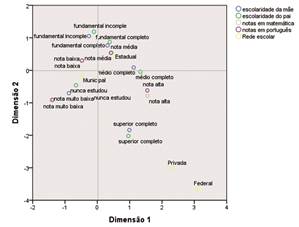
Source: The Author / Saeb 2013
Figure 3: Multiple correspondence analysis between mother’s educational level, school network and scores in Portuguese and Mathematics
The right quadrants (Dimension 1, which explained 43.6% of the variation) clearly show the association between students from federal and private schools and a high educational level of parents, as well as with high scores in both evaluated subjects. In Dimension 2, which explained 30.7% of the variation, we can observe the opposition between low educational level of parents (incomplete and even complete basic education), private and federal systems and high scores.
The associations found between the school system and the volume of capital/educational level of the family may indicate that studying in federal and private schools means that students are in the process of initial institutionalization of their specific cultural capital, in terms of school qualification. If this is correct, if attending a federal or private school is an indicator of this process of partial institutionalization of cultural capital by young Brazilians, our empirical results expand its scope, showing an even greater effect of the social class of students on their school performance. School level transitions also impacted Saeb scores, with students in the 9th year of basic education and in the 3rd year of high school achieving better results than those in the 5th year of basic education. Is there a possible relationship between advancing in school levels and the class condition of the agents? It is worth observing the distribution of students in terms of capital volume across the three school years analyzed. Among students in the 5th year of basic education, 61.5% are located in the low capital brackets (19.9% very low and 41.6% low). Only 13.1% of the youngest students evaluated by Saeb 2013 possess a high volume of economic and cultural capital. At the end of basic education (9th grade), this scenario changes a little, but the disparity remains: 13.8% have very low volume and 39.4% have low volume of capital, totaling 53.2% of students. Only 15.3% possess a high volume of capital.
In the 3rd year of high school, in which are the students who have already overcome all the system’s barriers, we observe some important differences: only 8.6% have a very low level of access to economic and cultural capital. Adding this value to the 30.9% that possess a low volume of capital, we find 39.5% of students pertaining to the most vulnerable classes - a figure much lower than in other years. Students finishing high school also have the highest rate of access to economic and cultural capital, reaching 27.9% of them. There is a great difference between the beginning of schooling and its last stage, with regard to differences in the distribution of capital among students and their families. Figure 5 shows the multiple correspondence analysis between years, volume of capital and scores in mathematics and Portuguese, visually revealing the relations of distance and proximity between the modalities.
Source: The Author / Saeb 2013
Figure 4: Multiple Correspondence Analysis between School Year, Capital Volume and Scores in Portuguese and Mathematics
Dimension 1 explained 50.8% of the variance and demonstrated the association between being in the 3rd year of high school, having a high volume of capital and obtaining high scores. It also showed the opposition of these characteristics with very low scores and the 5th year of basic education, as well as with very low access to capital. This opposition is also evidenced by Dimension 2, which explains 34.8% of the variation in the data. The effect of school level transitions on the dynamics of internal struggles in schools seems to have some relation with the class condition of the students.
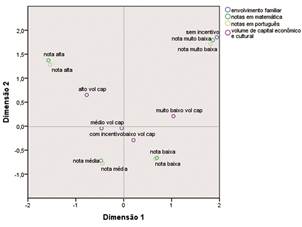
The involvement of the family in the students’ school life can be examined in view of the differences in access to economic and cultural capital. The effect of having parents or guardians who encourage students to study was clearly visible in the scores obtained in Portuguese and mathematics. Among students who do not receive this encouragement (only 2.4% of the sample), we find 27.8% of students with very low volume of capital and 41.8% with low volume, reaching 69.6% of students. This number is even more relevant if contrasted with the small group that has a high volume of capital and has no family encouragement to study (11.8%). Figure 5 shows the results of the multiple correspondence analysis between family encouragement, volume of capital and students’ scores.
Source: The Author / Saeb 2013
Figure 5: Multiple Correspondence Analysis between Family Involvement, Capital Volume and Scores in Portuguese and Mathematics
Dimension 1 explained 44.5% of the variation in the data, while Dimension 2 explained 34.1%. Dimension 1 shows the associations of very low scores with the lack of family encouragement to study, as well as with the possession of very low volume of capital. In this axis, there is an opposition between these characteristics and high scores and high volume of economic and cultural capital. The non-involvement of the family in school life seems to be a more localized phenomenon affecting mainly students from the most vulnerable classes.
Two other important effects are related to dropping out of school and repetition of the school year (failure). Students who have already dropped out of school and/or have failed at least once tend to obtain worse scores than those who never did. We treat these variables as indicators of individual life stories, but we suspect that they may be linked to the students’ social class. To address this issue, starting with students who drop out of school, we ran a contingency table between the students’ volume of capital and dropping out of the school, to check how many students have already dropped out of school in the different levels of economic and cultural capital volume. Among students who have already dropped out (31% of the sample), 22.8% have a very low volume of capital and 42% have a low volume. Together, these categories represent 64.8% of the students who have already dropped out of school. It represents a very significant share of students with low and very low access to forms of capital that are essential to living in modern societies. Only 12.2% of the students who dropped out possess a high volume of economic and cultural capital.
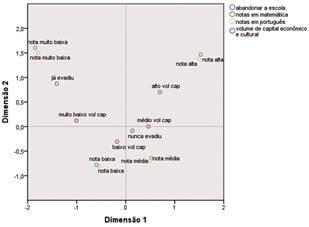
With this evidence, we performed a multiple correspondence analysis between scores in Portuguese and mathematics, volume of capital and dropping out of school. We looked into the relations of proximity and distances between the characteristics to verify whether dropping out of school can indicate class belonging to some extent. Figure 6 presents a visualization of these categories.
Source: The Author / Saeb 2013
Figure 6: Multiple Correspondence Analysis between Dropping Out of School, Capital Volume and Scores in Portuguese and Mathematics
Dimension 1 and Dimension 2 explained 45.7% and 34.5% of the data variation, respectively. Dimension 1 reveals the association between very low scores in mathematics and Portuguese, a history of dropping out of school and very low volume of capital. On the other hand, we can observe the association between high scores and high volume of capital. This also shows an opposition between these groups of characteristics. Dimension 2 reveals an opposition of low scores and high scores and high volume of capital. The proximity of dropping out of school to a very low volume of economic and cultural capital, together with the distance to the high volume of capital category, may signal that the episode of disruption of school attendance is more associated with classes that have reduced access to the most important forms of capital in modern societies, and that this phenomenon affects less the wealthy classes.
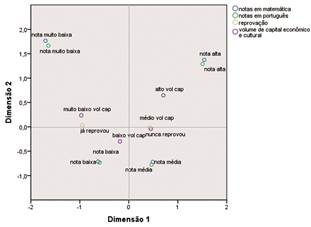
We carried out the same operations for the relationship between failing a school year and volume of capital. Among the students who have already failed a year (48.5% of the sample), 22.1% have a very low volume of capital and 42.8% have a low volume of capital. Only 11.1% of students who have already failed a year possess a high volume of capital. Figure 7 maps these categories.
Source: The Author / Saeb 2013
Figure 7: Multiple Correspondence Analysis between Failing a School Year, Capital Volume and Scores in Portuguese and Mathematics
Dimension 1 explained 48.2% of the data variance, while Dimension 2 explained 34.1%. Dimension 1 shows that very low scores are associated with very low volume of capital and with the existence of at least one episode of the student failing a school year. There is also an association between high scores and high volume of capital, in addition to an opposition between these categories and possessing a very low volume of capital, obtaining very low scores and having already failed a school year.
Finally, we analyzed the relationship between social class and the skin color of the students. Figure 8 shows the results of a multiple correspondence analysis between self-declared skin color, the scores in the two disciplines evaluated by Saeb 2013 and the volume of economic and cultural capital.
Source: The Author / Saeb 2013
Figure 8: Multiple Correspondence Analysis between Self-Declared Skin Color, Capital Volume and Scores in Portuguese and Mathematics
Dimension 1, which explained 45.3% of the variation in the data, shows an association between high scores, high volume of capital and self-declared white skin. We can observe, in the right quadrants, an association between very low scores, very low volume of capital and self-declared black skin. The distances between these associated characteristics reveal an opposition between them, which may signal a link of skin color with social class and with educational achievement. Dimension 2 explains 34.3% of the variance, and shows a similar opposition between high volume of capital, high scores and self-declared white skin and low scores.
Among white students (34.1% of the sample), 10.9% have a very low volume of capital and 35.8% have a low volume - totaling 46.7%. Almost half of white students are among those with very low or low volume of economic and cultural capital. Whites with a high volume of capital are 20.6% of self-declared white students. On the other hand, among self-declared black students (11.3% of the sample), 19.1% and 40.0% possess very low and low volume of capital, respectively. Altogether, self-declared black students that have low or very low access to economic and cultural capital reach 59.1%. Black students who are in the high volume of capital bracket are only 11.2%. Data for brown students (48.7% of the sample) are similar to data for black students, as well as the data for indigenous students (2.7% of the sample).
Final Considerations
In this paper, we show that, in Brazil, social class appears almost always related to student performance in mathematics and Portuguese. Living in a large residence, having the habit of reading and parents with a high level of education are conditions that influence the students’ school proficiency. This demonstrates that circumstances external to the school are still very important to the life stories of students competing in the school system as a whole.
By examining the influence of social class on Brazilian students’ scores, as assessed by Saeb 2013, we show that the objective class dimension affects students’ achievements in basic education, revealing the relevance of this theme for current academic debates and educational policies. Showing the relationship between social classes and school performance does not mean that the educational problems are caused exclusively by poverty or the lack of resources on the part of students and their families, but it call attention to the fact that schooling alone has not yet been able nor is currently able to avoid reproducing social inequalities.
Studies on class inequalities and their relationship with formal education can and should continue to address the social conditions that generate and transmit the fundamental dispositions for an efficient incorporation of the logic of educational establishments. Investigating these issues requires carrying out a qualitative research agenda aimed at understanding the processes of subjectivity/morality that form the agents in our society and how these agents deal with the interactions inherent in the school environment.
REFERENCES
ALTHUSSER, Louis. Ideologia e Aparelhos Ideológicos do Estado: notas para uma investigação. Lisboa: Editorial Presença, 1980. [ Links ]
BARBOSA, Maria Ligia de Oliveira. Desigualdade e Desempenho: uma introdução à sociologia da escola brasileira. Belo Horizonte: Argumentum, 2009. [ Links ]
BAUDELOT, Christian; ESTABLET, Roger. La Escuela Capitalista en Francia. México: Siglo Veintiuno, 1975. [ Links ]
BERTONCELO, Edison. Classes e práticas sociais. Revista Brasileira de Ciências Sociais, São Paulo, v. 28, n. 81, 2013. Disponível em: <Disponível em: http://www.scielo.br/scielo.php?script=sci_arttext&pid=S0102-69092013000100012&lng=en&nrm=iso&tlng=pt .>. Acesso em: 02 abr. 2019. [ Links ]
BERTONCELO, Edison. O Espaço das Classes Sociais no Brasil. Tempo Social, USP, v. 28, n. 2, 2016a. Disponível em: <Disponível em: http://www.scielo.br/scielo.php?script=sci_arttext&pid=S0103-20702016000200073&lng=en&nrm=iso&tlng=pt >. Acesso em: 02 abr. 2019. [ Links ]
BERTONCELO, Edison. O Uso da Análise de Correspondências Múltiplas nas Ciências Sociais: possibilidades de aplicação e exemplos empíricos. In: ENCONTRO ANUAL DA ANPOCS, 40., 2016b, Caxambu. Anais... Caxambu, 2016b. Disponível em: <Disponível em: https://192.190.81.132/index.php/encontros/papers/40-encontro-anual-da-anpocs/st-10/st16-7/10296-o-uso-da-analise-de-correspondencias-multiplas-nas-ciencias-sociais-possibilidades-de-aplicacao-e-exemplos-empiricos >. Acesso em: 02 abr. 2019. [ Links ]
BOURDIEU, Pierre. Razões Práticas: sobre a teoria da ação. Campinas: Papirus, 1996. [ Links ]
BOURDIEU, Pierre. Escritos de Educação. Petrópolis: Vozes, 2007. [ Links ]
BOURDIEU, Pierre. A Distinção: crítica social do julgamento. Porto Alegre: Zouk, 2008. [ Links ]
BOURDIEU, Pierre. Capital Simbólico e Classes Sociais. Novos Estudos CEBRAP, n. 96, São Paulo, 2013. Disponível em: <Disponível em: http://www.scielo.br/scielo.php?script=sci_arttext&pid=S0101-33002013000200008 >. Acesso em: 03 abr. 2019. [ Links ]
BOWLES, Samuel; GINTIS, Herbert. Schooling in Capitalist America: educational reform and the contradictions of economic life. Nova Iorque: Basic Books, 1974. [ Links ]
BUCHMANN, Claudia; DALTON, Ben. Interpersonal Influences and Educational Aspirations in 12 Countries: the importance of institutional context. Sociology of Education, v. 75, n. 2, p. 99-122, 2002. Disponível em: <Disponível em: https://www.jstor.org/stable/pdf/3090287.pdf >. Acesso em: 03 abr. 2019. [ Links ]
CAPRARA, Bernardo. A Influência do Capital Cultural no Desempenho Estudantil: reflexões a partir do Saeb 2003. 2013. 157f. Dissertação (Mestrado em Sociologia) - Programa de Pós-Graduação em Sociologia, Universidade Federal do Rio Grande do Sul (UFRGS), Porto Alegre, 2013. Disponível em: <Disponível em: http://hdl.handle.net/10183/78192 >. Acesso em: 02 abr. 2019. [ Links ]
CAPRARA, Bernardo. The Impact of Cultural Capital on Secondary Student’s Performance in Brazil. Universal Journal of Educational Research, v. 4, n. 11, p. 2627-2635, 2016. Disponível em: <Disponível em: http://www.hrpub.org/journals/article_info.php?aid=5261 >. Acesso em: 03 abr. 2019. [ Links ]
CAPRARA, Bernardo. Classes Sociais e Desempenho Educacional no Brasil. 2017. 258f. Tese (Doutorado em Sociologia) - Programa de Pós-Graduação em Sociologia, Universidade Federal do Rio Grande do Sul (UFRGS), Porto Alegre, 2017. Disponível em: <Disponível em: https://www.lume.ufrgs.br/handle/10183/172397 >. Acesso em: 02 abr. 2019. [ Links ]
CHARLOT, Bernard. Da Relação com o Saber: elementos para uma teoria. Porto Alegre: Artes Médicas Sul, 2000. [ Links ]
COSTA RIBEIRO, Carlos Antonio. Desigualdade de Oportunidades e Resultados Educacionais no Brasil. Dados, v. 54, n. 1, Rio de Janeiro, 2011. Disponível em: <Disponível em: https://www.scielo.br/scielo.php?script=sci_arttext&pid=S0011-52582011000100002 >. Acesso em: 02 abr. 2019. [ Links ]
COSTA RIBEIRO, Carlos Antonio. Mobilidade e Estrutura de Classes no Brasil Contemporâneo. Sociologias, Porto Alegre, ano 16, n. 37, p. 178-217, set./dez. 2014. Disponível em: <Disponível em: https://www.scielo.br/scielo.php?pid=S1517-45222014000300178&script=sci_abstract&tlng=pt >. Acesso em: 02 abr. 2019. [ Links ]
CYRINO, Carolina Dutra. Análise Geométrica de Dados Através da Análise de Correspondência Múltipla. 2011. 45f. Monografia para o Curso de Estatística da Universidadae Federal de Juiz de Fora, Juiz de Fora, 2011. Disponível em: <Disponível em: http://www.ufjf.br/cursoestatistica/files/2011/11/Monografia-carolina.pdf >. Acesso em: 02 abr. 2019. [ Links ]
DiMAGGIO, Paul. Cultural Capital and School Success - the impact of status culture participation on the grades of united-states high-school-students. American Sociological Review, v. 47, n. 2, p. 189-201, 1982. Disponível em: <Disponível em: http://www.jstor.org/stable/2094962?seq=1#page_scan_tab_contents >. Acesso em: 02 abr. 2019. [ Links ]
DOURADO, Luiz Fernandes. A Qualidade da Educação: conceitos e definições. Brasília: INEP, 2007. [ Links ]
DUNCAN, Greg; MURNANE, Richard. Whitter Opportunity? Rising Inequality, Schools, and Children’s Life Chances. New York: Russel Sage Foundation, 2011. [ Links ]
GREENACRE, Michael; BLASIUS, Jörg (Org.). Correspondence Analysis in the Social Sciences. San Diego: Academic Press, 1994. [ Links ]
PIKETTY, Thomas. O capital no século XXI. Rio de Janeiro: Intrínseca, 2014. [ Links ]
RAMOS, Marília Patta. Pesquisa social: abordagem quantitativa com uso do SPSS. Porto Alegre: Ed. Escritos, 2014. [ Links ]
SCALON, Celi; SALATA, André. Desigualdades, Estratificação e Justiça Social. Civitas, Porto Alegre, v. 16, n. 2, 2016. Disponível em: <Disponível em: http://revistaseletronicas.pucrs.br/ojs/index.php/civitas/article/view/24479 >. Acesso em: 02 abr. 2019. [ Links ]
SOARES, José; COLLARES, Ana. Recursos Familiares e o Desempenho Cognitivo dos Alunos do Ensino Básico Brasileiro. Dados - Revista de Ciências Sociais, Rio de Janeiro, v. 49, n. 3, p. 615-650, 2006. Disponível em: <Disponível em: http://www.scielo.br/scielo.php?script=sci_arttext&pid=S0011-52582006000300007 >. Acesso em: 02 abr. 2019. [ Links ]
SOUZA, Jessé. A Tolice da Inteligência Brasileira: ou como o país se deixa manipular pela elite. São Paulo: Leya, 2015. [ Links ]
WACQUANT, Löic. Esclarecer o habitus. Educação e Linguagem, v. 10, n. 16, p. 63-71, jul./dez. 2007. [ Links ]
WILLMS, Jon Douglas. Monitoring School Performance: a guide for educators. Washington: Falmer, 1992. [ Links ]
1The modified database used in this article is available at: <https://drive.google.com/file/d/0B7BXzpD4c9hqaVRUVEJEeDJjWmM/view?usp=sharing>.
Received: May 18, 2019; Accepted: July 27, 2020
 Este é um artigo publicado em acesso aberto sob uma licença Creative Commons
