


Serviços Personalizados
Journal

Artigo
 texto em
  Inglês (pdf)
 Artigo em XML
 Enviar este artigo por email
Compartilhar

 Permalink
Educação em Revista
versão impressa ISSN 0102-4698versão On-line ISSN 1982-6621
Educ. Rev. vol.34 Belo Horizonte 2018 Epub 20-Set-2018
https://doi.org/10.1590/0102-4698192454
Article
DIMENSIONING INEQUALITIES BY SEX AND COLOR: RACE IN BRAZILIAN POST-GRADUATION

1Carlos Chagas Foundation, São Paulo, SP, Brasil.
The use of indicators to measure social inequalities has been disseminated more intensely in the last few decades through social science research. Bringing these instruments to analyze the changes that have occurred in women and black people’s participation in undergraduate and graduate education is extremely important in light of the implementation of affirmative action policies that aimed to provide poorly represented social groups with broader access to college education, particularly blacks and indigenous people in Brazil. This study presents the indexes of gender and racial parity as instruments to help characterize who had access to and attended undergraduate and graduate school between 2000 and 2010. The results showed that access is differentiated both by gender and race, with some of the worst indicators for blacks.
Keywords: Inequalities; Indicators; Gender: color/race
O uso de indicadores para dimensionar desigualdades sociais tem se disseminado de forma mais intensa nas últimas décadas em estudos da área das ciências humanas. Trazer esse instrumental para a análise das mudanças ocorridas na participação de mulheres e negros nos cursos de graduação e pós-graduação, tem considerável importância em face da implementação de políticas de ação afirmativa que objetivaram a ampliação do acesso ao ensino superior de grupos sociais sub-representados, em especial os negros e indígenas. Este estudo apresenta os índices de Paridade de Gênero (IPG) e Paridade Racial (IPR) como instrumentos auxiliares na caracterização do público que acessou e frequentou a graduação e pós-graduação no período 2000-2010, a partir das informações fornecidas pelos Censos Demográficos de 2000 e 2010. Observa-se, nos resultados obtidos, que o acesso é tanto diferenciado por sexo como por cor/raça, com piores indicadores para os negros.
Palavras Chave: Desigualdades; Indicadores; Gênero: cor/raça
SOCIAL INDICATORS AND MONITORING MEASURES
The construction of numerical indicators to monitor social policies began in the 1960s in the United States, within the context of a Welfare State crisis, where theoretical and empirical studies associating quality of life and governmental planning were necessary. International organizations such as the United Nations (UN) and the Organization for Economic Co-operation and Development (OECD), among others, developed and replicated a set of social indicators to operationalize the measurement of well-being between 1970 and 1980. The infant mortality rate (IMR), the human development index (HDI), and the human freedom index (HFI) (SOLIGO, 2012; SANTAGADA, 1993) are examples of such indicators.
In Brazil, the Brazilian Institute of Geography and Statistics (IBGE) was responsible for developing social indicators, which were constructed beginning in the late 1970s. According to Santagada (1993, p. 250), the II National Development Plan in Brazil (PND) 1975-1979, “recognized the aggravation of social problems and proposed a policy of social and economic inequalities reduction.” Thus, the indicators were created to measure and monitor public policies under development.
The objective of constructing social indicators is to measure the levels of material well-being of “vulnerable” groups, which assists in proposing public policies. According to Jannuzzi (2005, p. 138), “indicators point to, indicate, approximate, translate in operational terms the social dimensions of interest defined from theoretical choices or previous policies.”
In the 1980s and 1990s, the worldwide trend was followed by Brazil with the development of different indicators by government agencies—such as the Municipal Indicator of Social Development (IMDE), prepared by the Anísio Teixeira National Institute of Educational Studies and Research (INEP), and the Quality of Urban Life Index (IQVU), created by the Belo Horizonte City Hall—as well as non-governmental organizations—such as the Municipal Human Development Index (IDH-M), conceived by the João Pinheiro Foundation, and the Youth Vulnerability Index (IVJ), created by the SEADE Foundation.
Indicators have been widely used in the field of education. An example of this is the creation of world reports of educational policies monitored by the United Nations for Education, Science and Culture (UNESCO). The federal government developed the Basic Education Development Index (IDEB)1 at the national level in 2007, which has been used to establish and assess compliance with performance targets for basic education in schools throughout the country.
The indicators presented in this study have as their main objective to provide visibility to two social markers: gender and color/race for a specific group of the Brazilian population, namely, undergraduate degree holders, graduate students, and graduate degree holders. The social indicators described here are simple when compared to others. The aim is to describe the observable difference between the variables (access to and completion of higher education levels) by comparing the results between women and men, and blacks and whites. Despite presenting information on other levels of education, the focus of this study is graduate school.
INDEXES IN EDUCATION: THE MARKS OF INEQUALITIES5
The issue of inequalities in the access to education according to gender and color/race has been addressed by several authors (ARTES and CARVALHO, 2010; CARVALHO, 2009; ROSEMBERG, 2002). It is important to emphasize that discussing access to or the completion of education levels in terms of gender and race should not be limited to quantifying the differences observed between the groups. It is also necessary to include the issue of power present in social relations that hierarchize men and women, and whites and blacks. Another relevant issue beyond the scope of the study is handling racism, sexism, and/or racial/sexual discrimination experienced by blacks and women in different social spaces, including academia.
Particularly for blacks, it is also important to consider affirmative action policies,2 which were consolidated over the last 10 years and adopted by governments (both federal and state) and private educational institutions in Brazil—the latter, as service providers—to focus on reducing the social differences between whites, blacks, and indigenous people. These policy measures were the result of social pressures that began in the 1990s, which have been strengthened by specific legislation (Racial Equality Statute, Law no. 12.288/10 and Quota Law, Law no. 12.711/12; Estatuto da Igualdade Racial, Lei n. 12.288/10 e Lei de Cotas, Lei n. 12.711/12).
In private institutions, the University for All Program (Prouni) and the Student Financing Fund (Fies)3 favor these “historically minority” groups in their admission process to assist in access to higher education.
Despite the increased participation of blacks in higher education, issues involving racism/discrimination are still present and should become visible. Therefore, two paths can be followed: discussions on cultural diversity in different spaces in Brazil (MUNANGA, 2004; GOMES, 2011; SILVERIO, 2003), or numerical discussions on inequalities in the access to, permanence of, and completion of higher education (BELTRÃO and TEIXEIRA, 2004; PAIXÃO, 2010;). This study follows the second path.
Quantifying and identifying the existing differences between the groups is a first step in understanding the reality, which can then be followed up by proposed policies to change the inequalities observed.
According to Soligo (2012), two characteristics are fundamental in building a social indicator: “The first is to choose which aspect of reality will be treated. The second is to define which abstract concept will be used to explain the phenomenon studied.” (page 17). These two aspects are present in the indicators used in this study.
In the Brazilian literature, the difference between men and women is quantified based on two indicators: the gender parity4 index (GPI) and the sex ratio. The GPI is used by UNESCO in its global monitoring reports “Education for All” (EFA) to assess compliance with the targets established in Dakar in 2000. It quantitatively represents the ratio of women to men for a chosen variable (presence in the labor market, leadership positions, education or schooling rate, etc.). A GPI with a value of 1 indicates gender parity; a GPI between 0 and 1 means a disparity in favor of men; and a GPI greater than 1 indicates a disparity in favor of women (UNESCO, 2004, p. 386). Values between 0.95 and 1.05 are accepted as the confidence interval. Therefore, any indicator below 0.95 represents inequality towards women, and any indicator above 1.05 represents an advantage towards women.
A set of information ranked by GPI is presented in the last EFA report (UNESCO, 2015). The report discusses the improvement of basic education, with special attention to children’s access to and completion of the first years of education, in addition to the actions developed by the international organization. However, some data on higher education are provided. Table 1 shows the GPI determined by the ratio between the gross female and male rates of schooling in higher education for a selected set of countries.
TABLE 1 Gender Parity Index (GPI) for the Gross Enrollment Rate in Higher Education for 1999 and 2005.
| Country | GPI obtained from the Gross Enrollment Ratio in Higher Education (GER)5 | |
|---|---|---|
| 1999 | 2005 | |
| Angola | 0,63 | 0,66 |
| Argentina | 1,63 | 1,41 |
| Australia | 1,22 | 1,25 |
| Brazil | 1,26 | 1,32 |
| Chile | 0,91 | 0,96 |
| Spain | 1,18 | 1,22 |
| United States | 1,31 | 1,40 |
| Japan | 0,85 | 0,89 |
| Norway | 1,40 | 1,54 |
| Turkey | 0,68 | 0,74 |
Source: UNESCO (2015, p. 346-350). Table published in Artes (2015, p. 23).
To better understand the table, consider that, for Brazil, for every 100 men enrolled in higher education, there were 126 women in 1999 and 132 in 2005. The values indicate that for the different countries shown, women prevail in higher education in both 1999 and 2005, with a GPI above 1. There are exceptions such as Angola, Japan, and Turkey, but even those countries trend towards parity. For the six-year period, Argentina was the only country in the Table in which the trend in women’s participation decreased, from 1.63 to 1.41.
The sex ratio used by Beltrão and Teixeira (2004) and others has the same numerical ratio principle but is the inverse of GPI (male/female). In this study, GPI was used because the objective of the indicator is to provide a difference—in this case between women and men—and therefore the closer the parity value (i.e., 1), the better the condition described is for women. The difference between the value found and 1 is what needs to be improved to reach the desired parity between genders; with indicators above 1, the inequality becomes unfavorable for men.
Men are observed to have the worst indicators for education, unlike GPIs constructed for other social spaces, such as the labor market, political participation, etc. The analysis of GPIs by education shows relevant differences associated with different professional occupations for men and women (RICOLDI and ARTES, 2015; BELTRÃO and TEIXEIRA, 2004).
The Racial Parity Index (RPI) is mirrored in the GPI but replaces the variable of gender with the variable of color/race—a numerical indicator for blacks in proportion to whites. Rosemberg (2006) presents the Black Index using the same principle. No international references were found for indicators that measured differences by color/race or ethnicity. Beltrão and Teixeira (2004) present the standardized ratio of color/race groups for any of the color/race options described in the database (white, black, “pardo,” yellow, and indigenous people). The differences between whites and blacks in the educational variable for the selected education levels are specified to provide information about the participation of blacks in higher education and in Brazilian graduate school, in a context of discussion and implementation of differentiating policies (i.e., affirmative actions) for the access to undergraduate and, more recently, graduate education. Other studies organize their information by polarizing the groups into white and non-white (ANDRADE and DACHS, 2007; MAGALHÃES, 2009; Observatório da Metrópole 13, 2013),6 or black and non-black (DIEESE, 1999; SANTOS, 2005; SEADE, 2012).
The calculations used to produce the RPI indicator is represented by the follow equations:
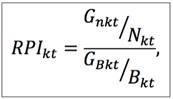
In which RPI kt : the value of the RPI calculated for age group k and year t (2000 and 2010);
N kt : number of blacks in the age group k and year t;
B kt : number of whites in the age group k and year t;
G Nkt : number of black graduates in the age group k and year t and
G Bkt : number of white graduates in the age group k and year t.
The values can be adjusted for undergraduates (people attending undergraduate courses), graduates (people attending post-graduate courses) and so on, for each of the indicators constructed. The same equation is used to calculate the GPI for the different conditions (undergraduates, undergraduate degree holders, graduates, and graduate degree holders), replacing gender with the variable color/race.
Most of the quantitative research studies work with self-qualification options, such as blacks and “pardos” (see IBGE publications). The use of the term “blacks” is intended to counteract the analyses for the group of whites. Several studies present the black category as a social context, as described by Guimarães (2002). In this study, the category “blacks” includes blacks and pardos.
Initially, it is fundamental to analyze the population characterization by color/race in the two censuses used to provide a representative differentiation in composition. From this framework, the interest groups should be analyzed (i.e., undergraduates, undergraduate degree holders, graduates, or graduate degree holders).
TABLE 2 Percentage distribution by color/race of the general population, and of undergraduate and graduate students. Brazil, 2000 and 2010.
| Color/race | OverallPopulation | Undergraduates | Graduates | |||
|---|---|---|---|---|---|---|
| 2000 | 2010 | 2000 | 2010 | 2000 | 2010 | |
| Whites | 53,7 | 47,5 | 78,5 | 63,0 | 84,3 | 73,2 |
| Blacks | 44,7 | 50,9 | 19,5 | 35,3 | 13,3 | 24,9 |
| Blacks | 6,2 | 7,5 | 2,4 | 5,3 | 2,3 | 4,3 |
| Pardos | 38,5 | 43,4 | 17,2 | 30,0 | 10,9 | 20,6 |
Source: Demographic Census, 2000 and 2010 (Microdata) (accessed via BME).
Table 2 shows a reduced participation of whites from 2000 to 2010, in the general population and in the group that attended undergraduate and graduate courses. Whites accounted for 53.7% of the Brazilian population in 2000 and 47.5% in 2010. Blacks represented 44.7% of the population in 2000 (6.2% blacks and 38.5% pardos) and 50.9% (with 7.5% blacks and 43.4% pardos) in 2010.
The participation of blacks in undergraduate education increased remarkably. In the year 2000, they represented 19.5% of the country’s undergraduates, while in 2010, they represented 35.0%. On the other hand, whites had a much higher level of participation in higher education than blacks. However, from 2000-2010, their participation declined from 78.5% to 63.0%.
The change in participation rates of blacks in Brazilian graduate education from 2000 to 2010 is also perceptible. The percentage of blacks in this contingent increased from 13.3% to 24.9%. As in the previous comparison, whites had much higher participation in graduate education than blacks, but their participation dropped from 84.3% to 73.2% during that period.
TABLE 3 Variation in participation rates by color/race for the population, and for people attending undergraduate or graduate courses.
| variation 2000 to 2010 | |||
|---|---|---|---|
| population | undergraduates | graduates | |
| whites | -0,7 | 49,6 | 28,8 |
| blacks | 35,9 | 369,8 | 184,2 |
| pardos | 26,8 | 259,9 | 170,0 |
| blacks | 28,1 | 270,1 | 172,5 |
| total | 12,3 | 84,8 | 48,1 |
Source: Microdata of the School Census, 2000 and 2010 (accessed via BME). Note: The calculations were made considering the age range from 18 to 24 years for undergraduates and 25 to 64 for graduates.
Therefore, the variation rates for blacks and pardos (Table 3) are well above the variation for the total population, especially at the undergraduate level, which is the level of education that has exhibited the highest growth in the decade analyzed in the literature. The high growth levels, especially in undergraduate studies, should be analyzed cautiously because they indicate that we have moved from a very small participation rate for these groups towards more equal participation in that level of education.
Table 4 presents the GPI and RPI distribution for the Brazilian population based on information from the Demographic Censuses of 2000 and 2010. Therefore, the differences found between the groups of students enrolled in and graduates of higher education should be understood in terms of gender relations and racial inequalities, which can assist the proposal of public policies that produce greater equality among groups, especially for blacks.
TABLE 4 Distribution of people by gender, color/race, GPI and RPI - Brazil, 2000 and 2010
| 2000 | 2010 | |||||
|---|---|---|---|---|---|---|
| Gender | N | % | GPI | N | % | GPI |
| Men | 83.602.317 | 49,2 | 1,03 | 93.406.990 | 49,0 | 1,04 |
| Women | 86.270.539 | 50,8 | 97.348.810 | 51,0 | ||
| Total | 169.872.856 | 100,0 | 190.755.800 | 100,0 | ||
| Color/race | RPI | RPI | ||||
| Whites | 91.298.042 | 54,6 | 0,83 | 90.621.281 | 48,3 | 1,07 |
| Blacks | 75.872.428 | 45,4 | 97.171.614 | 51,7 | ||
| Total* | 167.170.470 | 100,0 | 187.792.895 | 100,0 | ||
Source: Microdata of the School Census, 2000 and 2010 (accessed via BME). Note: *total excludes yellows, indigenous people, and people without indication of color; the three groups amounted to 2,702,385 people (1.5%) in 2000 and 2,962,905 people (1.5%) in 2010.
It is noteworthy that the participation of yellows in 2010 was 1.1% and of indigenous people was 0.4% of the total Brazilian population. Thus, they were disregarded to construct an indicator that polarizes and elucidates the participation of whites and blacks.
The GPI value is within the confidence interval for 2000 and 2010. The RPI exhibits changes that occurred during the period, increasing from 0.83 (prevalence of whites) to 1.07 (prevalence of blacks). The 2010 Census shows a reversal in color/race participation in the Brazilian population, as has been observed since the 2008 edition of the National Household Sample Survey (PNAD). According to Cunha (2012, p. 3):
This phenomenon can be attributed both to a difference in fecundity - the overall fecundity rate of black women is 2.1 and of white women is 1.6 children per woman, in the replacement level of the two groups - and/or the systematic increase of the population declaring to be black due to a process of awareness of the importance of assuming one’s own identity.
Sergei Soares (2008) discusses the issues of the change in racial identification of the Brazilian population in the last decade. For the author, this change is not explained solely by fecundity issues, but is primarily explained by the shift in the self-classification of the population: “It can be said that what is happening is not that Brazil is becoming a nation of blacks, but one that is assuming itself as such” (SOARES, 2008, p. 116).
This issue will not be discussed in depth in this study, but it must be mentioned because the changes in the distribution of whites and blacks in the general population have a direct impact on the different levels of education presented below and should be considered in the analysis of the results found per color/race.
Given the parity in the population, or a small prevalence of blacks in 2010, Graph 1 shows the distribution of GPI and RPI for the different levels of education for 2000 and 2010. Understanding the process of occupation of spaces by gender and color/race in higher education demands an analysis, however superficial, of the previous levels of education. Thus, providing information on the whole school journey helps to understand what is observed in the highest level of schooling, namely higher education, and particularly graduate school.
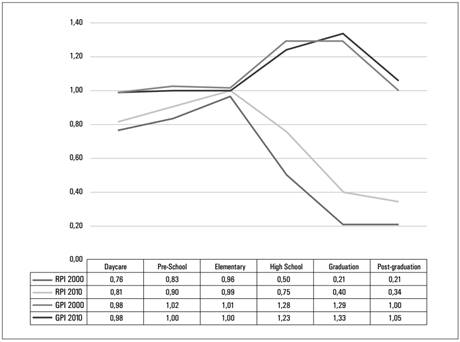
Source: Microdata of Demographic Census 2000 and 2010 (accessed via BME). Note 2: the age groups used were: Daycare from 0 to 3 years; Pre-school (4 to 5 years); Elementary (6 to 14 years); High School (15 to 17 years); Undergraduate (18 to 24 years); and University (25 to 64 years).
GRAPH 1 GPI and RPI for students by level of education, Brazil, 2000 and 2010
Graph 1 shows no differences in the GPI of 2000 and 2010, as the lines practically overlap for all levels. Until elementary school, the differences between women and men are within the confidence interval. The differences between the GPIs begin at high school and favor women also in undergraduate studies. Thus, there were no significant differences in the period considered, indicating stability in access by gender.
The results for the RPI need a more thorough analysis. In the total population, there was a shift from a disadvantage in 2000 for blacks 0.83) to an advantage in 2010 (1.07; Table 4). This change alone in the total population can influence the changes in the RPIs found. In other words, a greater number of people have declared themselves black in 2010 than in 2000, as described by Soares (2008) and cited above. How does self-classification influence the change of blacks in the results found in the different levels of education, in particular for the 2010 data? This issue, as already emphasized, is of fundamental importance, but exceeds the scope of this study and remains open to further studies. The calculation of the indicators considers these changes in racial classification by working with the sum of the color/race groups of the population in the denominator to calculate the indicators (Box 1).
Considering the different levels of education, in 2010, blacks were close to whites in access to daycare and preschool. In elementary school, they were in parity, which can be understood as elementary school is the stage of universalization in school. In high school, the difference between the groups widens considerably; such that in 2000, 50 blacks were recorded for every 100 whites attending high school. In 2010, the ratio was 75 to 100. The improvement observed still shows the marks of the inequalities that, in this level (which has mandatory attendance, following Constitutional Amendment no. 59), have repercussions on the indicators of access to higher education. In 2000, for every 100 whites, there were 21 blacks in undergraduate school, reaching 40 in 2010At the graduate level, the differences are maintained. The general analysis of the graph shoes an intense bottleneck in high school, making it impossible (or difficult) for blacks to access the higher levels of education.
An important aspect to be explored in this article is the distribution of students and graduates by region. Table 5 shows the results for the total population and should be used as the baseline for the analyses of the groups in focus. This attention is essential because the differences between color/race groups by region for the total population are already representative and differentiated, and influence the results for groups of undergraduates, undergraduate degree holders, graduates, and graduate degree holders.
TABLE 5 GPI and RPI for the total population, age range of 25 to 64 years, by region - Brazil 2000 and 2010
| GPI | RPI | >% of blacks in the population (2010) | >% of women in the population (2010) | |||
|---|---|---|---|---|---|---|
| 2000 | 2010 | 2000 | 2010 | |||
| Region | ||||||
| North | 0,96 | 0,98 | 2,38 | 3,08 | 73,5 | 49,5 |
| Northeast | 1,09 | 1,08 | 1,97 | 2,39 | 69,4 | 52,0 |
| Southeast | 1,07 | 1,07 | 0,56 | 0,77 | 42,9 | 51,8 |
| South | 1,04 | 1,05 | 0,17 | 0,25 | 19,9 | 51,2 |
| Midwest | 1,03 | 1,04 | 0,95 | 1,32 | 55,7 | 50,9 |
| Total | 1,06 | 1,06 | 0,76 | 1,01 | 49,5 | 51,5 |
Source: Microdata of the Demographic Census, 2000 and 2010 (accessed via BME).
No significant differences were observed among the GPI values between 2000 and 2010 for the total population (first two columns). The RPI analysis already shows a growing presence of blacks in the population and presents peculiarities that deserve to be highlighted. The Midwestern region, for example, becomes predominantly black, streaming from a parity (0.95) in 2000 to 1.32 in 2010. The Northern region also deserves attention because the prevalence of blacks in the population increased from 2.28 (2000) to 3.08 (2010). In general, the Northern and Northeastern regions have the largest number of blacks in the total population (73.5% and 69.4%, respectively). The opposite is found for the Southern region, with 19.9% of blacks in its population. The intersection of this information with education levels, in which the Northern and Northeastern regions have the lowest rates of graduation, is fundamental for understanding the picture described: are blacks not in higher education because they cannot access existing vacancies or because they are in greater numbers in regions where there are few vacancies?
GRADUATE SCHOOL AND PARITY INDICATORS
Considering the necessity of completing undergraduate courses to have access to post-graduate courses, Table 6 presents GPI and RPI for undergraduate degree holders, graduates (graduate students), and graduate degree holders, comparing data from 2000 and 2010. The age range between 25 and 64 years is consistent with the one observed in the literature to present information for these student groups (BRASIL, 2010; CGEE, 2010).
TABLE 6 GPI and RPI by levels of education - Brazil 2000 and 2010, from 25 to 64 years
| GPI | RPI | |||
|---|---|---|---|---|
| 2000 | 2010 | 2000 | 2010 | |
| Undergraduate degree holders | 1,08 | 1,39 | 0,25 | 0,35 |
| Graduates | 1,00 | 1,05 | 0,21 | 0,34 |
| Graduate degree holders | 0,73 | 0,92 | 0,17 | 0,23 |
| Total (25 to 64 years) | 1,06 | 1,06 | 0,76 | 1,01 |
Source: Microdata of Demographic Census, 2000 and 2010 (accessed via BME).
No differences were observed in the GPI for the total population aged 25 to 64 years in the periods analyzed: both were 1.06 for 2000 and 2010 (last row of the table). In the analysis by levels of education, women, who already prevailed in 2000 for undergraduate degree holders and graduate students, increased their prevalence in 2010. The difference between male and female graduate degree holders decreases from 0.73 to 0.92, tending towards parity. It is important to emphasize that the total number of graduates does not depend on the graduation age. As women have been in academic spaces for less time, a longer time is necessary for their prevalence to affect the rates of graduate degree holders, which is already observed in undergraduate rates. The trend indicates that women will overcome the prevalence of men within this level in the future.
The difference between the RPI for blacks and whites is higher than the GPI for women and men, but it has been decreasing during the period considered. These changes may be a consequence of the change in the self-declaration of color/race or a result of the change in the racial configuration of undergraduate courses observed in the decade with the implementation of affirmative action programs.7
The influence of affirmative action programs on the change of racial configuration in undergraduate courses and its reflexes in graduate courses are subject of research that is at its initial stages. Further studies are needed to monitor public policies for access to higher education, with a focus on graduate programs, to measure and evaluate their influence on the change of the profile of undergraduate and graduate students in the access and completion of graduate programs.
Information on graduates and graduate degree holders characterized by region and administrative category of the educational institution is presented separately below. For the base year of 2010, it is also possible to separate the type of graduate course attended (master’s and doctorate).
Graduates (or graduate students)
Table 7 shows the GPI and RPI values for the total population, aged between 25 and 64 years, by region and graduate group, for the years of 2000 and 2010.
TABLE 7 GPI and RPI of graduate students, aged 25 to 64 years, according to the region and the administrative category of the institution - Brazil 2000 and 2010
| GPI | RPI | |||
|---|---|---|---|---|
| 2000 | 2010 | 2000 | 2010 | |
| region | ||||
| north | 1,00 | 1,08 | 0,28 | 0,45 |
| northeast | 1,29 | 1,12 | 0,23 | 0,39 |
| southeast | 0,94 | 0,99 | 0,15 | 0,32 |
| south | 1,02 | 1,14 | 0,16 | 0,31 |
| midwest | 0,99 | 1,71 | 0,23 | 0,44 |
| total | 1,00 | 1,08 | 0,16 | 0,34 |
| category | ||||
| private | 1,03 | 1,04 | 0,23 | 0,33 |
| public | 0,97 | 1,08 | 0,19 | 0,34 |
| total | 1,06 | 1,08 | 0,21 | 0,34 |
Source: Microdata of the Demographic Census, 2000 and 2010 (accessed via BME).
When evaluating the results in comparison to Table 5, the prevalence of blacks in the North and Northeast regions is not maintained for the group of graduate students. The improved performance (or participation) of blacks is noticeable for all regions in the 2000 and 2010 comparison, but the trend compared to whites is maintained. The best result is recorded in the Northern and Midwestern regions, where there are almost two whites for each black (for every 100 whites, there are 45 blacks in the Northern region and 44 blacks in the Midwestern region). The ratio for the Southeastern and Southern regions is three whites for every black. There were no differences between the public and private administrative categories with a ratio of 5 whites for every black in 2000, that decreased to 3 whites for each black in 2010, regardless of the year analyzed.
In the GPI analysis for graduate students, women show a greater participation in the Midwestern region for 2010. This result requires a separate study to understand the change between 2000 (parity) and 2010 (for every 100 men, there are 171 women).8 For the other regions, the female prevalence is consolidated in 2010. The Southeast is the only region in which the parity is observed in 2010 (0.99). In the analysis of the administrative categories, the female prevalence is subtly found in the public category, with 108 women for every 100 men.
The information for the 2010 base year comprising the type of course attended (master’s or doctorate) and the administrative categories by type of course is presented below. The information for graduate degree holders for the base year 2000 is not separated by master’s and doctorate.
TABLE 8 GPI and RPI by type of graduate degree (master’s or doctorate), for ages ranging from 25 to 64 years - Brazil, 2010
| GPI | RPI | |
|---|---|---|
| Master’s | 1,10 | 0,36 |
| Doctorate | 0,96 | 0,29 |
| Total | 1,05 | 0,34 |
Source: Microdata of the Demographic Census, 2010 (accessed via BME).
Table 8 shows the prevalence of women in master’s courses and a parity in doctoral courses. In RPI, the presence of blacks is higher at the master’s degree level (36 blacks for every 100 whites) than at the doctorate level (29 blacks for every 100 whites). The result reinforces the thesis that differences by color/race increase as the education scale goes up.
TABLE 9 GPI and RPI by type of graduate degree and administrative category, for ages ranging from 25 to 64 years - Brazil, 2010
| Administrative category | GPI | RPI | |
|---|---|---|---|
| Public | Master’s | 1,11 | 0,39 |
| Doctorate | 0,94 | 0,29 | |
| Total | 1,04 | 0,34 | |
| Private | Master’s | 1,09 | 0,33 |
| Doctorate | 1,04 | 0,30 | |
| Total | 1,08 | 0,33 | |
Source: Microdata of the Demographic Census, 2010 (accessed via BME).
The same information distributed by administrative categories (public or private) according to the groups is shown in Table 9. Women prevailed in master’s courses, regardless of the category of institution (1.11 for public and 1.09 for private institutions). Parity occurred at the doctorate level in public institutions (0.94) and in private institutions (1.04). The RPI indicates a greater participation of blacks in master’s courses in public institutions (0.39) than in private institutions (0.33). The participation of blacks in doctoral courses does not depend on the category of institution, as there are 29 blacks for every 100 whites who study in public institutions and 30 blacks in private institutions.
Graduates: undergraduate and graduate
The following tables show the number of people who received undergraduate and graduate (master’s/doctorate) degrees. These numbers can be compared, albeit cautiously, to the enrollment
TABLE 10 GPI and RPI by region, for ages ranging from 25 to 64 years - Brazil, 2000 and 2010
| Region | GPI | RPI | |||
|---|---|---|---|---|---|
| 2000 | 2010 | 2000 | 2010 | ||
| North | Undergraduates | 1,41 | 1,43 | 0,37 | 0,48 |
| Doctorate/master’s graduates | 0,66 | 0,88 | 0,26 | 0,28 | |
| Northeast | Undergraduates | 1,49 | 1,62 | 0,29 | 0,41 |
| Doctorate/master’s graduates | 0,77 | 0,99 | 0,21 | 0,29 | |
| Southeast | Undergraduates | 1,48 | 1,28 | 0,24 | 0,31 |
| Doctorate/master’s graduates | 0,70 | 0,88 | 0,14 | 0,21 | |
| South | Undergraduates | 1,44 | 1,36 | 0,27 | 0,33 |
| Doctorate/master’s graduates | 0,83 | 1,00 | 0,18 | 0,22 | |
| Midwest | Undergraduates | 1,53 | 1,35 | 0,35 | 0,44 |
| Doctorate/master’s graduates | 0,72 | 0,94 | 0,25 | 0,30 | |
| Total | Undergraduates | 1,48 | 1,35 | 0,25 | 0,35 |
| Doctorate/master’s graduates | 0,73 | 0,92 | 0,17 | 0,23 | |
Source: Microdata of the Demographic Census, 2000 and 2010 (accessed via BME).
Table 10 presents the information per region. Female graduates, who already prevailed in the five regions in 2000, sustained their prevalence in 2010. This result should be analyzed considering the GPI of high school and higher education (Graph 1), which are necessary pre-requisites to access graduate school. Thus, the female prevalence is built in basic education.
Men prevailed, both in 2000 and 2010 among those with doctorate/master’s degrees, with improved participation in the last census, namely parity for the Northeastern and Southern regions. These results indicate that access to graduate school is much more restricted and historically has a greater presence of men. It is worth mentioning that access to the higher levels of education is possible for women, especially after the 1980s. Because the measure of graduate degree holders is a sum of all of the people who have reached this level of education regardless of graduation date, the greater presence of men is recorded. However, the results observed for graduate students indicate that such a picture will likely change over the next decades.
In the RPI analysis, the differences observed between 2000 and 2010 significantly marked the unequal access to this level of education. Compared with the results found in Table 5, the prevalence of blacks, especially in the Northern and Northeastern regions, does not affect the differences between the race/color groups. Results, such as the ones recorded, indicate a very subtle improvement in the indicators, however far from the “desired” equity in access to higher levels of education. The observed ratio is 3 whites for each black, regardless of the region analyzed.
Table 11 summarizes the results for the country, separating degrees in master’s and doctorate courses, and shows a prevalence of women graduates in master’s courses (parity) but a lack of parity for doctorate degrees (there are 77 women for every 100 men As for race, the inequalities measured in the group of graduates extend to master’s degrees and doctorate degrees, with a ratio of 19 blacks for every 100 white doctors. Thus, women are slowly becoming “doctors,” as are blacks to a lesser extent.
TABLE 11 GPI and RPI for undergraduate degrees and doctorate/master’s degrees, for ages ranging from 25 to 64 years - Brazil, 2010
| Highest course completed | GPI | RPI | |
|---|---|---|---|
| Undergraduate degrees | 1,35 | 0,35 | |
| Doctorate/master’s degrees | Master’s | 0,98 | 0,24 |
| Doctorate | 0,77 | 0,19 | |
| Total | 0,92 | 0,23 | |
Source: Microdata of the Demographic Census, 2010 (accessed via BME).
The 2010 Demographic Census provides the ability of knowing the qualification areas of those with undergraduate and doctorate/master’s degrees, which may contribute to the understanding of the different insertion of men, women, whites, and blacks in the labor market and in the different spaces of social production. Table 12 provides information by general areas of training.
TABLE 12 GPI and RPI for undergraduate and doctorate/master’s degrees, by general areas of training, for ages ranging from 25 to 64 years - Brazil, 2010
| General areas of training | GPI | RPI | |
|---|---|---|---|
| Education | Undergraduate | 4,51 | 0,56 |
| Master’s | 3,80 | 0,35 | |
| Doctorate | 2,89 | 0,25 | |
| Arts and Humanities | Undergraduate | 2,72 | 0,44 |
| Master’s | 1,51 | 0,31 | |
| Doctorate | 1,15 | 0,24 | |
| Social Sciences, Business, and Law | Undergraduate | 0,97 | 0,28 |
| Master’s | 0,81 | 0,20 | |
| Doctorate | 0,69 | 0,20 | |
| Science, Mathematics, and Computing | Undergraduate | 0,83 | 0,35 |
| Master’s | 0,78 | 0,28 | |
| Doctorate | 0,76 | 0,18 | |
| Engineering, Production, and Construction | Undergraduate | 0,28 | 0,21 |
| Master’s | 0,40 | 0,19 | |
| Doctorate | 0,39 | 0,19 | |
| Agriculture and Veterinary sciences | Undergraduate | 0,37 | 0,25 |
| Master’s | 0,66 | 0,25 | |
| Doctorate | 0,58 | 0,16 | |
| Health and Social Welfare | Undergraduate | 2,12 | 0,30 |
| Master’s | 1,66 | 0,20 | |
| Doctorate | 0,94 | 0,15 | |
| Services | Undergraduate | 1,20 | 0,37 |
| Master’s | 0,62 | 0,28 | |
| Doctorate | 0,29 | 0,15 | |
Source: Microdata of Demographic Census 2010 (accessed via BME).
The GPI analysis indicates a prevalence of women in the areas of education and in health and social welfare in the three education levels presented, which have historically been areas with high female prevalence (BELTRÃO and TEIXEIRA, 2004; RICOLDI and ARTES, 2015; CGEE, 2010). The area of engineering, production, and construction has a male prevalence for the three education levels, and this area has also been historically male (LOMBARDI, 2005, 2006). The greater female presence in the higher levels of education in the field of engineering stands out, as the rate of female undergraduates is 29 for every 100 men and the rate of female doctorates is 41 women for every 100 men. In the field of science, mathematics, and computing, the trend is in favor of men at all three education levels.
The RPI values practically do not change in the three levels considered, neither by degrees nor by areas, indicating that inequalities still come from before, i.e., the access or lack of access for blacks to this level of education. Blacks are more present in the areas where women prevail, namely education and health, which shows, in the best case scenario, 56 blacks for every 100 whites in education. The worst case scenario is in engineering, with 21 blacks for every 100 white graduates. The presence of blacks higher up the education levels is lower; for example, there were 15 doctorate degrees for blacks in the health and services areas for every 100 whites.
Final considerations
The objective of using parity indexes is to shed light on the differences between men and women, and whites and blacks. If a gender parity and a subtle prevalence of blacks in relation to whites is observed among the Brazilian population, the same does not occur when analyzing the educational scenario, especially the higher levels of education. The use of a synthetic indicator conclusively shows the differences between the groups compared. Even if access in the higher levels of education tends to favor women, the situation for blacks is still critical. Although several important accomplishments have been achieved for access for blacks to Brazilian higher education in the last few decades, much remains to be done to achieve the desirable equality between the groups by color/race for access to the higher (and more prestigious) levels of education.
As mentioned, differences between men and women are presented and discussed in different studies, such as UNESCO’s global monitoring reports. However, there is no precedent in terms of differences by color/race, despite the parallelism with the GPI. Thus, the discussions presented here on RPI values should be understood in interaction with other variables, especially distribution by region, given the prevalence of blacks in the North and Northeast. Briefly, the differences observed in this study between the access to and completion of the levels of higher education indicate the extent to which changes are needed for the desired parity to be achieved, especially for blacks. For women, the differences by areas of knowledge, which may be associated with prestige and income in different careers, should also be better studied.
The large set of quantitative information distributed in the article has the objective of showing how much access to a given level of education—here, higher education, and particularly graduate school—needs to be disaggregated into different aspects (or variables) to be better understood. Clearly presenting these differences in numbers does not simplify the issue of racial inequalities, racial discrimination, or racism in the country. On the contrary, it indicates how much needs to be changed. Understanding the differences, monitoring the policies already developed, and proposing new actions to overcome these differences are the new challenges to achieve the desired equity in the access to and completion of the different levels of higher education in Brazil. Parity indexes can help in this process.
REFERENCES
ANDRADE, C.; DACHS, J. N. Acesso à educação por faixas etárias segundo renda e cor/raça. Caderno de Pesquisa, n. 37, 2007. [ Links ]
ARTES, A. Desigualdades de cor/raça e sexo entre pessoas que frequentam e titulados na pós - graduação brasileira: 2000 e 2010. Relatório de Pesquisa, Fundação Carlos Chagas, SP, 2015. [ Links ]
ARTES, A. C. A.; CARVALHO, M. P. de. O trabalho como fator determinante da defasagem escolar dos meninos no Brasil: mito ou realidade? Cadernos Pagu, Campinas, v. 34, p. 41-74, jan./jun. 2010. [ Links ]
BELTRÃO, K.; TEIXEIRA, M. de P. O vermelho e o negro: raça e gênero na universidade brasileira - uma análise da seletividade das carreiras a partir dos censos demográficos de 1960 a 2000. Texto para discussão, n. 1052, Rio de Janeiro, Ipea, out. 2004. [ Links ]
BRASIL. Ministério da Educação. Plano Nacional de Pós-graduação (PNPG) 2011-2020. Brasília, DF: Ministério da Educação, dez. 2010. [ Links ]
CARVALHO, M. P. de. Avaliação escolar, gênero e raça. Campinas: Papirus, 2009. [ Links ]
CENTRO DE GESTÃO E ESTUDOS ESTRATÉGICOS - CGEE. Doutores 2010: estudo da demografia da base técnico-científica brasileira. Brasília, DF: CGEE, 2010. [ Links ]
CUNHA, E. M. G. P. Brasil está reduzindo suas disparidades raciais? In: ENCONTRO NACIONAL DE ESTUDOS POPULACIONAIS: transformações na população brasileira: complexidades, incertezas e perspectivas, 18., Águas de Lindoia, 2012. Anais... Águas de Lindoia: Abep, 2012. [ Links ]
DIEESE, Mapa da população negra no mercado de trabalho. 1999. [ Links ]
FERES JR, J. (org.). Ação afirmativa no ensino superior brasileiro hoje: análise de desenho institucional 2011. Gemaa - Grupo de Estudos Multidisciplinares da Ação Afirmativa IESP/UERJ, 2011. [ Links ]
FRASER, N. “Reconhecimento sem ética.” Lua Nova 70 (2007): 101-138. [ Links ]
GUIMARÃES, A. S. Classes, raças e democracia. São Paulo, Editora 34, 2002. [ Links ]
GOMES, N. L. O movimento negro no Brasil: ausências, emergências e a produção dos saberes. doi: 10.5007/2175-7984.2011 v.10, n.18, p.133. Política & Sociedade, n. 18, p. 133-154, 2011.IBGE, Censo Demográfico. Microdados, 2010. [ Links ]
IBGE. Censo Demográfico. Microdados, 2000. [ Links ]
JANNUZZI, P. de M. Indicadores para diagnóstico, monitoramento e avaliação de programas sociais no Brasil. Revista do Serviço Público, Brasília, v. 56, n. 2, p. 137-160, abr. 2005. [ Links ]
LOMBARDI, M. R. Perseverança e resistência: a engenharia como profissão feminina. Tese (Doutorado em Educação) - Universidade Estadual de Campinas, Campinas, 2005. [ Links ]
LOMBARDI, M. R. Engenheiras brasileiras: inserção e limites de gênero no campo profissional. Cadernos de Pesquisa, v. 36, n. 127, p. 173-202, jan./abr. 2006. [ Links ]
MAGALHÃES, A. Trabalho e educação: os efeitos da educação sobre o processo de estratificação social entre brancos e não brancos no Brasil. 1º Seminário Nacional de Sociologia e Política, UFPR, 2009. [ Links ]
MANCEBO, D.; SILVIA JR, J. dos Reis; OLIVEIRA, João Ferreira. (org.) Reformas e Políticas: educação superior e pós-graduação no Brasil. Alínea, 2008. [ Links ]
MOEHLECKE, S. Ação Afirmativa: história e debates no Brasil. Cadernos de Pesquisa. n. 117 p. 197-219, nov 2002. [ Links ]
MUNANGA, K. Uma abordagem conceitual das noções de raça, racismo, identidade e etnia. Cadernos Penesb, v. 5, p. 15-34, 2004. [ Links ]
PAIXÃO, M. (org.). Relatório Anual das Desigualdades Raciais no Brasil: 2009-2010. UERJ, 2010. [ Links ]
RICOLDI, A.; ARTES, A. Novos lugares da desigualdade? Caracterização do ensino superior sob a interface gênero e raça/cor na atualidade. Relatório de pesquisa. São Paulo: Fundação Carlos Chagas, 2015. [ Links ]
ROSEMBERG, F. O branco no IBGE continua branco na ação afirmativa. Estudos Avançados 18(50), 2004. [ Links ]
ROSEMBERG, F. Desigualdades de gênero e raça no sistema educacional brasileiro. In: CONFERENCE ON ETHINICITY RACE, GENDER AND EDUCATION, Lima, 2002. [ Links ]
ROSEMBERG, F. Ação Afirmativa no Ensino Superior Brasileiro. Programa de Ações Afirmativas em Debate, UFScar, 2006. [ Links ]
SANTAGADA, S. Indicadores sociais: contexto social e breve histórico. Revista FEE, v. 20, n. 4, p. 245-255, 1993. [ Links ]
SANTOS, A. M. dos. Vozes e silêncio do cotidiano escolar: análise das relações raciais entre alunos negros e não negros em duas escolas públicas no município de Cárceres. Dissertação de mestrado, UFMT, 2005. [ Links ]
SEADE. Os negros no mercado de trabalho na região metropolitana de São Paulo. Novembro de 2012. [ Links ]
SILVÉRIO, V. R. S. et al. Educação e ações afirmativas: entre a injustiça simbólica e a injustiça econômica. 2003 [ Links ]
SOARES, S. A demografia da cor: a composição da população brasileira de 1890-2007. In: THEODORO, M. (org.). As políticas públicas e a desigualdade racial no Brasil: 120 anos após a abolição. Brasília, DF: Ipea, 2008. [ Links ]
SOLIGO, V. Indicadores: conceito e complexidade do mensurar em estudos de fenômenos sociais. Est. Aval. Educ., São Paulo, v. 23, n. 52, p. 12-25, 2012. [ Links ]
UNESCO. Relatório de monitoramento global Educação para Todos, 2003-2004. São Paulo: Moderna, 2004. [ Links ]
UNESCO. Relatório de monitoramento global Educação para Todos, 2003-2004. São Paulo: Moderna, 2015. [ Links ]
1The IDEB combines values related to school flow and student performance in proficiency exams into a single numerical indicator. It is published every two years and sets targets to be reached by schools based on educational levels of OECD countries in 2022.
2The concept of affirmative action used is a restorative/compensatory or preventive action, which seeks to correct a situation of discrimination and inequality that has been inflicted on certain groups in the past, present, and future, for a limited period. The emphasis on one or more of these aspects will depend on the target group and the historical and social context (MOEHLECKE, 2002, p. 203.).
3Prouni is a program of the Ministry of Education created by the federal government in 2004, which grants full and partial scholarships (50%) to Brazilian students without a higher education diploma in undergraduate courses and sequential training courses in private institutions of higher education. Fies is a program of the Ministry of Education that finances the completion of higher education for students enrolled in non-free courses under Law 10.260/2001. Students enrolled in higher education courses that have a positive evaluation by the Ministry of Education may apply for the funding.
4The concept of parity used is similar to the one presented by Nancy Fraser (2007): “condition of being a pair, of being in the same condition with others, of starting from the same place” (p. 118).
5Gross enrollment rate (GER): number of students enrolled in a given level of education, regardless of age, expressed as a percentage of the population belonging to the age group that officially corresponds to that level of education. For higher education, the population in the age group of zero to five years above the age of completion of high school is used. GER may exceed 100% due to early or late enrollment and/or grade repetition (UNESCO, 2015, p. 425)
6Observatório da Metrópole. http://web.observatoriodasmetropoles.net/index.php?option=com_content&view=article&id=45&Itemid=114&lang=pt. Accessed September 19, 2013.
Received: March 15, 2018; Accepted: August 28, 2018
 Este é um artigo publicado em acesso aberto sob uma licença Creative Commons
