


Services on Demand
Journal

Article
 text in
  English (pdf)
 Article in xml format
 Send this article by e-mail
Share

 Permalink
Estudos em Avaliação Educacional
Print version ISSN 0103-6831On-line version ISSN 1984-932X
Est. Aval. Educ. vol.29 no.71 São Paulo Aug. 2018
https://doi.org/18222/eae.v29i71.4973
ARTICLE
A study on associated factors through hierarchical quantile regression
IFederal University of Santa Catarina (UFSC), Florianópolis, SC, Brazil, http://orcid.org/0000-0002-5359- 0134, pedro.barbetta@ufsc.br
IIFederal University of Santa Catarina (UFSC), Florianópolis, SC, Brazil, http://orcid.org/0000-0002-4403- 980X, dalton.andrade@ufsc.br
IIIFederal University of Pará (UFPA), Belém, PA, Brazil, http://orcid.org/0000-0003-1725- 3664, heliton@ufpa.br
In this paper, we present an unusual approach to factors associated with academic achievement since we use hierarchical quantile regressions. While the traditional approach aims to identify important factors based on individuals with an intermediate performance, our approach aims to detect the effects on performance distribution quantiles, thus allowing to identify how a certain factor can affect poor-,intermediate-, and high-performing pupils. We describe the methodology and use it with data from Portuguese and Mathematics tests of the 8th grade of primary education in the Brazilian state of Pará, in 2016.
KEYWORDS: Educational Assessment; Associated Factors; Hierarchical Quantile Regression; Academic Achievement
Este trabalho apresenta uma abordagem não usual em estudo de fatores associados ao desempenho escolar, utilizando regressões quantílicas hierárquicas. Enquanto na abordagem tradicional tem-sepor objetivo identificar fatores importantes com base nos indivíduos da faixa intermediária de proficiência, nesta aqui apresentada procura-se detectar efeitos nos quantis da distribuição de proficiência, permitindo identificar como determinado fator influencia estudantes de baixa, intermediária e alta proficiências. São realizadas a descrição da metodologia adotada e uma aplicação com os dados das provas de Língua Portuguesa e Matemática do 8º ano do ensino fundamental doestado do Pará, em 2016.
PALAVRAS-CHAVE: Avaliação da Educação; Fatores Associados; Regressão Quantílica Hierárquica; Rendimento Escolar
Este trabajo presenta un abordaje no usual en el estudio de factores asociados aldesempeño escolar, haciendo uso de regresiones cuantílicas jerárquicas. Mientrasque en el enfoque tradicional se tiene el objetivo de identificar factores importantesen base a los individuos del rango intermedio de competencia, en este abordajese pretende detectar efectos en los cuantiles de la distribución de competencia, lo que permite identificar cómo determinado factor influye en los estudiantes decompetencia baja, intermedia y alta. Se describe la metodología adoptada y unaaplicación con los datos de las pruebas de Lengua Portuguesa y Matemáticas del 8ºaño de la Educación Básica del estado de Pará, en el 2016.
PALABRAS CLAVE: Evaluación de la Educación; Factores Asociados; Regresión Cuantílica Jerárquica; Rendimiento Escolar
INTRODUCTION
Knowing the main factors impacting academic achievement can help managers and teachers guide their actions in a more objective and pragmatic way, thus improving pupil achievement and reducing differences between pupils. Many factors do not depend on teachers or managers, such as family socioeconomic status, but others are closely linked to management and classroom work, such as assigning, collecting and correcting pupils’ schoolwork. Identifying the factors that are most influential on academic achievement and how they interact with different achievement levels has been the goal of several studies, with data coming primarily from large-scale assessments.
Over the last decades in Brazil, we have seen large-scale assessments consolidate as an instrument of public policy in education, whether at federal, state or municipal level. However, there is still a number of challenges regarding the effective use of these assessments in designing, reformulating and monitoring educational actions, projects and programs, particularly with regard to work at the school units. (GIMENES, 2015, p. 254)
In studies on factors associated with academic achievement, whether in primary, secondary or higher education, the methodology of hierarchical models stands out since there are factors associated with the pupil and factors related with his school; in other words, there is a primary hierarchy level - i.e., pupils - and an aggregate hierarchy level - i.e., schools (ALVES; SOARES, 2008; ANDRADE; SOARES, 2008; LAROS; MARCIANO; ANDRADE, 2010; NASCIMENTO, 2012; MORICONI; NASCIMENTO, 2014; PONTES; SOARES, 2016). Because pupil achievement in large- -scale assessments is normally measured using a continuous scale, most studies use linear hierarchical models.
Linear hierarchical models can be considered as an extension of multiple linear regression that is used to accommodate a hierarchical structure, as with pupils grouped in schools. These models aim to evaluate how much of a pupil’s achievement is due to each factor associated with the pupil (family socioeconomic status, the pupil’s perception of school climate, his need to engage in housework, etc.) and to each factor associated with the school (infrastructure, location, connection to federal, state or municipal government, etc.).
One of the main objectives of studies on associated factors is to assess the school’s influence on its pupils’ cognitive achievement, known as the school effect (ALVES; SOARES, 2013; ANDRADE; SOARES, 2008). This effect can be determined by removing the influence of non-school factors, such as the environment and socioeconomic status of the area in which the school is, thus resulting in the part related to the actual school environment, which can be improved by good school management.
The question that emerges is that models traditionally relate average pupil achievement to the various non-school and intraschool factors. But many of these factors can affect high- and poor-achieving pupils differently. Educational policy that aims to improve the learning of children with greater school difficulties normally shows an interest in finding the intraschool factors with greater effect on poor- -achieving children.
This study proposes to evaluate the effect of the different associated factors not only on pupils’ average performances but also on various quantiles (or percentiles) of the performance distribution, thus allowing to determine whether a given factor has a greater effect on high- or on poor-achieving pupils (or schools). Promoting a positive and stronger school environment factor for poor-achieving pupils (or schools) is a contribution to equity in learning.
We applied the methodology proposed above to the Para State Education Assessment System (SISPAE), using the tests of the 8th year of primary education (EF), as well as measures and indicators collected through context questionnaires.
QUANTILES, QUANTILE REGRESSION AND HIERARCHICAL STRUCTURE
The traditional methodology for analyzing factors associated with school achievement involves Regression Analysis, which focuses on determining how each factor affects the average achievement. Usually, the regression equation parameters are obtained through Ordinary Least Squares (OLS).1
There is often an interest in determining whether a particular factor affects more strongly high- or poor- -achieving pupils. In this case, one way of conducting the analysis is using Quantile Regression (KOENKER, 2005). In this procedure, analysis can be in terms of predefined quantiles (or percentiles), such as the median, first quartile and third quartiles of student performance distribution. If there is only one independent variable, then the quantile regression basically estimates several straight lines for the different achievement quantiles desired.
The best-known quantile is the median, q(50%), which separates the lower 50% of a sample from the higher 50%. In a distribution of performances assessed, the k-th quantile, here denoted q(k), may be understood as the value that delimits the poorest-achieving k% of pupils from the higher-achieving (100 - k)%. Figure 1 shows the position of the quantile 25%, denoted q(25%), which corresponds to the value on the scale that separates the poorest-achieving 25%
of pupils in a hypothetical distribution. The quantile q(25%) is also known as the first quartile or the lower quartile.
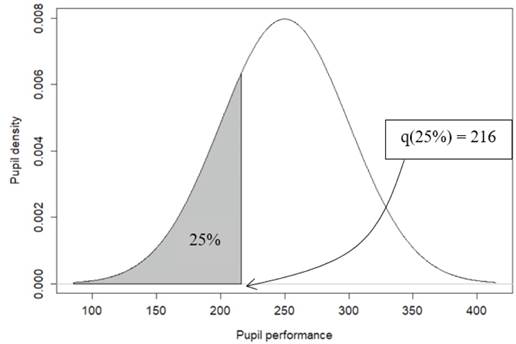
Source: the authors own elaboration, 2018
FIGURE 1: An illustration of the quantile 25%: the point that separates the poorest-achieving 25% of pupils from the highest-achieving 75%
One advantage of using quantile regression for the median, rather than ordinary least squares regression for the mean, is that results will be more robust against outliers in response measures. Chen et al. (2014) point out that quantile regression is more useful than regression for the mean when the random variable has no normal distribution. This type of regression can be seen as a natural analogy to the use of different central tendency, dispersion and asymmetry measures to obtain a more comprehensive and robust analysis (KOENKER, 2005). It is also noteworthy that quantile regression allows analyzing any quantile.
Figure 2 shows various pupil performance quantiles for the comparison between two groups, i.e., pupils with often present teachers and with often absent teachers, according to the answers in the questionnaire administered to the pupils. This figure shows the quantiles through box plots - which is a common representation of medians, quartiles and extremes - and through quantile regressions with the independent variable indicating the attribute in question (0 = often present teachers, 1 = often absent teachers).
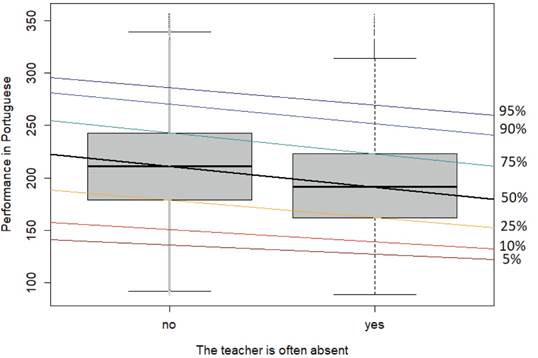
Source: the authors’ own elaboration, 2018
FIGURE 2: Graphical representation of the achievement distribution in Portuguese for 8th grade pupils who were considered according teacher attendance (or the lack thereof), in terms of quantiles of pupils
Figure 2 shows that quantile regressions allow evaluating not only the possible differences in the central position of the distribution, but also whether the effect of the factor of interest is higher on poor-achieving or on high-achieving pupils. The example above shows that the performance expected (median) of pupils whose teacher is often absent is lower than that of pupils whose teacher is often present. However, it seems that the effect of an often absent teacher is approximately the same for the quantiles analyzed (roughly parallel lines). Situations where the lines at the lower quantiles are steeper (have greater slopes) than at upper quantiles indicate that the factor has a greater effect on poor- -achieving students. Martins and Pereira (2004), Davino and Vistocco (2008), Rangvid (2008) and Almeida (2014) present applications of quantile regression in education.
Another common characteristic in educational data analyses is their data hierarchical structure, i.e., pupils are subunits of schools, which may be subunits of boards, districts or other groups. For this reason, we can have groups of students within schools, possibly generating correlated measures within each group. We thus have a source of intraschool variation and a source of variation between schools. The analysis can be affected by intra-group correlations, which makes hierarchical models a good way of portraying this data structure.
Finally, to determine whether a factor has a greater effect on high-achieving or on poor-achieving students, this work focuses on quantiles of performance distribution, considering the hierarchical structure of the data. Hierarchical multiple regression modeling allows isolating the effect of each factor and separating the variation between schools from the variation between students at the same school.
In traditional models, factor effects are evaluated in terms of differences in the expected values. The present study innovates by examining how effects can differ in terms of quantiles, thus allowing to assess effects at different academic achievement levels.
METHODOLOGY
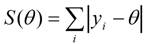
In theoretical terms, the k-th quantile, q(k), is given by the equation P{Y ≤ q(k)} = k, where Y is a continuous random variable. Koenker (2005) and Koenker and Bassett (1978) present a way of finding the median - i.e., q(50%) - using the least squares technique. Based on a set of values (y 1, y 2, ..., y n ), the value of θ which minimizes the sum is obtained:
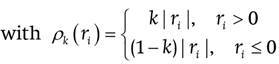
The relationship extends to the other quantiles - i.e., q(k) -, considering different weights for the positive and negative residues (r i = y i −θ ):
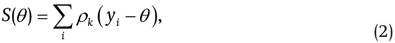
The quantile q(k) is the value of θ that minimizes relationship (2). This method of minimum absolute errors is equivalent to that of maximum likelihood when errors are assumed to have a Laplace distribution, as described by Geraci and Bottai (2014). According to Yu and Zhang (2006), the Laplace distribution is defined by three parameters: one of location, one of dispersion and one of asymmetry; this allows conducting the analysis when the distribution of the variable studied is symmetrical or asymmetric.
Based on Geraci and Bottai (2014), we used in this study the hierarchical quantile regression model described below:

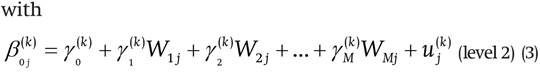
where:
Yij is the dependent variable (achievement) for pupil i at school j;
β oj (k) is the k-th quantile of school j, conditioned to the
other variables of the model that are equal to zero;
β I (k) is the effect of l-th variable for pupil at the k-th quantile (l = 1, 2, ..., L);
k is the schools’ mean k-th quantile, conditioned to the other variables of the model that are equal to zero;
y o (k) m γ is the effect of the m-th variable for school at the k-th quantile (m = 1, 2, ..., M);
e ij (k) is the random error associated with i-th student of school j, supposedly with a Laplace distribution with location parameter equal to zero, dispersion equal to σ and asymmetry equal to k;
u j (k) is the random term associated with school j, supposedly with the normal distribution mean of zero and variance σu 2.
We controlled for the heterogeneity of schools through the random effect at β oj (k) i.e., each school can have a different k-th quantile. Generally, there could be a random effect at some of the effects of student variables, i.e., at β l (k) (l = 1, 2, ..., L). For example, school failure may be assumed to be different depending on the school, as some schools may have treat differently the pupils who were retained.
The model parameters can be estimated through the maximum likelihood method. To that end, we used the package lqmm (GERACI, 2016) do software livre R (R FOUNDATION FOR STATISTICAL COMPUTING, 2017).2
There is not an extensive literature on the subject, but there are other proposals to introduce a hierarchical structure into quantile regression, such as in Chen et al. (2014) and Hassan (2014).
It is worth mentioning the approach of Galarza, Lachos and Bandyopadhyay (2017), who propose improvements in the algorithm to obtain maximum likelihood estimates in hierarchical quantile regression, offering a new package in at R, i.e., qrLMM, which we have studied.
DATA AND VARIABLES
We applied the methodology proposed here to the Pará State Education Assessment System (SISPAE) which was launched in 2013 and evaluates pupils in Portuguese and Mathematics. The 2016 edition assessed pupils in the 4th and 8th grades of primary education, as well as pupils in the 3rd grades of secondary education. The assessment involved students, teachers and principals of 3,534 schools in the 144 municipalities in the state of Pará. Of those, 814 are state schools, 2,714 are municipal schools and six are the so-called Rural Family Houses. Of the initial estimate of 563,413 pupils registered for the assessment, 376,830 actually took the test in Portuguese and 376,684 in Mathematics.
The 2016 edition of SISPAE included the collection of data on pupils’ characteristics for all grades assessed, as well as on teachers, pedagogical advisors, education experts, principals and schools, in order to outline the profile of respondents and obtain data for a more detailed analysis of factors associated with pupil achievement. To that end, questionnaires were administered to: 270,424 students; 15,250 teachers; 3,094 pedagogical advisors; 19,769 education experts; 3,509 principals; and 3,509 schools.
With regard to associated factors in the SISPAE (PARA, 2017), we describe various measures and indicators based on context questionnaires, particularly those answered by the students. We selected these measures and indicators based on the literature on associated factors of school achievement, such as the studies of Alves and Soares (2008, 2013) and Laros, Marciano and Andrade (2010), as well as technical reports on large-scale assessments carried out in other Brazilian states. In this paper, we selected the indicators that were statistically significant, i.e., the ones most strongly associated with performance levels, according to the analysis of SISPAE (PARA, 2017). Since our focus was to show a new analysis approach, we decided not to use a large number of factors.
We constructed various measures using item response theory (IRT) with degree scale models (ANDRADE; VALLE, 2000; AYALA, 2009), three of which were used in this paper: SISPAE 2016 (PARA, 2017)
Pupil Family Socioeconomic Status (SES);
School Relationship Level in the Pupil’s Perception (SRL);
School Climate Level in the Pupil’s Perception (SCL).
Measurements were also aggregated, in terms of the means, for the classes of the pupil’s school year. In this paper, we standardized such measures with a mean of zero and a standard deviation of 1 in relation to the group of pupils studied. We standardized the aggregate measure in relation to the group of schools studied.
We also considered the following variables indicating the presence of factors associated with academic achievement: student sex; grade retention indicator; indicator of homework done, among others. Table 1 shows the full list of factors analyzed in this study.
RESULTS AND DISCUSSION
In this section we present and discuss the results of hierarchical quantile regressions it was conducted with the Portuguese and Mathematics tests for the 8th grade of primary education in the state of Para in 2016.
The estimation was based on a set of 1,808 schools and more than 66,000 pupils, which correspond to the observation units with answers in the variables studied.
To better illustrate the information that can be obtained through our approach, initially we will present an analysis performed through common hierarchical regression, based on the mean value of performance levels. Table 1 shows the expected effect of each factor included in the analysis. The estimation method was maximum likelihood, using lme4 (BATES et al., 2015).
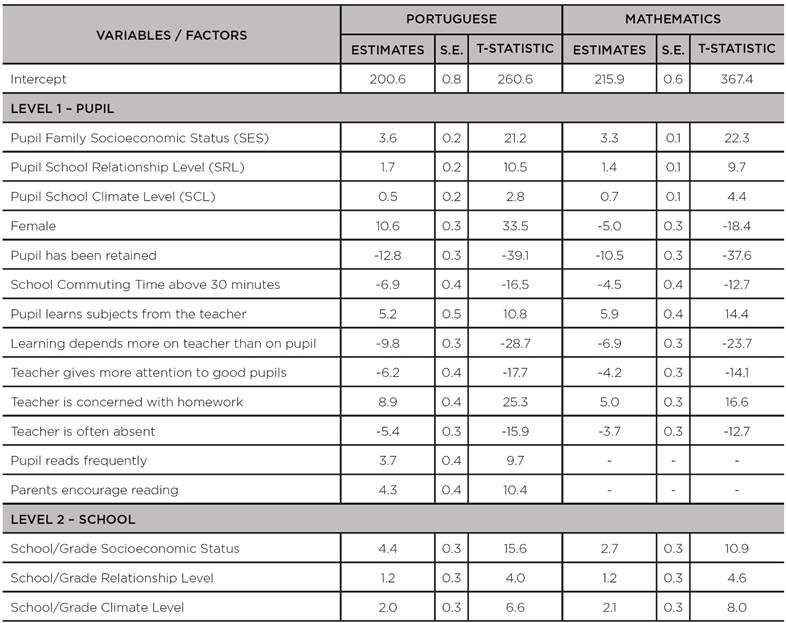
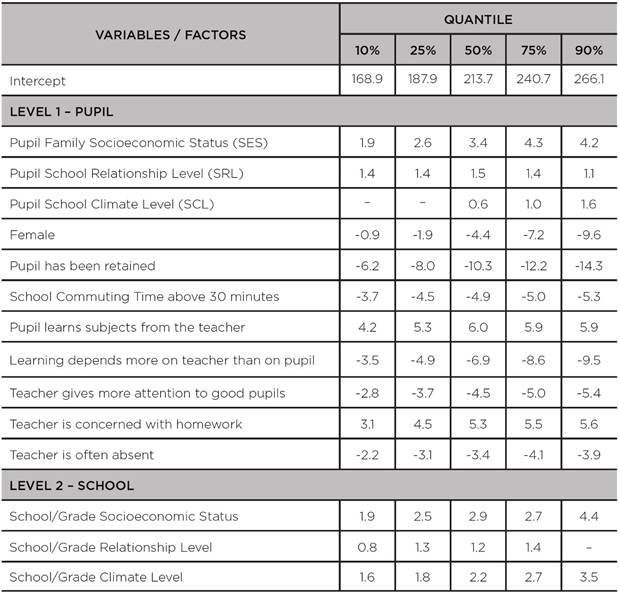
TABLE 1: Estimates of effects expected for the factors analyzed by adjusting a Hierarchical Model to data for the 8th grade of primary education in SISPAE 2016, by subject
Source: the authors’ own elaboration, 2018.
All estimates presented in Table 1 are statistically significant (p < 0,05).3 By analyzing effects estimates, we found that school climate and school relationship levels (SCL and SRL, respectively) have a positive effect on academic achievement in the population studied. In figures, for each additional standard deviation of pupil-perceived school climate, the mean performance in Portuguese tends to be two units higher.
In general, girls did better in Portuguese, and boys, in Mathematics: the estimated effect on girls’ means compared to boys is of 10.6 in Portuguese and -5.0 in Mathematics.
The mean performance levels for the group of pupils who had been retained were significantly below the levels for the others: estimates were -12.8 in Portuguese and -10.5 in Mathematics, i.e., pupil retention due to poor performance (or other reasons) does not tend to bring these pupils to the same level as the other pupils in the following years.
The results above are consistent with other studies on associated factors, such those of Laros, Marciano and Andrade (2010) and Alves and Soares (2008). However, these effects are observed at the mean level of performance, leaving unanswered questions such as the following: Can the effect of school climate be greater on poor-achieving pupils? Does the difference between females and males occur to a greater degree on poor- than on high-achieving pupils, or vice versa? And is the effect of a homework-concerned teacher greater on poor- than on high-achieving pupils or vice versa? Overall, what we try to answer in this paper is whether a given effect is greater on high- or on poor-achieving pupils. To that end, we conducted the analysis below based on the quantiles of the distribution of performance levels.
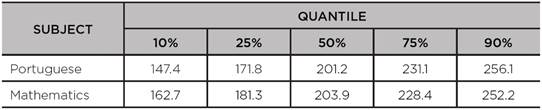
Table 2 shows various quantiles of SISPAE 2016 scores in the SAEB scale. So, for example, in the Portuguese test, the quantile 10% equals 147.4, which means that the performance of 10% of pupils in Portuguese is equal to or below 147.4 points. With regard to the quantile 90%, Table 2 shows that the performance of 90% of pupils in Portuguese is equal to or below 256.1 points, or put differently, 10% of students perform above 256.1 points. Therefore, q(10%) separates the poorest-achieving 10%, while q(90%) separates the highest-achieving 10%.
TABLE 2: Performance levels of pupils on the 8th grade of primary education in SISPAE 2016 scores by subject, considering some quantiles of interest,
Source: the authors’ own elaboration, 2018.
In this section, the discussion focuses on how much the different values of the explanatory variables - or the presence of factors that usually affect achievement - can change the values of quantiles and, moreover, whether the effect is greater (or smaller) on the quantiles that separate poor-achieving pupils, or on the quantiles that separate high- -achieving pupils.
Table 3 presents the estimates for the effects of the studied factors on some quantiles of the distribution of performance levels in Portuguese. Overall, we only present maximum likelihood estimates that had statistical significance at the 0.05 level. Tables with standard errors and tests of significance for these quantiles are shown in the Appendix (tables A1 to A5).
TABLE 3: Coefficients of the hierarchical quantile regression models adjusted to the scores of the 8th grade of primary education in the SISPAE 2016 Portuguese test
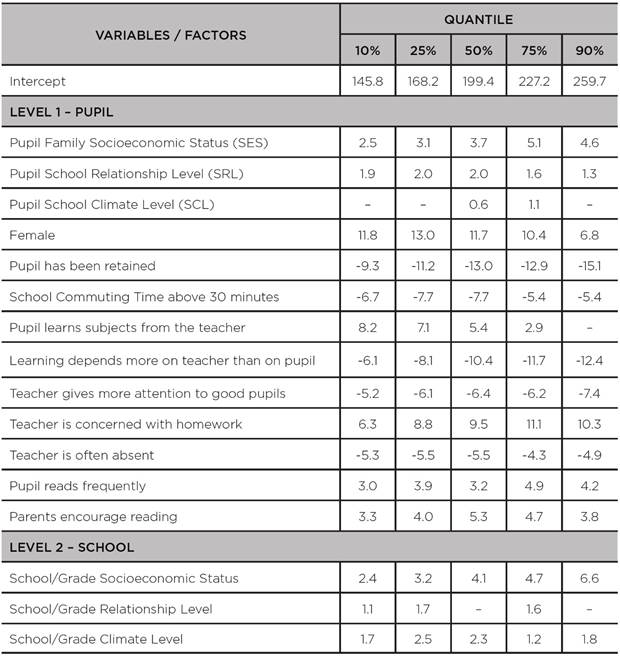
Source: the authors’ own elaboration, 2018.
The effect of family socioeconomic status (SES) on pupil achievement is very well-known. Table 3 shows that an increase in pupil family socioeconomic status (SES) standard deviation drives an increase of 3.7 points in the median performance, an estimate similar to that obtained with the model for the mean (Table 1), which is reasonable, since both measures are of central tendency for the distribution of performance levels. However, with quantile regressions, the effect of SES is greater on higher-achieving pupils: in the quantile 10% (the point that separates the poorest-achieving 10% of pupils), the estimated effect of socioeconomic status (SES) standard deviation was 2.5 additional points in the test, whereas in the quantile 90% (which separates the highest- -achieving 10% of pupils), the estimated effect was of 4.6 additional points. By analyzing the values for grade/school SES, we can see that the relationships are similar to what occurs with pupil family SES. Table 4 shows the quantiles for the distribution of performance levels in Mathematics. The relationships are very similar to Portuguese for most of the variables/factors analyzed.
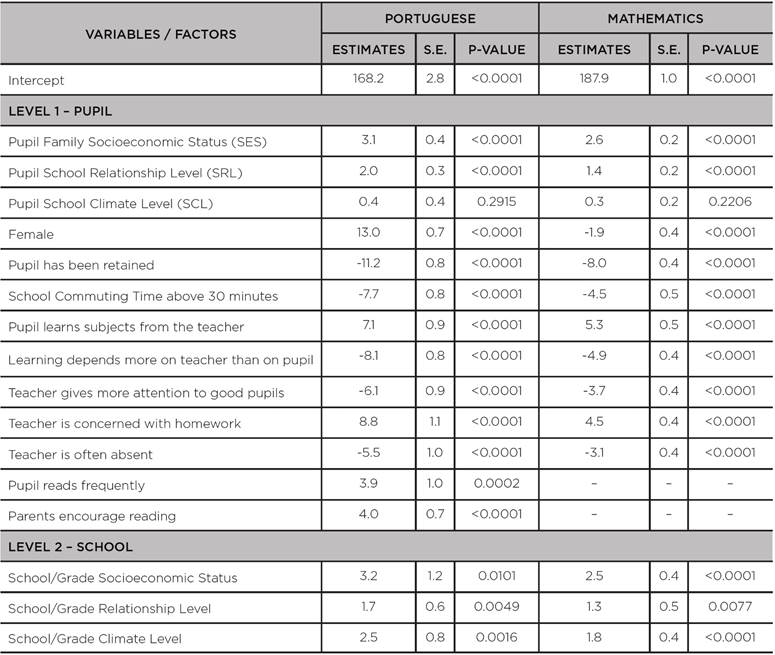
Tables A1 to A5 show the estimated values of the coefficients of the quantile hierarchical regressions, including the respective standard errors and the p-values for the statistical test associated to the null hypothesis in which the coefficient is null, i.e., the variable or factor under analysis has no significant effect.
It is worth noting that some coefficients had no statistical significance (p-value greater than 0.05) and, therefore, were not explained in tables 3 and 4 above; however, tables A1 to A5 list all the results obtained through the adjustment of the models.
TABLE A1: Coefficients, standard errors and p-values for the quantile 10% - q (10%) - of the hierarchical quantile regression models adjusted to the scores of the 8th grade of primary education in the SISPAE 2016, by subject

Source: the authors’ own elaboration, 2018.
TABLE A2: Coefficients, standard errors and p-values for the first quartile - q(25%) - of the hierarchical quantile regression models adjusted to the scores of the 8th grade of primary education in the SISPAE 2016, by subject
Source: the authors’ own elaboration, 2018.
TABLE A3: Coefficients, standard errors and p-values for the median - q(50%) - of the hierarchical quantile regression models adjusted to the scores of the 8th grade of primary education in the SISPAE 2016, by subject

Source: the authors’ own elaboration, 2018.
TABLE A4: Coefficients, standard errors and p-values for the third quartile - q(75%) - of the hierarchical quantile regression models adjusted to the scores of the 8th grade of primary education in the SISPAE 2016, by subject
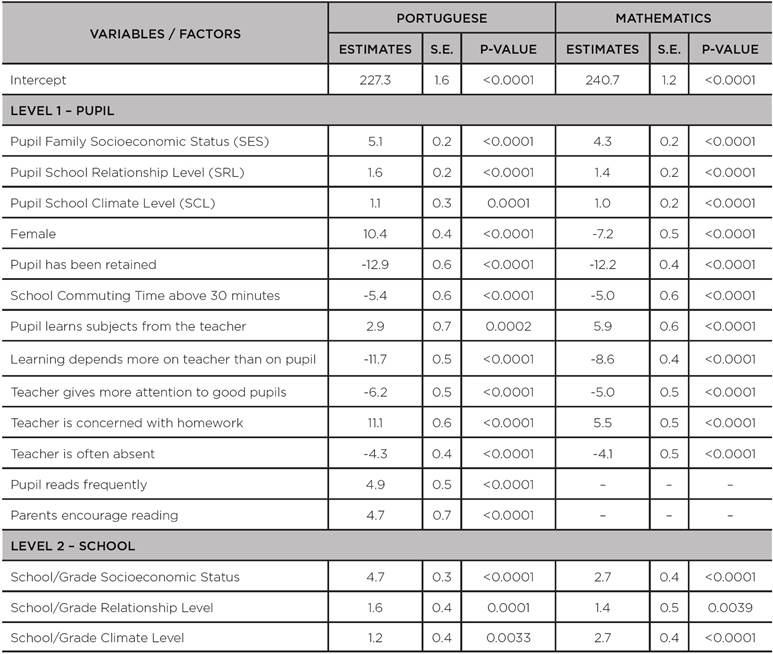
Source: the authors’ own elaboration, 2018.
TABLE A5: Coefficients, standard errors and p-values for the quantile 90% - q(90%) - of the hierarchical quantile regression models adjusted to the scores of the 8th grade of primary education in the SISPAE 2016, by subject
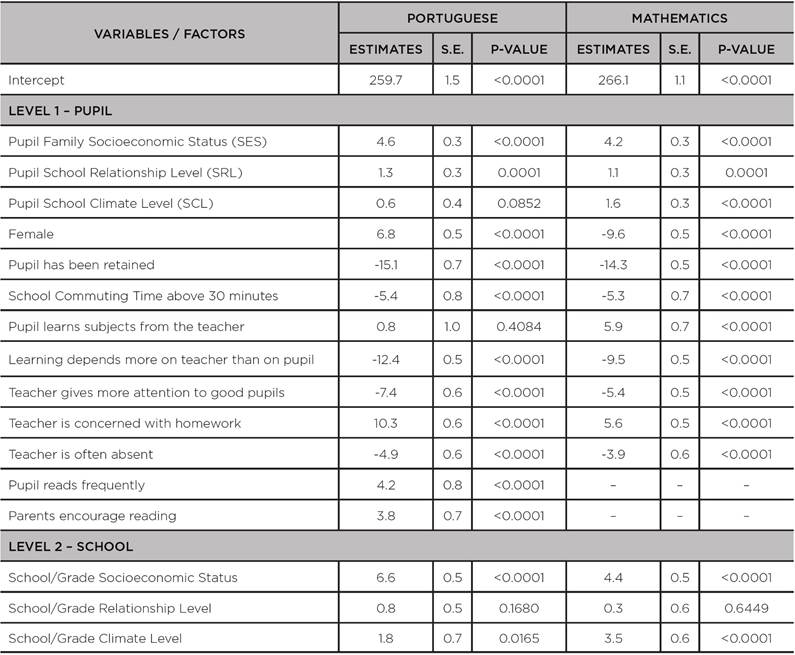
Source: the authors’ own elaboration, 2018.
TABLE 4: Coefficients of hierarchical quantile regression models adjusted to the scores of the 8th grade of primary education in the SISPAE 2016 Mathematics test
Source: the authors’ own elaboration, 2018.
Note: Factors related to reading (parental encouragement and whether the pupil himself/herself reads frequently) were excluded as they showed no significant effect and made little sense for the Mathematics test.
Figures 3 to 7 reproduce the effect estimates in each quantile for the factors in which important differences were observed, Portuguese and Mathematics, including 95%
confidence intervals.
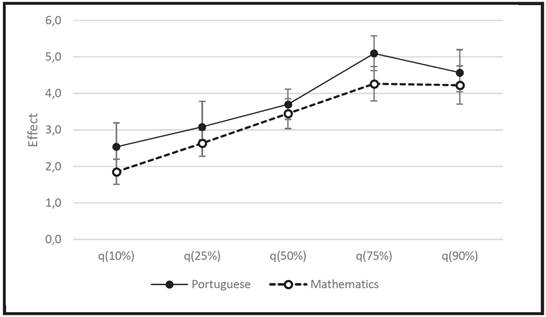
Figure 3 shows the effects of pupil family socioeconomic status. In both areas, the intervals at the quantiles 10% and 90% are disjoint, indicating a significant difference; the same occurs between the lower quartile - q(25%) - and the upper quartile - q(75%). In other words, the effect of SES is significantly greater on higher-achieving students.
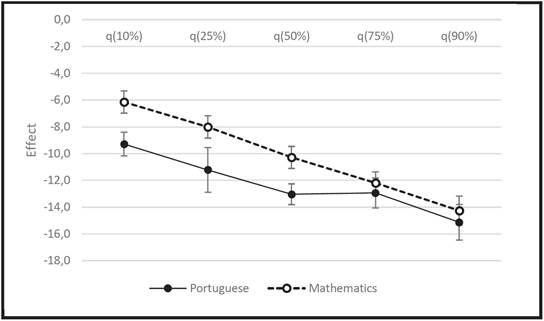
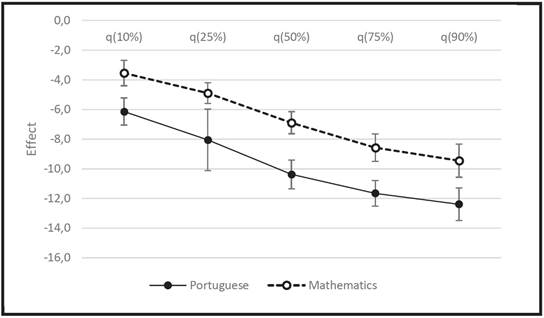
One well-studied factor in large-scale assessments is grade retention. In both tests, we found a negative effect of “pupil has been retained”, with a reduction of more than 10 points in the median compared to the group that had not been retained. It is also noteworthy that this effect is greater on higher-achieving pupils. In the quantile 90%, which separates the highest-achieving 10% of pupils, the difference between the two groups was 15.1 points for Portuguese and 14.3 points for Mathematics (Figure 4). It is worth noting that there are far less cases of retained high-achieving pupils, but it is also worth considering the influence of some other uncontrolled factor, such as student/family in previous years, which led to retention.
Source: the authors’ own elaboration, 2018
FIGURA 4: Effect of grade retention on the quantiles analyzed
Retained students were found to perceive negative effects associated with “teacher is often absent” and “teacher gives more attention to good pupils” (tables 3 and 4). There is no clear tendency of increase or decrease in these effects towards larger quantiles, i.e., the effects of these indicators are negative for high- and poor-achieving pupils alike.
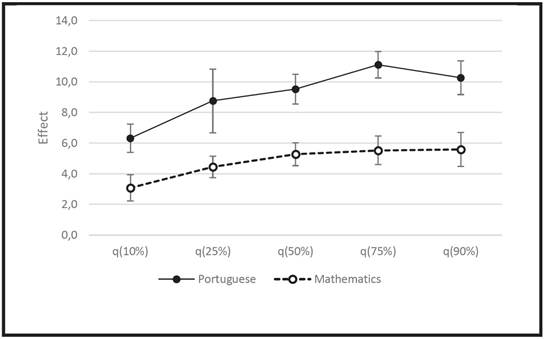
The positive effect of “teacher is concerned with homework” is slightly higher for higher-achieving students. This suggests that higher-achieving students are making better use of homework and correction by the teacher (Figure 5).
Source: the authors’ own elaboration, 2018
FIGURE 5: Effect of “Teacher is concerned with homework” on the quantiles analyzed
An interesting point is the strong negative effect when pupils perceive that “Learning depends more on teacher than on pupil”. By using quantile regressions, we found that this effect is greater on higher-achieving pupils. In Portuguese, for students in the quantile 90%, the difference is around 12 points. In contrast, for those in the quantile 10%, the negative effect is around 6 points. Perhaps this behavior is characteristic of poor-achieving pupils, whose group homogeneity (whether agreeing or disagreeing with the statement) leads to a smaller difference of performance, the opposite occurring with the higher-achieving pupils (Figure 6).
Source: the authors’ own elaboration, 2018
FIGURE 6: Effect of pupils’ agreement with “Learning depends more on teacher than on pupil” on the quantiles analyzed
An interesting point which can be seen in various studies on large-scale assessment, is that in Mathematics boys have a better performance, while in Portuguese it is girls who perform better. Figure 7 shows the effects of the sex factor in different quantiles, both for Portuguese and Mathematics.
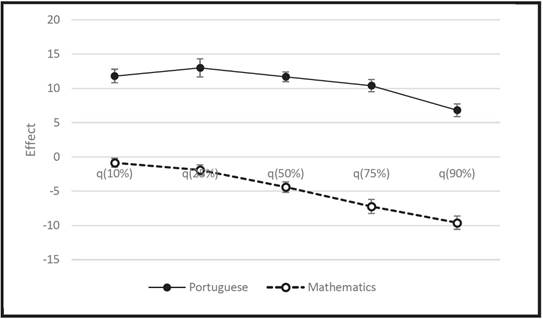
The novelty about our finding is that in Mathematics the difference between sexes is higher among the higher- -achieving pupils, with the boys performing significantly better than girls (almost 10 points in the quantile 90%). On the other hand, in Portuguese, where girls stand out, the difference is greater among poor-achieving pupils (more than 10 points at the lower quantiles). Considering Portuguese and Mathematics together, our analysis suggests that boys are in a more extreme position than girls, since in Portuguese, where their performance is usually worse, the difference is greater among the poor-achieving; in Mathematics, where their performance is usually better, the difference increases for the high-achieving.
CONCLUSION
There are few studies on factors related to academic achievement, which use quantile regression, especially hierarchical quantile regression. In a way, this is understandable, since hierarchical quantile regression is not yet a well-known, ‘mainstream’ method. Another reason why few studies use it is that it is not implemented in main commercial software in the field of statistics. However, our analyzes presented good evidence of factors that have a more significant influence when comparing high- and poor-achieving pupils, thus providing school management with valuable insights.
In this study, we have shown, for example, that pupil socioeconomic level causes greater differences among high- -achieving pupils; the same holds for the positive effect of the “teacher is concern with homework” factor. Poor-achieving pupils seem to be more dependent on the teacher, since agreement with the “learning depends more on teacher than on pupil” statement has a high negative effect on the various quantiles of the distribution. Using the quantile regression approach, we found that this negative effect is stronger on higher-achieving groups, i.e., high-achieving pupils who agree with this statement tend to perform significantly below high-achieving ones who disagree.
Our results should encourage further studies with other populations, which might confirm the several relationships discussed in this paper. Moreover, there are public policies designed to mitigate academic achievement differences among pupils through actions to improve performance, especially for those with greater learning difficulties. Hierarchical quantile regression can be a good tool to objectively evaluate the effect of these policies because it measures the effect of factors of interest on different academic achievement levels, not only on their expected value.
ACKNOWLEDGEMENTS
To the Foundationfor the Entrance Exam of Unesp (VUNESP) for providing us with data and for supporting the development of research on educational assessment.
REFERENCES
ALMEIDA, A. T. C. Determinante dos piores e melhores resultados educacionais dos alunos da rede pública de ensino fundamental no Brasil. Planejamento de Políticas Públicas, Brasília, DF, n. 42, p. 147-187, jan./jun. 2014. [ Links ]
ALVES, M. T. G.; SOARES, J. F. O efeito das escolas no aprendizado dos alunos: um estudo com dados longitudinais no ensino fundamental. Educação e Pesquisa, São Paulo, v. 34, n. 3, p. 527-544, set./dez. 2008. [ Links ]
ALVES, M. T. G.; SOARES, J. F. Effects of schools and municipalities in the quality of basic education. Cadernos de Pesquisa, São Paulo, v. 43, n. 149, p. 492-517, maio/ago. 2013. [ Links ]
ANDRADE, R. J.; SOARES, J. F. O efeito da escola básica brasileira. Estudos em Avaliação Educacional, São Paulo, v. 19, n. 41, p. 379-406, set./dez. 2008. [ Links ]
ANDRADE, D. F.; TAVARES, H. R.; VALLE, R. C. Teoria da resposta ao item: conceitos e aplicações. São Paulo: Associação Brasileira de Estatística, 2000. [ Links ]
AYALA, R. J. The theory and practice of item response theory. New York: The Guilford, 2009. [ Links ]
BATES, D.; MAECHLER, M.; BOLKER, B.; WALKER, S. Fitting linear mixed- -effects models using lme4. Journal of Statistical Software, Innsbruck, Austria, v. 67, n. 1, p. 1-48, Oct. 2015. [ Links ]
BOTTAI, M.; ORSINI, N.; GERACI, M. A gradient search maximization algorithm for the asymmetric Laplace likelihood. Journal of Statistical Computation and Simulation, London, v. 85, n. 10, p. 1919-1925, 2015. [ Links ]
CHEN, Y. L.; TIAN, M. Z.; YU, K. M.; PAN, J. X. Composite hierachical linear quantile regression. Acta Mathematicae Applicatae Sinica, London, v. 30, n. 1, p. 49-64, 2014. [ Links ]
DAVINO, C.; VISTOCCO, D. Quantile regression for the evaluation of student satisfaction. Statistica Applicata, London, v. 20, n. 3-4, p. 179-196, 2008. [ Links ]
GALARZA, C. E.; LACHOS, V. H.; BANDYOPADHYAY, D. Quantile regression in linear mixed models: a stochastic approximation EM approach. Statistics and Its Interface, London, v. 10, n. 3, p. 471-482, 2017. [ Links ]
GERACI, M. Linear quantile mixed models: the lqmm package for Laplace quantile regression. Journal of Statistical Software , Innsbruck, Austria, v. 57, n. 13, p. 1-29, Mayo 2014. [ Links ]
GERACI, M.; BOTTAI, M. Quantile regression for longitudinal data using the asymmetric Laplace distribution. Biostatistics, Oxford, UK, v. 8, n. 1, p. 140-154, 2007. [ Links ]
GERACI, M.; BOTTAI, M. Linear quantile mixed models. Statistics and Computing, London, v. 24, n. 3, p. 461-479, 2014. [ Links ]
GIMENES, N. Avaliação em larga escala no Brasil: tensões e desafios. Estudos em Avaliação Educacional , São Paulo, v. 26, n. 62, p. 254-261, maio/ago. 2015. [ Links ]
HASSAN, I. Hierarchical quantile regression. 2014. 34f. Thesis (Master of Science in Biostatistics ) - University of Alberta, Canada, 2014. Disponível em: <Disponível em: https://era.library.ualberta.ca/files/m326m3245/Hassan_Imran_201408_ MSc.pdf >. Acesso em: 05/09/2017. [ Links ]
KOENKER, R. Quantile regression. Cambridge, UK: Cambridge University, 2005. [ Links ]
LAROS, A. J.; MARCIANO, J. L.; ANDRADE, M. J. Fatores que afetam o desempenho na prova de Matemática do Saeb: um estudo multinível. Avaliação Psicológica, Porto Alegre, v. 9, n. 2, p. 173-186, ago. 2010. [ Links ]
MARTINS, P. S.; PEREIRA, P. T. Does education reduce wage inequality? Quantile regression evidence from 16 countries. Labour Economics, New York, v. 11, n. 3, p. 355-371, June 2004. [ Links ]
MORICONI, G. M.; NASCIMENTO, P. A. M. M. Fatores associados ao desempenho dos concluintes de engenharia no Enade 2011. Estudos em Avaliação Educacional , São Paulo, v. 25, n. 57, p. 248-278, jan./abr. 2014. [ Links ]
NASCIMENTO, P. A. M. M. Fatores associados ao desempenho escolar: resultado de um modelo multinível de valor adicionado. Estudos em Avaliação Educacional , São Paulo, v. 23, n. 51, p. 16-39, jan./abr. 2012. [ Links ]
NETER, J.; KUTNER, M.; WASSERMAN, W.; NACHTSHEIM. C. Applied linear statistical models. Boston: McGraw-Hill/Irwin, 1996. 1415p. [ Links ]
PARÁ. Secretaria da Educação. Estudos do SisPAE 2016 - Perfil dos participantes e fatores associados ao desempenho escolar. Belém do Pará, fevereiro 2017. Disponível em: <Disponível em: https://sispae.vunesp.com.br/Revistas2016.aspx >. Acesso em: 7 mar. 2018. [ Links ]
PONTES, L. A. F; SOARES, T. M. As metas escolares do Ideb: uma proposta alternativa de cálculo. Estudos em Avaliação Educacional , São Paulo, v. 27, n. 66, p. 690-715, set./dez. 2016. [ Links ]
RANGVID, B. S. Educational peer effects quantile regression evidence from Denmark with PISA 2000 data. The economics of education and training. Germany: Physica-Verlag, 2008. [ Links ]
R FOUNDATION FOR STATISTICAL COMPUTING. R Core Team. R: a language and environment for statistical computing. Vienna, Austria: R Foundation for Statistical Computing, 2017. Disponível em: <Disponível em: www.R-project.org >. Acesso em: 05/09/2017. [ Links ]
YU, K.; ZHANG, J. A three-parameter asymmetric Laplace distribution and its extension. Communications in Statistics: Theory and Methods, London, v. 34, n. 9/10, p. 1867-1879, Sept. 2006. [ Links ]
Notes
2 Further references on this method can be obtained in Geraci and Bottai (2007, 2014), Geraci (2014) and Bottai, Orsini and Geraci (2015).
Received: September 20, 2017; Accepted: May 10, 2018
 Este é um artigo publicado em acesso aberto sob uma licença Creative Commons
