


 texto em
  Inglês (pdf)
 Artigo em XML
 Enviar este artigo por email
 Permalink
INTRODUCTION
Several studies conducted in different contexts have indicated that preschool attendance is an effective way of ensuring decrease of inequality in educational opportunities. It contributes to various dimensions of child development, as well as longer school trajectories, especially for vulnerable children from families with low socioeconomic status. International longitudinal studies have confirmed that, as a general rule, children who have had the opportunity to attend good quality early childhood-care programs have shown greater development of cognitive and socioemotional skills in the short and medium term, during their school trajectories (PEISNER-FEINBERG et al., 2001; SYLVA et al., 2010; SAMMONS et al., 2006; TYMMS et al., 2009, NICHD, 2006).
An important discussion centers around the definition of quality of care in early childhood education. The international literature describes two main educational factors associated with the development of children at the beginning of schooling: A) structure quality, which includes teacher training, attendance, the adult-child ratio, and building characteristics; and B) quality of school processes, a category that includes adult-child interactions, the instructional climate, and pedagogical practices. Studies with more robust designs, which include controls for previous skills and the sociodemographic characteristics of families and children, suggest that the quality of school processes is moderately or weakly associated with the cognitive, linguistic, and socioemotional development of children, both during preschool and in later education. However, the evidence that relates to the impact of the quality of the care structure is not as consistent (HOWES et al., 2008; SYLVA et al., 2006, 2010; NATIONAL INSTITUTE OF CHILD HEALTH AND HUMAN DEVELOPMENT EARLY CHILD CARE RESEARCH NETWORK - NICHD ECCRN; DUNCAN, 2003; WALSTON; WEST, 2004).
Early childhood education in Brazil has achieved considerable progress nationally, since it was inserted into the basic education system by the 1988 Constitution and consolidated in the 1996 Law on the Guidelines and Bases of Education. The expansion of early childhood education demonstrates the increasing importance given to educating young children. The growing enrollment and rate of attendance is evident from time series. Only 13.8% of Brazilian children under the age of 3 years attended preschool in 2001; this figure reached 30.4% in 2015. In 2001, 64.4% of 4-5 year-olds attended preschool; this figure reached 90.5% in 2015 (OBSERVATÓRIO DO PNE, s.d.).
However, these percentages are still far short of Goal 1 of the National Education Plan, which aims to have universal pre-schooling by 2020, in accordance with Law No. 12.796, which makes it compulsory for children to attend school from the age of four (BRASIL, 2013) and expects 50% of children under the age of 3 years to have the option to attend crèche. The municipal systems responsible for early childhood education have encountered many challenges in guaranteeing a greater number of places. Frequently, unplanned expansions have led to low-quality services, including poorly maintained institutions, which are detrimental to children’s development (CAMPOS et al., 2011a). However, few studies have investigated the impact of preschool/ early childhood education and/or quality of care on children’s development. The few studies that do exist are not longitudinal; for this reason, they have limitations when it comes to drawing causal relationships between preschool quality and the future learning trajectory of children.
The present study investigates the impact of the main program for early childhood education adopted in the city of Rio de Janeiro - Child Development Center [Espaço de Desenvolvimento Indantil - EDI] - on the development of children in the first year of preschool. The study is restricted to a sample of schools in the municipal system of Rio de Janeiro and is limited to observing the impact of distinct forms of care within this system. The program guidelines are primarily associated with the structure of care, in that they include “a combination of crèche and preschool, primary care classrooms,2 infant libraries, and full-time care” (RIO DE JANEIRO, 2010). The first section of this paper discusses the designs and results of international studies that have focused on the relationship between the quality of the preschool care structure and/or process on children’s development and subsequent education. It also reveals the lack of studies with designs robust enough to identify the impact of educational policies for early childhood education in the Brazilian context. The second section presents the results and the analyses carried out to observe the impact of EDIs on the cognitive development of children.
Specifically, it analyzes the data collected in the research project Baseline Brazil [Linha de Base Brasil- LBB]: a longitudinal study on children’s learning trajectory, which used a probabilistic sample representative of the municipal public system of Rio de Janeiro, with 46 schools (2,716 children), stratified by type of care (regular or EDI). Data were collected in two waves during 2017 - in March 2017 (at the start of the school year) and in November/December 2017 (at the end of the school year). A descriptive data analysis indicates a non-uniform implementation of the program. Some EDIs operate parttime and/or in old buildings - without the infrastructure and classroom time considered adequate by the program guidelines. A descriptive analysis also suggests an association in the same direction between attending EDIs and language development in children. However, analyses of the results using hierarchical linear models, with controls related to the children’s characteristics, their families, the schools and, especially, the measurement of each child’s initial level of development upon entering preschool (Wave 1) do not indicate an effect of attending EDI schools on children’s cognitive development, at least not in the short term. The study has detected variations in program implementation; however, the results observed are consistent even when the analyses take into account only the effect of attending EDIs in full-time classrooms (the child-and-class model).
THE EFFECTS OF SCHOOL AND QUALITY OF CARE ON EARLY CHILDHOOD EDUCATION: THE EVIDENCE AND DEBATE
For Goldstein (1997), in a “scientifically ideal” world, the study of causality in education would be based on randomized experiments in which individuals (students, teachers, and principals) and “treatments” (school factors, such as classroom size, curricular content, pedagogical material, school organization, and school composition) would be randomly distributed to institutions. This would make it possible to guarantee study designs with high internal validity, avoiding selection bias (CANO, 2009; SHADISH; COOK; CAMPBELL, et al., 2001; MURMANE; WILLET, 2011).3
In the real world, however, it is common to have no control over the distribution of individuals, the composition of schools and classes, or the way in which teachers teach. When it comes to theme of the present study, there is scant robust experimental evidence on the relationship between the characteristics of preschool quality of care and the development of children. In other words, few studies have attempted to experimentally manipulate the child-adult ratio and/or the educational level and training of teachers or caregivers.4 Most of the studies that have observed the impact of quality of care on children’s education or of school characteristics on children’s development and/or other school outcomes are correlational. As a result, there are always limitations or concerns that either selection bias or omitted variables in the estimated models could explain the observed relationships (GOLDSTEIN, 1997; NICHD ECCRN; DUNCAN, 2003; LEE, 2004; FRANCO; BROOKE; ALVES, 2008).
For Goldstein (1997), school-effectiveness studies need satisfactory designs/models to observe the relationship between educational factors and particular outcomes/results. To avoid selection bias and make “fair comparisons” between schools, it is necessary to control the characteristics that are known to have an impact on results, when using available theories. For example, a wide range of studies have shown that students input (gender, background, and ethnicity, for example) and initial ability/performance differ between schools, due to various factors. To avoid selection bias, it is necessary to measure these dimensions accurately at the individual level (FITZ-GIBBON, 1996; GOLDSTEIN, 1997; LEE, 2004). Thus, the literature on school effectiveness proposes some minimal conditions to draw satisfactory conclusions about the impact of school factors on learning and other educational outcomes. The first condition relates to the research design. It is important for the design to be longitudinal, taking two or more measurements from the same individuals over time.5 This is a fundamental way to control for preexisting differences between students in cross-sectional studies, as they would not be able to account for or make adjustments to student entrance characteristics, for example (FITZ-GIBBON6, 1996; GOLDSTEIN, 1997). The second condition requires the use of a multilevel regression model to investigate the “differential effectiveness” of schools and/or teachers. The model must take into account the fact that students are grouped in certain schools and classrooms and are, therefore, subject to the specific influences of that school or classroom/group. Goldstein (1997) has even suggested that replication occurs in time and space7 and the researcher should present a plausible theory to explain the results obtained.
Vendell’s bibliographic review (2004) of the impact of different forms and quality of early childhood care on the development and educational trajectory of children, indicates how recent studies have approached these minimal conditions. The first correlational studies, carried out in the 1980s, avoided selection bias by controlling some demographic characteristics of children and their families. More recent studies have incorporated a larger number of covariates; some have minimized the risk associated to omitted or unmeasured variables by using measures of the children’s prior performance as controls or models to estimate gains (delta).
NICHD ECCRN and Duncan (2003) conducted a methodological exercise to illustrate the limits of correlational studies, especially the risk of selection bias. Their research used data from the National Institute of Child Health and Human Development (NICHD)’s longitudinal “Study of Early Child Care,”8 conducted in the United States. The objective of the exercise carried out by NICHD ECCRN and Duncan (2003) was to observe the impact of school-attendance quality9 in early childhood on the cognitive and language performance of children at 24 and 54 months of age, using several models. The findings showed that a lack of adequate controls could generate exaggerated estimates or overestimated parameters.
The regression models for estimating children’s cognitive and language scores at 54 months initially used only variables related to the type, quality, and quantity of early childhood care. Over time, they gradually added covariates related to the children’s characteristics and their families. The results show a decrease in the estimated coefficients for the quality of care, as controls were inserted in relation to the children’s characteristics and family environments. However, the more extensive family controls added to later models, do not seem to alter the quality-of-care coefficients obtained. The same estimation exercise was carried out in various models, using as a control variable the children’s results at 24 months and, later, using as a dependent variable the children’s gains between 24 and 54 months. In models that controlled for previous performance and family characteristics, the coefficients decreased even more, in comparison to models without this control. In the models that showed gains (delta) between 24 and 54 months, the insertion of family controls decreased the estimated quality-of-care coefficients to the point where they were no longer statistically significant (NICHD ECCRN; DUNCAN, 2003).
More recent studies, with longitudinal designs, large samples, low sample mortality, controls for the characteristics of children and families, and/or multilevel models, have focused on the impact of the type of care (public, private, or offering other types of service), the quality of the structure (e.g., teacher training, care period, adult-child ratio) and classroom processes (including interactions, the instructional climate, and pedagogical practices10) on the development of children in various dimensions.
In measuring the quality of the care process, the results of several studies seem to converge. For example, analyses of the results using data collected by the Effective Pre-School and Primary Education (EPPE)11 project in the United Kingdom observed that the quality of preschool care has a small (effect sizes ranging from 0.11 to 0.20) but statistically significant impact12 on the cognitive and social-behavioral progress of children (SYLVA et al., 2010; SYLVA et al., 2006). The models used pre-test controls (performance or scores of children’s ability at preschool entrance) and the children’s and families’ characteristics, and home learning environment. In addition, the study observed lasting impacts, mainly from attending a high-quality preschool, on children’s results in primary education (SAMMONS, 2006; SYLVA et al., 2010).
Similarly, Peisner-Feinberg et al. (2001) observed a small association in the same direction (effect sizes of 0.03 to 0.18), between the quality of the preschool care process13 and the development of children’s language, reading, and mathematics skills, as well as14 a moderate association in the same direction for sociability and attention. Studies conducted within the NICHD project found that the quality of early childhood care was modestly associated (effect size between 0.10 and 0.11) with children’s academic and language outcomes at 54 months (NICHD, 2006). Both studies used several controls related to characteristics of children and their families. Howes et al. (2008) observed an association between children’s development of language, literacy, math, and socio-behavioral skills in the short term, during preschool (prekindergarten programs) and the quality of classroom processes and school structures.15 The study estimated hierarchical models, which used not only a pre-test control variable, but also the children’s short term cognitive gains as a dependent variable. Morover, the analyses considered many controls related to children and their families and the results obtained revealed gains in language, reading and social behavior, especially in programs with higher process quality. The authors observed similar results in analyses of gains that used a pre-test as a covariate16; however, the coefficients/parameters obtained in the gain (delta) models brought smaller or more conservative estimates (effect sizes ranging from 0.06 to 0.13) for the effects of preschool quality on language and reading than models that used previous performance as a covariate (effect sizes ranging from 0.06 to 0.19). The same trend was observed when using models that estimated progress in mathematics and children’s social-behavior skills.
If the results of studies with robust designs that examined the relationship between the quality of the early childhood-care process (adult-child interaction, instructional climate, and pedagogical practices) - measured using various observational instruments - and cognitive development in children’s language, mathematical skills, and social behavior seem to converge, the same trend cannot be observed in studies that focus on the quality of the care structure (e.g., teacher training, attendance time, the adult-child ratio, and building characteristics). For example, in assessing quantity of care, the results of the studies carried out by NICHD (2006) revealed a non-expected impact on the behavior of children who attended preschool for longer hours. In the UK, the EPPE project did not observe an impact of full-time attendance (SYLVA et al., 2010); the Early Childhood Longitudinal Study, carried out in the U.S. with kindergarten children (5-year-olds), observed greater progress in language and mathematics among children who attended full-time programs than those who attended part-time programs (WALSTON; WEST, 2004).
In the area of teacher training, the EPPE project observed that preschool care delivered by more qualified staff had higher process quality; in such establishments, the children made more progress (SYLVA et al., 2010). Howes et al. (2008) observed positive and statistically significant correlations between teacher qualifications, the period of care and children’s language and reading development. However, when covariates related to children’s characteristics and process quality were introduced, variables related to the quality of the care structure lost statistical significance.
In Brazil, the discussion about evaluating and setting goals for early childhood education has revolved around access and the quality of the care structure. The National Education Plan provides crèche and preschool access targets, as previously mentioned. The first proposal produced by the National System of Evaluation of Basic Education17 (Sinaeb) to carry out a National Assessment of Infant Education (Anei) focused on conditions such as “physical infrastructure, staffing, management, pedagogical resources, and accessibility, among other relevant contextual indicators” (BRASIL, 2016). The proposal for evaluating early childhood education in the new Basic Education Assessment System (Saeb) is still under development. However, preliminary information indicates that the evaluation will not include results derived from cognitive tests; data will be collected through questionnaires distributed to teachers, principals, and leaders (BRASIL, 2018). Considering the limitations of data collection through questionnaires (FRANCO et al., 2003), this assessment of early childhood education is unlikely to adequately or accurately capture or measure classroom and/or child development processes. Even with the recent expansion of access and discussions about the parameters for evaluating early childhood education, the impact of quality of care on children’s development has not been studied in a systematic way.
A few studies have focused on the possible effects of crèche and/or preschool on educational results and trajectories. For example, a study by Damiani et al. (2011) observed that children who attended preschool tended to have longer educational trajectories. Campos et al. (2011b) investigated the relationship (in three Brazilian capitals) between the quality of the preschool process (measured using the Ecers-R scale) on outcomes for Portuguese language learners in the second year of elementary school (measured by Provinha Brasil). The data indicated that children who attended institutions with good process quality performed better on the test than children who did not attend preschool or who did so in institutions with unsatisfactory quality levels (CAMPOS et al., 2011b). However, the study did not have a longitudinal design; it used a cross-classified hierarchical model to estimate the performance of children assessed by Provinha Brasil, without controlling for family characteristics, elementary schools attended, and most importantly, the children’s previous development. The analyses had limitations to avoid selection bias. In addition, the internal validity was greatly affected by the large sample attrition.
STUDY DESIGN AND DATA COLLECTION
In the present study, we were initially interested in investigating the impact of a recent program aimed at early childhood education, called “Child Development Center” (EDI). It has been implemented gradually since 2010 by the Rio de Janeiro Municipal Department of Education. The program created a difference in the quality of the care structure for early childhood education, since the EDIs had the following characteristics, which distinguished them from regular early childhood-care schools: “a combination of crèche and preschool, primary care spaces, infant libraries and full-time care” (RIO DE JANEIRO, 2010). New schools were built with a specific architecture and adequate spaces to serve this stage of basic education.
The principal objective of the present study is to observe the impact of attending EDIs (as opposed to regular schools) on the cognitive development of children in the first year of preschool. We emphasize that, as the study sample includes only municipal public schools and regularly enrolled students, it can only verify the impact of attending different types of care in the public system. It cannot compare care in public and private schools or observe the effects on those who did or did not attend preschool.18 To address the study question, we estimated several hierarchical regression models, which gradually incorporated variables related to attending EDIs, children’s characteristics, their family background, and measurements of their cognitive development at the beginning of preschool.
The data were collected by the study “Baseline Brazil” (Linha de Base Brasil - LBB), a large-scale longitudinal study on the effects of preschool and the first year of elementary school, which aims to follow children from 4 to 7 years of age. The study selected a random probabilistic sample of 46 schools (approximately 2,700 children) from the municipal system of Rio de Janeiro, stratified by type of service offered and Regional Education Coordinating Unit.19 Specifically, in the municipal public system of Rio de Janeiro, the study considered two types of schools: A) EDIs - established in accordance with the principal public policy for early childhood education in the city; B) regular schools offering early childhood education only or preschool and elementary school classes.
Figure 1 shows the different stages of data collection. The two waves of collection in March and November/December 2017 were carried out when the children were 4/5 years of age, at the beginning and end of the school year.
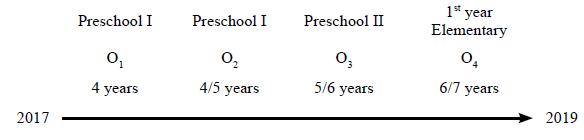
In each wave, we collected data on the children’s cognitive development and their fine and gross motor skills. The cognitive data were collected using Performance Indicators in Primary Schools (Pips), an accurate tool that has been tested for 20 years in the UK and other countries. It creates20 a baseline measure at the beginning of the compulsory schooling process to monitor the children’s development.21 Pips consists of the following dimensions: A) Writing; B) Vocabulary; C) Ideas about reading - evaluating concepts about print; C) Phonological awareness; D) Letter identification; E) Words recognition and reading; F) Ideas about mathematics; G) Counting and numbers; H) Addition and subtraction without symbols; I) Identification of forms; and J) Identification of numbers. Language and mathematics scores were estimated using items on the Pips cognitive test, via the Rasch model (Boone, 2006; Bond and Fox, 2015) and Winsteps software. The present study removed the items that involved reading phrases at the time of calculation because only a very few children (around 1.0% of the sample) in the first year of pre-school are exposed to this section of the test.
The test was applied individually; the duration varied between 10 and 20 minutes. In Brazil, the test was applied using booklet (with images and text positioned in front of the child); and a test application version that runs on a tablet and guides the researcher on items to be presented. The application is adjusted in accordance with the child’s responses. The procedure continues when consecutive, correct answers are given; it is interrupted when the child demonstrates a lack of knowledge of particular content. Each test session presents increasingly difficult items, allowing the test to have the minimum desired duration, without leaving the child bored by many simple or overly difficult questions (TYMMS; MERREL; JONES, 2004).
Table 1 shows the initial number of sampled children in Wave 1 of the study, mobility during the first year of the longitudinal study, and attrition between Waves 1 and 2 (at the beginning and end of 2017):
TABLE 1 - Description of number of cases in Wave 1 and Wave 2 and attrition
| NUMBER OF CASES | PERCENTAGE | |
|---|---|---|
| SME children in the 1st wave | 2,716 | 100.00% |
| SME children in the 2nd wave | 2,848 | - |
| Not found in the system | 106 | 3.9% |
| Migrated to other Municipal Department of Education (SME) schools | 164 | 6.0% |
| Students in the sample schools in the 2nd wave | 2,446 | 90.1 % |
| Total children measured twice | 2,237 | 82.4% |
Source: Compiled by the authors.
Approximately 4% of the children were missing from the Academic Management System (Sistema de Gestão Acadêmico - SGA). Our team had access to this system which allowed us to observe the entire trajectory of children within the municipal public schools. The missing children had moved out of the city or migrated to the private schools. These were difficult situations because there was no information in the SGA on their new schools. However, our most substantial loss involved children who migrated to other schools (which were not sample schools) in the Municipal Department of Education of the Municipality of Rio de Janeiro (SME-RJ) and children who remained in the same schools but missed classes on a recurring basis. We observed that 90.1% of the children who participated in the 1st wave were still enrolled in the schools of the study sample. However, only 82.4% of the same total participated in the 2nd wave. Our team made multiple visits to the same schools and still had difficulty finding some children. Student absenteeism was not an initial focus of the study, but it caught the attention of researchers and required adjustments to the data collection strategies. The attrition reported in the study (17.5%) is considered low to moderate.
In addition to the Pips cognitive tool, the study also collected contextual data from the children (a questionnaire completed by parents/guardians)22 and schools. We have collected contextual information using the questionnaires from approximately 62% of the guardians of children in the sample. To minimize the loss of cases, missing data were complemented with data provided by the SGA of the Municipal Department of Education. Therefore, the estimated hierarchical models only used variables present in both databases to minimize the amount of missing data and to maximize the total number of children.
When we began the descriptive analyses of the distribution of classes and children among sample schools, we observed a variation in the program implementation, given the guidelines provided by the Municipal Department of Education. For example, while not all EDI classrooms were full-time, some regular schools (not EDIs) also offered full-time provision. Likewise, not all EDIs operated in new buildings, built specifically to serve early childhood education.
TABLE 2 Distribution of schools and classrooms according to the type of service offered (EDI and non-EDI); care period (full-time and part-time)
| TOTAL | FULL-TIME | NEW BUILDING | ||||
| EDI | NON EDI | EDI | NON EDI | EDI | NON EDI | |
| School | 19 | 27 | - | - | 10 | 2 |
| Classroom | 73 | 43 | 20 | 13 | 42 | 3 |
| Children measured twice | 1,309 | 928 | 394 | 263 | 716 | 63 |
Source: Compiled by the authors, based on data from SGA and LBB research.
This variation led us to carry out other analyses, not just observing the impact of attending an EDI school, but also observing the impact of attending an EDI that strictly followed the program guidelines in the program (full time and/or a new building). It is interesting to note that, although there are only 19 EDI schools, these schools offer more pre-school classrooms than regular schools. Finally, we observed a differentiated service provision within the same EDI: full-time and part-time classes.
ANALYSIS, RESULTS, AND DISCUSSION
Table 3 describes the variables and the data sources used in the analyses; Table 4 presents descriptive statistics based on those variables.
TABLE 3 Description of the variables used in the analyses
| NAME | TYPE | DESCRIPTION | SOURCE | |
|---|---|---|---|---|
| DEPENDENT VARIABLE | ||||
| Lang2 | Continuous | Measure of language in Wave 2 | LBB Project | |
| EXPLANATORY VARIABLES LEVEL 2 - SCHOOL/CLASSROOM | ||||
| EDI | Dummy | Indicates whether the school is an EDI or a regular network school | SME | |
| Full-time EDI | Dummy | Indicates whether the classroom is in an EDI is fulltime (1 = full-time EDI, 0 = other classrooms) | SME | |
| Proportion of high-school educated parents | Continuous | Proportion of children with at least one parent/ guardian with a high-school and/or higher level education | SGA/SME and LBB | |
| Proportion non-white | Continuous | Proportion of non-white children | SME | |
| Proportion in poverty | Continuous | Proportion of children whose parents are beneficiaries of cash transfer programs | SGA/SME and LBB | |
| EXPLANATORY VARIABLES - LEVEL 1 - CHILD | ||||
| Lang1 | Continuous | Measure of language in Wave 1 | LBB | |
| Special needs | Dummy | Indicates if child has special educational needs (0 = no; 1 = yes) | LBB | |
| Gender | Dummy | Indicates the gender of the child (0 = girl; 1 = boy) | SGA/SME | |
| Poverty | Dummy | Indicates whether parents/guardians of the child are beneficiaries of cash transfer programs (0 = no; 1 = yes) | SGA/SME and LBB | |
| High-school Educated Parents | Dummy | Indicates whether at least one parent/guardian of the child has completed high school and/or higher level education (0 = no; 1 = yes) | SGA/SME and LBB | |
| Non-white | Dummy | Indicates the color of the child (declared by parents/guardians) (0 = white; 1 = not white) | SGA/SME | |
| Age | Continuous | Indicates the child’s age in months | SGA/SME | |
Source: Compiled by the authors.
TABLE 4 Descriptive statistics of the variables used in the analyses
| VARIABLE | N | MEAN | STANDARD DEVIATION | |
|---|---|---|---|---|
| CHILDREN VARIABLES | ||||
| Lang2 | 2,237 | 0.25 | 1.00 | |
| Lang1 | 2,237 | -0.35 | 0.89 | |
| Special needs | 2,237 | 0.02 | - | |
| Gender | 2,237 | 0.52 | - | |
| Poverty | 2,237 | 0.31 | - | |
| High-school Educated Parents | 1,809 | 0.57 | - | |
| Non-white | 2,125 | 0.63 | - | |
| Age | 2,226 | 54.28 | 4.03 | |
| SCHOOL/CLASS VARIABLES | ||||
| EDI (school) | 46 | 0.41 | - | |
| Proportion with high-school education | 46 | 0.45 | 0.15 | |
| Proportion non-white (school) | 46 | 0.59 | 0.14 | |
| Proportion in poverty (school) | 46 | 0.31 | 0.14 | |
| Full-time EDI (class) | 116 | 0.17 | - | |
| Proportion High-school Educated Parents (class) | 116 | 0.43 | 0.19 | |
| Proportion non-white (class) | 116 | 0.60 | 0.13 | |
| Proportion poverty (class) | 116 | 0.25 | 0.17 | |
Source: Compiled by the authors based on data from SGA and LBB research.
Table 5 reveals a small difference between the profiles of children attending EDIs and those attending regular schools. We observed that a higher proportion of children in EDIs (60%), had parents who had completed high school, than did those who attended regular schools (53%); there was a higher proportion of non-white children in regular schools (66%) than in EDIs (62%). The language starting point of children at EDIs was also slightly higher. A similar pattern, slightly more pronounced, was observed when children who attended EDIs full-time were compared to children who attended other schools/classes in the sample.
TABLE 5 Mean of the child-level variables according to type of provision and care period
| VARIABLE | EDI (SCHOOL) | NON-EDI (SCHOOL) | FULL TIME EDI (CLASSROOM) | NOT FULL- TIME EDI (CLASSROOM) |
|---|---|---|---|---|
| CHILDREN’S VARIABLES (MEAN) | ||||
| Lang2 | 0.30 | 0.20 | 0.34 | 0.21 |
| Lang1 | -0.33 | -0.38 | -0.25 | -0.38 |
| Special needs | 0.02 | 0.02 | 0.03 | 0.02 |
| Gender | 0.51 | 0.52 | 0.51 | 0.53 |
| Poverty | 0.31 | 0.31 | 0.27 | 0.35 |
| High-school Educated Parents | 0.60 | 0.53 | 0.62 | 0.55 |
| Non-white | 0.62 | 0.66 | 0.56 | 0.65 |
| Age | 54.17 | 54.38 | 53.9 | 54.4 |
Source: Compiled by the authors based on data from SGA and LBB research.
One of the aims of this study was to understand the pattern of attrition. Table 6 presents the language and mathematical measures for children who participated only in Wave 1, as well as for those who participated in the two waves of data collection. The mean and standard deviations were calculated using Wave 1 measurements to observe whether the group that participated in two waves was similar to the group that only participated in Wave 1:
TABLE 6 Wave-1 Measurements: children who participated only in Wave 1 and children measured twice23
| LANGUAGE WAVE 1* | MATHEMATICS WAVE 1 | |||
|---|---|---|---|---|
| MEAN | STANDARD DEVIATION | MEAN | STANDARD DEVIATION | |
| Children who participated only in Wave 1 | -0.53 | 1.00 | -1.76 | 1.37 |
| Children measured twice (Waves 1 and 2) | -0.39 | 1.01 | -1.54 | 1.36 |
Source: Compiled by the authors.
*The T-test for equality of means indicates that the language-related difference in means between the two groups was statistically significant (p < 0.01).
The data suggest that there is a small, statistically significant, difference between the two groups, with a pattern indicating that the group that participated in both waves had a higher mean starting point. One possible explanation is that the present study lost children who were no longer in school and who were therefore less likely to participate in the two research waves. The initial descriptive analysis did not allow us to rule out the risk of bias in the study’s attrition.
Another source of attrition in the study was the difficulty encountered when trying to find parents or guardians at the school. Many of the children were privately driven to school or went with an older sibling. We were able to distribute the questionnaire to 62% of the guardians and to use the SGA data to complete part of the missing information on key family characteristics. Table 7 presents the mean and standard deviation for Wave 1 data, comparing children with and without information on their parents’ education. A preliminary analysis of the data suggests that loss had a pattern. Children who lacked information about their parents’ education had a lower starting point (Wave 1). The data suggest that the loss of information about family characteristics was probably not random; it could affect the estimates of hierarchical models. However, the difference in the observed means was not statistically significant.
TABLE 7 Language and mathematical measures for wave 1 for children with and without information on their parents’ education
| LANGUAGE WAVE 1* | MATHEMATICS WAVE 1* | |||
|---|---|---|---|---|
| MEAN | STANDARD DEVIATION | MEAN | STANDARD DEVIATION | |
| Children with information on parents’ education | -0.40 | 1.00 | -1.55 | 1.35 |
| Children with no information on parents’ education | -0.48 | 1.00 | -1.67 | 1.40 |
Source: Compiled by the authors.
*T test for equality of means indicates that the difference between the two groups is not statistically significant (p > 0.05).
We, initially, performed a descriptive analyses of the progress in language and mathematics made by children attending pre-school in EDIs and in regular schools within the municipal public system. We also carried out descriptive analyses, considering the variations observed in the implementation of the program (EDIs offered both full-time and part-time classes; some were housed in new buildings and others in old buildings, adapted to receive the program or not). We then, in order to make inferential analysis, we used hierarchical linear regression models estimating the development of children in Wave 2. We gradually inserted controls related to the children’s attendance at EDIs, the composition of schools/classrooms, the children’s characteristics, their family background, and cognitive measurements from Wave 1 (entry into pre-school).
Source: Compiled by the authors.
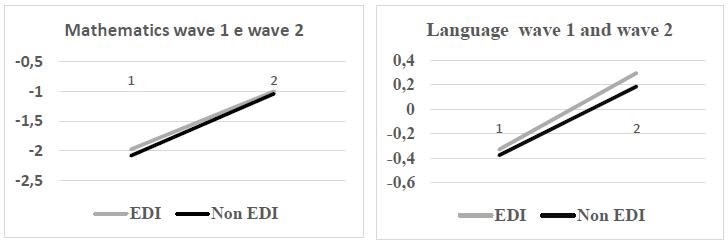
GRAPHS 1 and 2 Mean mathematics and language measures for waves 1 and 2 for EDIs and regular schools
Source: Compiled by the authors.
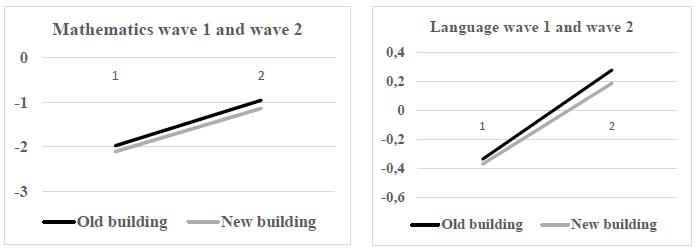
GRAPHS 3 and 4 Mean mathematics and language measures for waves 1 and 2 for children in EDIs, new and buildings
Source: Compiled by the authors.
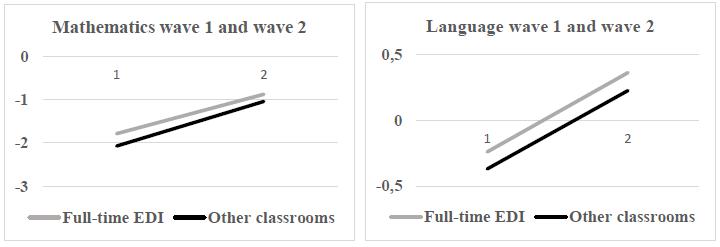
GRAPHS 5 and 6 - Mean mathematics and language measures for waves 1 and 2 for children who attended full-time classrooms in EDIs and in other classrooms
As noted in the previous graphs, children attending EDIs appeared to have made slightly greater progress in language than those attending regular pre-schools (Graph 2). However, progress in math seems similar, with a small advantage for children who attended regular schools (Graph 1). Graphs 3 and 4 also present analyses by school and suggest that children attending pre-schools in new buildings had, on average, slightly reduced development in language and mathematics, in comparison to their peers who attended municipal pre-schools in old buildings.
Graphs 5 and 6 present analyses at a class level of the services offered to children attending a full-time class at an EDI, in comparison to other offerings: part-time EDI, full-time at a regular pre-school, and part-time at a regular pre-school. The idea was to see whether there was an effect associated with attending pre-school that met the key policy requirements.
From the trends observed in the graphs, two-level linear hierarchical regression models were used to estimate only the language measure for children in Wave 2 (November/December 2017). The aim was to verify whether the impact of the EDIs was observed even after controls were included that related to pupil composition, the children’s characteristics and families, and children’s development in language Wave 1. The first level refers to children and the second level to schools.
Five models were estimated using the following specifications:
Model 1:
In the first model, we only inserted the variable indicating whether the school was an EDI or a regular school.
Model 2:
In the second model, we added, in Level 2 (school) variables related to the proportion of children whose parents had completed secondary or higher education; the proportion of non-white children; and the proportion of children in a situation of poverty (part of a cash-transfer program).
Model 3:
Model 3 added variables related to the children (special needs, gender, color, and age) and their families (whether parents had completed high school and/or higher education; whether they were part of a cash-transfer program).
Model 4 added Level 1 controls related to the child’s level of development in Wave 1 (Lang 1); Model 5 was equivalent to Model 4, however, Level 1 had no controls for the child’s color or parents’ education. This leaner model was estimated when insertion of two variables implied a loss of 428 children (approximately 20% of the sample).
Table 8 presents the results of parameters obtained from models with different effect sizes. Effect sizes are simple ways to report differences between two groups, rather than just discussing statistical significance. There is an extensive debate on how to interpret effect sizes (Hattie, 2009; Higgins, Kokotsaky, and Coe, 2012). We chose to use the classification present in Higgins, Kokotsaky, and Coe (2012): (i) effect sizes up to 0.18 are considered small; (ii) from 0.19 to 0.44 moderate; (iii) from 0.45 to 0.62 high; and (iv) greater than 0.70 are very high.24 The effect sizes were calculated according to the methodology developed by Tymms (2004) and Tymms, Merrell, and Handerson (1997).25
TABLE 8 Linear hierarchical regression models estimating language measures in Wave 2 (effect sizes)
| MODEL 1 | MODEL 2 | MODEL 3 | MODEL 4 | MODEL 5 | |
|---|---|---|---|---|---|
| SCHOOL (Level 2) | |||||
| EDI | 0.126* | 0.071 | 0.095 | 0.113 | 0.097 |
| Proportion of high-school educated parents | 0.150* | -0.027 | 0.006 | 0.123 | |
| Proportion non-white | 0.069 | 0.074 | 0.078 | 0.083 | |
| Proportion in poverty | -0.209** | -0.213** | -0.297*** | -0.272*** | |
| CHILD (Level 1) | |||||
| Language - Wave 1 | 1.833*** | 1.909*** | |||
| Special needs | -1.140*** | -0.737*** | -0.532*** | ||
| Gender | -0.123*** | -0.011 | -0.034 | ||
| Poverty | -0.111** | -0.037 | -0.054 | ||
| High-school Educated Parents | 0.372*** | 0.189*** | |||
| Non-white | -0.064 | -0.024 | |||
| Age | 0.672*** | 0.297*** | 0.240*** | ||
| Explained variation | |||||
| Level 1 | 0 | 0 | 14.6 | 49.5 | 50.0 |
| Level 2 | 4.4 | 19.5 | 16.9 | 51.2 | 59.4 |
| Null model | |||||
| r0 | 0.041 | ||||
| E | 0.754 | ||||
| ICC | 5.2 | ||||
Source: Compiled by the authors.
Note: * p < 0.10, ** p < 0.05, *** p 0.01.
In Table 8, the estimated coefficients for children frequenting EDIs are positive (effect size of 0.113 in model 4).26 However, the values are not statistically significant for the 46 schools sampled in the study.
The first point to note is that only 5.2% of the variance is explained at Level 2 of the model, which suggests that, at the end of the first year of preschool, most observed differences could be explained at Level 1 of the model (child). These results will be explored in more depth in another study that uses a regression discontinuity design to analyze the overall impact of attending preschool in the municipal public system.
Model 3 presents results (commonly reported in educational research in Brazil and abroad) used to identify factors associated with child development. There is, however, an important limitation in the model, namely: the absence of an initial measure of the development of the child. The comparison of the coefficients of Models 3 and 4 highlights exactly the importance of using longitudinal designs to estimate the effect of educational policies and programs. The introduction of the baseline (Wave 1 language) significantly alters both the explanatory power of the model (the proportion of variance explained in Level 1 increases by 339%) and the coefficients of the other covariates. All lost explanatory power and some items, such as gender and poverty, cease to be statistically significant.
Also noteworthy is the great impact of age on the model. Even controlling for the baseline measure (Wave 1), age has an effect size of 0.297. This result can be explained by the so-called maturation effect, which tends to be larger in young children. This result has been little debated or explored by academics, principals, pedagogical coordinators, and teachers who work in the schools. Our study suggests that the child’s birth month is a key variable for estimating the starting and ending point of children cognitive development at the first year of preschool. This information should be taken into account by early childhood education teachers and teachers in the early years of elementary school, when making decisions about children who need special attention and about a child’s failure (specifically in elementary school).
The next table also present the results of two-level hierarchal linear regressions. In this case, however, the first level refers to children and the second to classrooms. This second set of analyses allows us to discern a possible policy effect by identifying children in full-time EDI classrooms (format stipulated in the SME-RJ documents). This model has another advantage, which is the number of analysis units (classrooms) at the second level - a total of 116.
TABLE 9 Hierarchical linear models estimating language measure in Wave 2 (effect sizes)
| MODELO 1 | MODELO 2 | MODELO 3 | MODELO 4 | MODELO 5 | |
|---|---|---|---|---|---|
| CLASS | |||||
| Full-time EDI | 0.161* | 0.118 | 0.125 | 0.077 | 0.069 |
| Proportion with High-school Educated Parents | 0.011 | 0.013 | -0.072 | -0.051 | |
| Proportion non-white | -0.143* | -0.145* | -0.181** | -0.169** | |
| Proportion in poverty | -0.116* | -0.08 | -0.036 | -0.032 | |
| CHILD | |||||
| Language - Wave 1 | 1.837*** | 1.858*** | |||
| Special needs | -1.128*** | -0.807*** | -0.657*** | ||
| Gender | -0.117** | -0.006 | -0.021 | ||
| Poverty | -0.088* | -0.052 | -0.078* | ||
| High-school Educated parents | 0.382*** | 0.206*** | |||
| Non-white | -0.022 | -0.024 | |||
| Age | 0.648*** | 0.283*** | 0.218*** | ||
| Explained variation | |||||
| Level 1 | 0 | 0 | 11.6 | 47.8 | 47.3 |
| Level 2 | 3.7 | 9.4 | 38.2 | 52.9 | 55.8 |
| Null model | |||||
| r0 | 0.058 | ||||
| e | 0.727 | ||||
| ICC | 7.4 | ||||
Source: Compiled by the authors.
Note: * p < 0.10, ** p < 0.05, *** p 0.01.
The proportion of explained variance at Level 2 (classroom) is 7.4%. This is greater than the variance observed in Table 8, but still small when compared with other studies that have analyzed the effect of the school and teacher on children’s learning. Model 1 shows only one variable at Level 2, frequenting EDI; it reveals a difference between the means of the two groups: children who attended full-time classes at an EDI and those who attended part-time classes at EDIs or attended regular schools (effect size of 0.16). The question is whether this difference will remain as we introduce control variables. In general terms, the results are consistent with those presented in the set of analyses on Table 8 (child-and-school hierarchical model). The introduction of covariates is associated to a decrease in the coefficients that referred to attending full-time EDI classes. Those become statistically insignificant.
For example, in Model 4, the coefficient for the frequency of EDI (full-time class) remained positive (effect size of 0.08); however, it was not statistically significant.
The analyses presented in this study explain approximately 50% of the variation in Levels 1 and 2. These values are higher than is usually observed in studies of school effectiveness in Brazil. The use of a robust measure at the individual/child-level and longitudinal design greatly increase our ability to explain the variance; it also strengthens our confidence that the presented results have not overestimated the effect of the evaluated program. Models with specification errors or incorrect measures of proficiency can generate inconsistent results; they also tend to inflate the effect of the covariates present in the models.
LIMITS AND FINAL CONSIDERATIONS
The present paper presented preliminary analyses of an ongoing longitudinal study carried out in Rio de Janeiro’s municipal public system. The research design allowed us to estimate the impact of different programs, aimed at the development of children between the ages of 4 and 7. The study has made an unprecedented contribution to the field of school effectiveness in the Brazilian context. It has included in its analyses both controls related to the characteristics of children and their families (models most commonly observed in studies of school effectiveness in Brazil that use cross-sectional data from educational-assessment systems) and measures of the development of children throughout preschool.
The results presented in this paper suggest that the main policy underpinning early childhood education in Rio de Janeiro’s municipal public system has no clear effect on the cognitive development of children, at least in the short term. This absence of an observed effect could be due to problems with implementing the program. There has been a significant increase in the number of EDIs in the municipal public system since 2010. However, some of the new EDIs operate in old buildings, without the adaptations initially stipulated by program documents. Many also only offer part-time classes. In the child-classroom model, however, analyses considered only classrooms that were closer to full implementation; even so, we did not observe an effect of the program.
Graphs 1, 2, 5, and 6 suggest that the starting point for children attending EDIs or full-time EDI classes is higher. The most qualified services were first offered to children with a higher initial level of development. There are several hypotheses to explain this result. It is possible to think about a process of self-selection of families or even a differentiation of work of the crèches operating in EDIs.
However, some points deserve to be highlighted. The coefficient obtained for attending an EDI in the model with full controls (Table 8, Model 4) is equivalent to 0.113 (effect size). Although not statistically significant, an effect of this size is considered small but pedagogically relevant (HIGGINS; KOKOTSAKY; COE, 2012). This leads us to believe that, with a larger sample of schools, we might observe a small effect, not negligible in pedagogical terms, and statistically significant.
In addition, it is necessary to reinforce that we analyzed data from the first year of preschool only. The study will continue collecting data on the development of the children. It is possible that, during the next waves of data collection, the results will change. The sleeper effect, a phenomenon of delayed observation of the effect of early childhood education programs, documented in different studies, cannot be ruled out (ANDERSON, 1989; PEISNER- FEINBERG et al., 2001).
The present study has not analyzed the impact of preschools that also provide crèche - or their effect on the children who attend them. This last absence is justified by the limitations of the available data. In the present study, to obtain information about crèche attendance, we used the data from the Department SGA. This allowed us to identify only those who attended a crèche in the municipal system of Rio de Janeiro; it did not allow us to identify children who had attended crèche in the private sector or other systems. At the moment, we are still collecting data from the parent questionnaires, which will allow us to obtain more accurate information on crèche attendance for future analyses.
This longitudinal study does have limitations. Attrition and other problems that generate loss of information are always a threat to this type of design and should be analyzed carefully. Preliminary descriptive analyses suggest that loss in the study was not random and may alter reported results. Subsequent studies will analyze in depth the sample loss and its possible effects on the reported outcomes. However, it should be noted that a 17% attrition is considered from low to moderate, when compared to most studies in the educational field.
The preliminary results of the longitudinal study reinforce the urgent need to open a broader debate on the quality of early childhood education, not limiting discussions to the school input. New buildings, more time spent in school and investment in new school equipment are fair demands from families and school professionals and the basic care structure is not yet a reality for many educational systems. However, the supply of new and adapted buildings and the extended day do not guarantee greater learning among children, at least not in the context of the educational system studied. The results corroborate the main findings of various international studies with robust designs on the impact of programs focused on infrastructure and time spent in school. The present study is still ongoing; the next steps will include collecting information about in-classroom pedagogical processes and interactions between teachers and children. This information will soon be incorporated into the model to illuminate other aspects of school processes that can help us explain the factors that drive children’s learning.
Finally, the study presents direct ways of measuring the development of children. In Brazil and other countries, there is resistance to this type of strategy. Opponents worry about the risk of children being labeled and tests that can negatively change the curriculum. Here is one fundamental consideration: we should not confuse the data collected with its later use. Several areas of intervention make this distinction clearly; they recognize the need to carry out impact assessments on different programs. In particular, fear should not be a barrier to the expansion of longitudinal studies or other robust designs that seek to estimate the effects of programs aimed at early childhood education. They will be well positioned to support future policies designed to promote the quality of this educational stage in the Brazilian context.

