


 texto em
  Inglês (pdf)
 Artigo em XML
 Enviar este artigo por email
 Permalink
INTRODUCTION
A major challenge in selecting candidates through a university admission test is to answer the question: To what extent is a candidate’s score reflecting his or her skills and knowledge, especially in an interdisciplinary test that encompasses the entire content of basic education?
Many large-scale assessments have a reference framework by knowledge area, as well as pedagogical interpretations of the score scale, such as the Basic Education Assessment System (Saeb). In Saeb, for both Portuguese and Mathematics, it is possible to determine, for each segment of the score scale, which skills the student probably masters. That scale is presented for the 5th and 9th grades of primary education and for the 3rd grade of secondary education (BRASIL, 2015).
To build such a scale, first it is necessary to determine whether it is reasonable to summarize the student’s skills and knowledge into a single number - his/her overall score. The National High School Exam (Enem) itself currently has a reference framework for each of the four areas assessed by objective tests (BRASIL, 2015), but in order to classify candidates, universities usually use the arithmetic mean of five scores: four for the objective tests and one for the composition. However, there are formally no studies that examine the properties of that resulting measure, except for a few papers such as Vieira (2016) and Gomes (2018).
The internal consistency and the dimensionality of interdisciplinary tests administered in Brazil were approached by some authors, among which are Quaresma (2014), who studied the Fuvest admission exam’s first phase test, and Coelho (2014), who analyzed the National Assessment of Student Achievement (Enade) in the area of S tatistics, but neither attempted to build a scale with pedagogical interpretation for these tests.
Based on the 2011 edition of the admission test for the Universidade Estadual Paulista “Júlio de Mesquita Filho” (Unesp), Barbetta et al. (2014) showed that the results of the general knowledge test are well represented by a three-dimensional latent feature; however, they also indicated that it was reasonable to make a dimensionality reduction, thereby simplifying it into a single dimension, i.e., each candidate could have a single score which depicted the composition of skills that he/she mastered. In this paper, that study is expanded for several editions of the Unesp admission test (2011-2014) to provide a more elaborate analysis of dimensionality and complete the interpretation of the scale.
As Pasquali (2003) points out, dimensionality should be considered a matter of degree, since human performance is multidetermined and multi-motivated. Thus, it is reasonable to wonder how well the overall proficiency measured by the test can satisfactorily represent a more complex construct involving several underlying factors. Reckase (2009) argues that the use of Item Response Theory (IRT) for multidimensional data can generate a summarized measure of an individual’s various abilities.
The present study aims, in a way, to evaluate the validity of Unesp admission tests. The validity of a test (exam) corresponds to the degree to which evidence and theory support interpretations of the scores produced by the test, considering its purposes (AMERICAN EDUCATIONAL RESEARCH ASSOCIATION; AMERICAN PSYCHOLOGICAL ASSOCIATION; NATIONAL COUNCIL ON MEASUREMENT IN EDUCATION, 2014, p. 11). Content evidence is present in the Unesp general knowledge test, since items therein are designed and evaluated according to the national curriculum guidelines for secondary education (BRASIL, 2013), the national curriculum parameters for secondary education (BRASIL, 2000) and the curriculum in the state of São Paulo (SÃO PAULO, 2011a, 2011b, 2011c, 2011d). This paper presents a proficiency scale interpreted based on the placement of test items and descriptors according to the skills and competencies referred to in the publications above.
The main source of validity in this study is the test’s internal structure. Analyzing this internal structure can indicate the degree to which the relationships between the test items agree with the construct in question. This structure is analyzed by indices based on classical test theory (CTT), dimensionality analysis and the interpretation of factors obtained by factor analysis.
This article presents the General Knowledge test for admission into Unesp, describes the adopted methods, analyzes the tests through CTT and IRT, proposes a pedagogical interpretation of the measurement obtained through IRT, and analyzes the 2014 test’s dimensionality, including a factor analysis based on one-dimensional and multidimensional IRT models. With this last analysis, we seek the test responses’ underlying factors associated with what the test is measuring.
THE GENERAL KNOWLEDGE TEST FOR ADMISSION INTO UNESP
The present study is based on the analysis of results of the General Knowledge tests for admission into Unesp administered from 2011 to 2014. The General Knowledge test can be considered both interdisciplinary and multidisciplinary, and it consists of 90 multiple choice questions (items) organized in different areas specified by national parameters for high school curriculum.
Unesp’s senior committees have systematically decided that their admission exams should, among other objectives, select candidates who can: articulate ideas in a coherent way; understand and relate ideas; express themselves clearly; and know the content of the state of São Paulo’s basic education curriculum. These requirements are important because they indicate a selective process guided by research of cognitive aspects of the learning that students acquire over the course of basic education. Thus, due to both the content treated and the way this approach is proposed to candidates in each of the areas examined, the preparation of the general knowledge test meets the guidelines established for it. The result of this preparation is an assessment instrument in which items 1 to 30 deal with languages, codes and their technologies (Portuguese, Literature, English, Physical Education and Arts), items 31 to 60 deal with Humanities and its technologies (History, Geography and Philosophy) and items 61 to 90 deal with Natural Sciences, Mathematics and their technologies (Biology, Chemistry, Physics and Mathematics).
Tests are corrected based on CTT and the candidate’s score is proportional to his/her number of correct answers.
Candidates who are ranked best in the general knowledge test according to their chosen undergraduate program are selected for the next phase, which consists of a specific knowledge test, with written-answer questions and a composition. The final score considers the candidate’s performance in all selection phases: the general knowledge and specific knowledge tests and the essay test. It is worth noting that now candidates can choose to include their Enem score in the composition of their general knowledge score. In addition, there are enrollment slots reserved for students who went to public secondary schools only.
Data for the answers without candidate identification were kindly provided by the Foundation for the São Paulo State University’s Admission Exam (Vunesp), the entity responsible for designing, administering and correcting the tests. Test questions, answer keys and some statistics are available at the Vunesp website.1
METHODS
Since the Vunesp corrects tests by following classical test theory, the initial analysis was conducted according to this approach.
In CTT, a basic concern is that the test has a high internal consistency, i.e., that each item has a strong or moderate positive correlation with the total number of correct answers. In order to assess the test’s internal consistency, the so-called Cronbach’s coefficient α was calculated. To assess the quality of the item in the context of internal consistency, we evaluated the variation of this coefficient by removing the item under analysis, in addition to analyzing the biserial correlation (r bis ) between the item and the total correct answers calculated only with the other items. The theoretical basis for these measurements is described in Revelle (2017a, chap. 7), and the calculation was performed using the psych package (REVELLE, 2017b) of the computational environment R (R CORE TEAM, 2017).
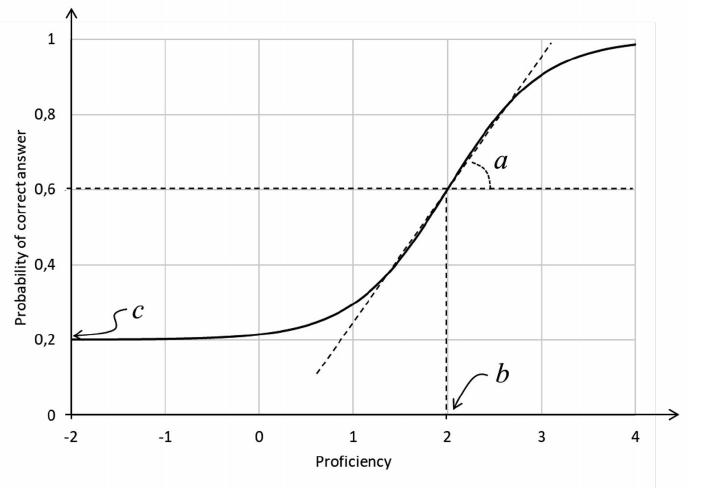
For the purposes of this paper, a more elaborate analysis was performed based on item response theory (IRT). IRT models relate the candidate’s probability to answer correctly an item with parameters of that item and the candidate’s proficiency. Several IRT models are presented in the literature, as extensively described in Van der Linden (2016). This paper adopts a model similar to the one used in the Saeb and the Enem. In the Saeb, the three-parameter probit function is used; in this study, we used the same model as in the Enem - the three-parameter logistic model -, whose probability that an individual with a proficiency j answers correctly an item i is given by:
Where parameters a, b and c are related to the item, and parameter θ is associated with the candidate. More specifically:
a i represents the discrimination level of item i;
b i corresponds to the difficulty level of item i;
c i refers to the probability of guessing the right answer of item i;
θ j represents the latent feature of candidate j, supposedly with a normal distribution with mean = 0 and standard deviation = 1.
Difficulty parameter b is on the same proficiency scale θ as the candidates. Because θ is assumed to have a normal standard distribution, its values are usually between -3 and +3. Thus, an item with b = 2 may be considered difficult for an average-proficiency candidate (θ = 0), but it can be considered easy for a candidate with a proficiency θ = 3 (Chart 1). Discrimination parameter a indicates how well the item distinguishes between candidates with a proficiency below b and candidates above b, with a > 1 being desirable. Chart 1 shows that the greater the parameter a the steeper the curve at point b.
Source: Prepared by the authors, 2018.
CHART 1 Curve of probability of a correct answer for an item with a = 2, b = 2 and c = 0.2, in function of a proficiency θ
The model’s parameters were estimated using the mirt package (CHALMERS, 2012, 2017) of the free computational environment R (R CORE TEAM, 2017), through marginal maximum likelihood.
The models’ goodness of fit was assessed by means of RMSEA (mean squared error of approximation), CFI (comparative fit index), and TLI (TuckerLewis index), using mirt’s M2 function. As Timothy (2015) and Cai and Hansen (2013) have pointed out, these statistics have the advantage of being scarcely sensitive to sample size, unlike the usual chi-square model comparison test, which usually rejects model fit when the sample is too large, even where the models are well fitted.
Items were positioned on the proficiency scale with the so-called anchor items, as described in Andrade, Tavares and Valle (2000). This positioning formed the basis for the scale’s pedagogical interpretation.
In a later stage, the test’s dimensionality was examined. A usual procedure for assessing an instrument’s (test’s) dimensionality is principal component analysis based on the correlation matrix formed between the pairs of items. In the present case, we adopted the so-called tetrachoric correlations, which are suitable for dichotomous items. A complement to principal component analysis is parallel analysis, which is performed by simulating random samples with uncorrelated items, thus allowing a kind of nonparametric test to evaluate the instrument’s dimensionality. These techniques are described by several authors, in particular by Revelle (2017a), Olsson, Drasgow and Dorans (1982) and Garrido, Abad and Ponsoda (2013).
A more complete analysis of dimensionality was performed through the socalled full information factorial analysis, which is based on multidimensional item response theory (MIRT) models, i.e., an extension of the IRT model in which the latent feature θ is considered multidimensional, being formed by several factors. In the present study, we adopted the so-called family of compensatory MIRT models as described by Reckase (2009), which is the most common formulation of multidimensional models. In computational terms, again, the mirt package was used (CHALMERS, 2012, 2017).
ANALYSIS OF THE TESTS THROUGH CTT
Table 1 presents for each edition of the test the coefficient α, the mean of biserial correlation coefficients (r bis ), the number of items that contribute negatively to the internal consistency (reduce α) and the number of items with a negative or very low r bis . These statistics were obtained using the computational package psych (REVELLE, 2017b).
TABLE 1 Classic statistics for tests’ internal consistency
| EDITION | NUMBER OF CANDIDATES | COEF. α | MEAN rbis | NUMBER OF ITEMS | |
|---|---|---|---|---|---|
| α IS REDUCED WITH REMOVAL | r bis < 0.15 | ||||
| 2011 | 73,178 | 0.919 | 0.32 | 7 | 7 |
| 2012 | 82,840 | 0.915 | 0.31 | 12 | 10 |
| 2013 | 84,393 | 0.926 | 0.34 | 4 | 4 |
| 2014 | 88,739 | 0.919 | 0.32 | 13 | 10 |
Source: Prepared by the authors, 2018.
Most authors consider that the measuring instrument has a satisfactory internal consistency when α > 0.70. In the four editions examined, Cronbach’s coefficient α was greater than 0.90, indicating high internal consistency.
By analyzing the test items, we found that of the 360 i tems that make up the four editions, only 36 reduce α when removed, and 31 have a very small biserial coefficient (r bis < 0.15). By way of comparison, we used the same procedure with a random sample of 25,000 students graduating from basic education, for the 2013 Enem Mathematics test, and obtained α = 0.89 and a mean r bis of 0.35, i.e., values significantly close to those found in the present study.
In sum, CTT statistics show that for the four editions examined, Unesp’s general knowledge tests have strong evidence of validity by internal consistency, even considering their inter and multidisciplinary characteristics.
ANALYSIS OF TESTS VIA UNIDIMENSIONAL IRT
Initially, each edition of the admission test was analyzed separately. Few items had their parameters estimated with poor values (poorly calibrated), such as discrimination coefficients below 0.5, difficulty parameters out of the interval [-5; 5] or relatively high standard errors. Items 32, 42 and 62 of the 2011 edition, items 2 and 31 of the 2012 edition and items 43, 52, 69 and 87 of the 2014 edition were poorly calibrated. These nine items are among those in which the biserial correlation coefficient was very low, as shown in Table 1.
Table 2 shows some IRT model fit statistics obtained by using the mirt computational package. In this analysis, the nine items with calibration problems were excluded.
TABLE 2 IRT Model Fit Quality Statistics
| EDITION | RMSEA | ITL | CFI |
|---|---|---|---|
| 2011 | 0.017 | 0.983 | 0.984 |
| 2012 | 0.014 | 0.988 | 0.989 |
| 2013 | 0.016 | 0.987 | 0.988 |
| 2014 | 0.018 | 0.982 | 0.983 |
Source: Prepared by the authors, 2018.
The fit is considered adequate when RMSEA < 0.05 and TLI and CFI are greater than 0.90 (THIMOTY, 2015, p. 74). Thus, according to the results of Table 2, the IRT models have good fit.
A possible criticism of adopting a one-dimensional model when one expects a multidimensional latent feature is that the dependence between items may not be fully explained by candidates’ proficiency differences, contrary to a basic assumption of IRT: local independence, which may occur because the instrument’s adequate dimension is not considered.
Following the approach of Chen and Thissen (1997), a possible local dependence can be analyzed by means of the residuals of the item correlation matrix, after adjusting the IRT model. Any moderate correlations between these residues would indicate local dependence. According to Schilling (2009), a heuristic to evaluate residuals is to examine whether the square root of the mean residual quadratic correlation is below 0.05 and whether few correlations are greater than 0.10, as these conditions suggest an essentially one-dimensional instrument.
In the present study, this analysis was performed using the 2014 edition of the mirt computational package. The square root of the mean quadratic residual correlations was 0.02. Only five correlations, in modulus, were greater than 0.10 out of the 3,655 correlations calculated. These results suggest that the test can be considered essentially one-dimensional.
A major advantage of IRT over CTT is that several tests can be placed on the same scale, thus allowing comparison between them. This process is known in the literature as equalization and, in the present work, we were able to perform equalization via population (ANDRADE; TAVARES; VALLE, 2000, p. 81). This process is usually performed with a set of candidates taking the various tests, but it is also possible when populations can be assumed to be equivalent (KOLEN; BRENNAN, 2004, p. 298).
Assuming populations to be equivalent is a rather subjective matter. In this study, this assumption was made considering that the São Paulo state’s Basic Education Development Index (Ideb) remained practically constant, i.e., 4.1 in 2011, 4.1 in 2013 and 4.2 in 2015 for both public and private schools. It is also noteworthy that during this period there was no change in the selection process’ criteria and objectives, and that the curriculum framework that guides the selection of knowledge required of candidates remained the same. Neither there, during the period, any significant change regarding candidates’ socioeconomic profile, the type of primary and secondary schools they went to (public or private), their attendance to preparatory courses, the period between high school completion and the admission exam, parents’ education, among other variables obtained from candidates’ answers to the socioeconomic questionnaire completed at the time of registration for the exam in the respective year.
Considering the above, when we performed the four editions’ combined calibration, the proficiencies were practically on the same scale, making it possible to expand the study’s historical scope. This calibration was performed with 351 items which correspond to the 90 items of each edition after removing the nine items with calibration problems in the separate analysis of each test.
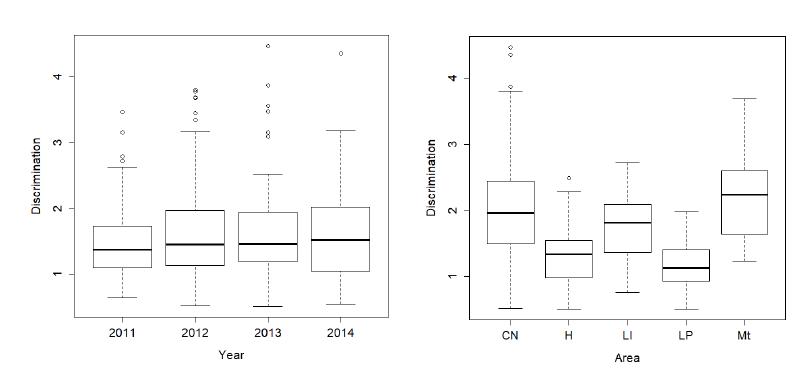
Charts 2 to 4 show boxplots of estimates for the three parameters of the IRT model by year and knowledge area: Humanities (H), Portuguese and Literature (LP), English (LI), Natural Sciences (CN) and Mathematics (Mt). English items were separated, since previous studies have found that they were positioned in a different dimension from Portuguese and Literature items. (BARBETTA et al., 2014). Mathematics and Natural Sciences items were also separated. The charts were made with functions of software R.
Source: Prepared by the authors, 2018.
CHART 2 Estimates of discrimination parameters (a) by year and knowledge area
Source: Prepared by the authors, 2018.
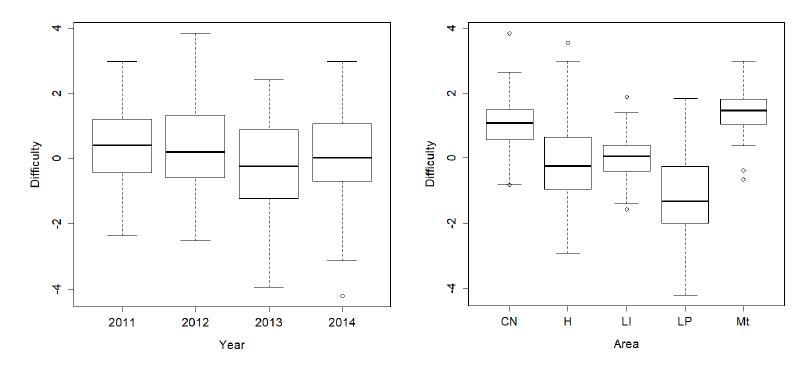
CHART 3 Estimates of difficulty parameters (b) by year and knowledge area
Source: Prepared by the authors, 2018.
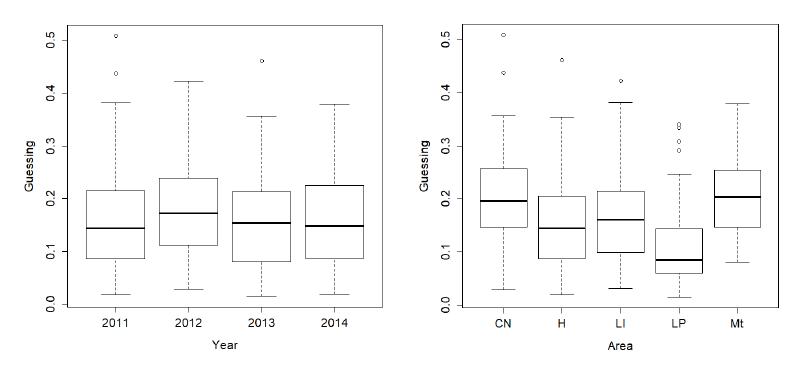
CHART 4 Estimates of guessing parameters (c) by year and knowledge area
There is little difference in the distribution of IRT parameters over the four editions of the admission test; the only finding worth highlighting is that the 2013 test shows a slight tendency for easier items (Chart 3). In terms of knowledge areas, we found that Natural Sciences (CN) and Mathematics (Mt) items tend to be more difficult and discriminate more. Humanities (H) and Portuguese and Literature (LP) items are generally easier and discriminate less.
In order to compare the proficiency obtained through IRT in the four editions combined and the score calculated through CTT in each edition, we calculated the Pearson correlation coefficient between the two measures and obtained 0.967, which indicates a very strong correlation, thus showing the congruence of the two measurement processes. That does not mean that the two approaches lead to similar results for the purpose of this test, because in terms of candidate ranking, small score differences can result in very different positions for the same program. In addition, IRT produces fairer results as it considers the consistency in the candidate’s response pattern and allows interpreting the score scale and, under certain conditions, comparing the scores in various editions.
BUILDING AND INTERPRETING THE ONE-DIMENSIONAL SCALE
This section presents a one-dimensional scale for the Unesp general knowledge test, considering that the test’s main objective is to classify candidates for a second stage with written-answer questions. One-dimensional measures in interdisciplinary tests have already been proposed in other studies, such as Quaresma (2014) in Fuvest’s first phase test, Coelho (2014) in Enade’s Statistics area, and Vieira (2016), in Enem, considering the four objective tests as a single test.
However, it is not common to make a pedagogical interpretation of a one-dimensional measure in an interdisciplinary test. In Enem, for example, an interpretable scale is built for each area, considering that these areas have their own reference frameworks, which consist of various area-specific skills. Nevertheless, when Enem exams are used to rank candidates in college admission tests, a summary measure is produced: in general, the arithmetic mean of the four areas and the essay. No pedagogical interpretation is made for this synthesis measure.
Following Reckase (2009, p. 184), the analysis through one-dimensional IRT models can result in a compound reference measure of a test that evaluates multiple skills. Thus, the present article makes an essay by pedagogically interpreting an interdisciplinary test, and adopts general terms that may encompass the contents of various disciplines.
By applying one-dimensional IRT, Unesp candidates can be positioned on a continuous scale where the origin represents a candidate of average proficiency, and each unit on the scale corresponds to a standard deviation from the average, with the scale (0, 1). What is interesting about the IRT methodology is that items can also be positioned on the same scale as that of candidates’ proficiency. This article adopts the approach described in Andrade, Tavares and Valle (2000, p. 110) for the positioning of items on the scale.
The scale was interpreted at six levels, with level 1 set at two belowaverage standard deviations and level 6 at three above-average standard deviations. This asymmetry is due to the nature of the test, designed to better discriminate above-average candidates. Table 3 shows the positioning of items considered anchor or near-anchor, i.e., items strongly associated with a given level of the scale. The criteria for defining anchor items were based on Andrade, Tavares and Valle (2000, p. 110) and Beaton and Allen (1992), who consider the following restrictions: probability of correct answer at the positioned level greater than 0.65; probability of correct answer at the previous level below 0.50; and difference between the positioned level and the previous level greater than 0.30. For the “near-anchor” categorization, the last restriction was not included, but the item’s discrimination level had to be greater than 1.
TABLE 3 Composition of items on the scale - year of administration and item content
| ANCHOR | NEAR-ANCHOR | |||||||
| LEVELS | 2011 | 2012 | 2013 | 2014 | 2011 | 2012 | 2013 | 2014 |
| Level 1 | 10-Lp | 3-Lp | 6-Lp | 6-Lp | 6-Lp | |||
| 7-Lp | 48-Geo | |||||||
| 10-Lp | 57-Fil | |||||||
| Level 2 | 7-Lp | 6-Lp | 9-Lp | 10-Lp | 14-Lp | 14-Lp | 14-Lp | 12-Lp |
| 51-Geo | 18-Lp | 16-Lp | 51-Geo | 21-Ing | 45-Geo | 47-Geo | ||
| 58-Fil | 18-Lp | 52-Geo | ||||||
| 12-Lp | 22-Ing | 34-His | ||||||
| 25-Ing | 44-His | |||||||
| Level 3 | 9-Lp | 22-Ing | 20-Lp | 23-Ing | 7-Lp | 7-Lp | 47-Geo | 33-His |
| 49-Geo | 23-Ing | 21-Ing | 28-Ing | 27-Ing | 46-Geo | 68-Bio | ||
| 22-Ing | 26-Ing | 23-Ing | 33-His | 46-Geo | 60-Fil | 88-Mat | ||
| 56-Fil | 59-Fil | 49-Geo | 37-His | 54-Geo | ||||
| 60-Fil | 58-Fil | 38-His | 60-Fil | |||||
| 60-Fil | 40-His | 67-Bio | ||||||
| 61-Bio | 45-Geo | |||||||
| 49-Geo | ||||||||
| Level 4 | 11-Lp | 24-Ing | 26-Ing | 21-Ing | 23-Ing | 47-Geo | 13-Lp | 67-Bio |
| 25-Ing | 25-Ing | 41-His | 68-Bio | 59-Fil | 28-Ing | 2-Lp | ||
| 36-His | 65-Bio | 42-His | 72-Quim | 30-Ing | ||||
| 83-Fis | 29-Ing | 62-Bio | 73-Quim | 31-His | ||||
| 45-Geo | 66-Bio | 64-Bio | 74-Quim | 35-His | ||||
| 12-Lp | 70-Quim | 69-Quim | 88-Mat | 67-Bio | ||||
| 86-Mat | 68-Quim | 71-Quim | 77-Fis | |||||
| 28-Ing | 71-Quim | 73-Quim | ||||||
| 82-Fis | ||||||||
| Level 5 | 3-Lp | 40-His | 70-Quim | 58-Fil | 44-Geo | |||
| 35-His | 64-Bio | 75-Quim | 88-Mat | |||||
| 61-Bio | 67-Bio | 76-Fis | ||||||
| 74-Quim | 73-Quim | 78-Fis | ||||||
| 90-Mat | 77-Fis | 79-Fis | ||||||
| 30-Ing | 81-Fis | 81-Fis | ||||||
| 79-Mat | 83-Mat | 83-Fis | ||||||
| 76-Fis | 85-Mat | 84-Fis | ||||||
| 77-Fis | 90-Mat | 90-Mat | ||||||
| 85-Mat | ||||||||
| 87-Mat | ||||||||
| Level 6 | 50-Geo | 38-His | 38-His | 65-Bio | ||||
| 84-Mat | 84-Mat | 74-Quim | 66-Bio | |||||
| 50-Geo | 89-Mat | 86-Mat | 79-Fis | |||||
| 80-Fis | ||||||||
Source: Prepared by the authors, 2018.
Contents: Lp=Portuguese and Literature; Geo=Geography; Fil=Philosophy; Ing=English; His=History; Mat= Mathematics; Bio=Biology; Quim=Chemistry; Fis=Physics.
Regarding to the distribution of contents associated with items at each level of the scale, the table shows that, over the test’s editions, the items of each subject are similarly distributed and positioned at various proficiency levels. Geography and History items are distributed over all levels. The same occurs, to a lesser extent, with English and Portuguese questions. Items of Natural Sciences and its Technologies are concentrated between levels 3 and 4 of the scale, but in the disciplines that make up this area, the items are clearly more present at the higher levels, suggesting that the skills associated with them are more complex.
Compared to previous studies, the result of the combined treatment of the four tests showed that almost all anchor items from 2012 to 2014 could be included in the existing scale (see BARBETTA et al., 2014). However, in order to make the description more pertinent, it was necessary to adapt the terms of some descriptors to include new types of text as a stimulus in the composition of the contexts presented to the candidate - for example, scientific texts, nonliterary texts and charts.
Jointly calibrating the four editions of the Unesp entrance exam and assuming the public of candidates to be similar led us to estimate the parameters for the items on the same scale where items were positioned for pedagogical interpretation.
It is worth noting that the Unesp admission exams are based on the curricular guidelines of the State of São Paulo (SÃO PAULO, 2011a, 2011b, 2011c, 2011d), which presents the contents and skills that students are expected to master in each knowledge area and learning stage. We interpreted the general proficiency scale based on items’ positioning and taking into account the curriculum guidelines so as to describe the skills and knowledge in simple language in the various areas that make up the general knowledge test.
Table 4 presents a proposal for pedagogical interpretation of the scale levels, considering that, at each level, the student must have the skills described in it and in the previous levels (cumulative property of knowledge).
TABLE 4 Interpretation of the general proficiency scale levels
| Level 1 | • | Finding information presented in news stories and fragments of literary text (nonfiction). |
| Level 2 | • | Selecting explicit information presented in fragments of literary text (non-fiction), graphic language and public documents. |
| • | Interpreting information presented in texts of different genres, illustrations, codes or maps. | |
| • | Establishing relationships between images and a body text written in Portuguese and/or English, comparing presupposed or implied information. | |
| Level 3 | • | Identifying the meaning of words and phrases presented in literary texts (non-fiction). |
| • | Identifying the main elements of the political, economic and cultural systems of social life organization. | |
| • | Establishing relationships between images and a scientific body text in order to obtain presupposed or implied data. | |
| • | Analyzing explicit information presented in medium-complexity scientific texts and tables, including in English. | |
| • | Analyzing texts of different genres to infer information. | |
| Level 4 | • | Selecting information in literary texts using pre-established criteria. |
| • | Developing a proposal based on explicit information presented in texts, illustrations and diagrams, including in English. | |
| • | Identifying specific characteristics associated with historical, cultural, scientific and technological contexts. | |
| • | Interpreting maps and diagrams in order to solve problems involving simple calculations. | |
| • | Relating information in order to solve a problem using calculations with operations, functions and trigonometric relations. | |
| • | Analyzing information presented in parts, in medium-complexity scientific texts, and understanding the interrelationship between the parts. | |
| • | Applying specific scientific knowledge to problem solving. | |
| Level 5 | • | Analyzing texts of different genres presented in English in order to infer information. |
| • | Comparing different interpretations of situations associated with historical and social contexts to evaluate the validity of the arguments used. | |
| • | Analyzing a technical and scientific text to infer and organize implied or presupposed information. | |
| • | Analyzing information presented in technical texts, diagrams and charts to relate them to determinations by their specific characteristics presented in texts, charts or figures. | |
| • | Solving problems involving calculating the volume of three-dimensional figures. | |
| • | Analyzing high complexity charts in order to infer specific technical information. | |
| Level 6 | • | Relating information presented in complex technical texts in different knowledge areas in order to identify terminology, facts or characteristics of the area. |
| • | Solving a problem involving combinatorial analysis. | |
| • | Applying the fundamental laws and concepts of physics to solve problems involving motion. |
Source: Prepared by the authors, 2018, complementing the table presented in Barbetta et al. (2014).
Although the Saeb has a reference framework by school year and area, the skills at each level of the scale are described slightly differently, generally in more detail, since the description considers the content of the positioned items (BRASIL, 2015). Gomes (2018) made a pedagogical interpretation of Enem’s global scores - all areas combined - and fitted part of the reference framework skills into the scale levels. In the present article, we analyzed interdisciplinary and multidisciplinary tests. Therefore, some skills in Chart 2 were written in a more generical way to encompass different knowledge areas.
STUDYING THE TEST’S DIMENSIONALITY
The Unesp general knowledge test is interdisciplinary and multidisciplinary in which some items permeate the curriculum content and solving them requires mobilizing knowledge associated with different disciplines. In this context, the question arises: is it reasonable to suppose that items and candidates can be well represented by a one-dimensional latent feature? In other words, is it reasonable for a single measure constructed with the test’s answers to differentiate well among those evaluated?
Schilling (2009) distinguishes restricted one-dimensionality from essential one-dimensionality, the latter concept being associated with a dominant dimension that is sufficient for applying one-dimensional IRT. As mentioned earlier, Reckase (2009, p. 184) notes that a measure produced by one-dimensional IRT can represent a reference made up of various skills. In this context, the Unesp general knowledge exam may have a dominant factor made up of various skills of the candidates.
It is worth mentioning some studies in national tests. Quaresma (2014) found that the Fuvest first phase test is well represented by four dimensions, but a three-parameter one-dimensional IRT model is well adjusted. Vieira (2016) considered Enem’s four objective tests (2012 edition) as a single test of 4 x 45 = 180 items to show that there was a widely dominant dimension. In addition, the proficiency generated by IRT showed a very high correlation with the simple arithmetic mean of the proficiencies of the four areas published by Inep. Barbetta et al. (2014) showed that the 2011 Unesp general knowledge test is well represented by a three-dimensional latent feature, but a one-dimensional IRT model is also well-adjusted, indicating that the one-dimensional latent feature is a composition of skills. In order to analyze dimensionality, it is important to obtain correlations between all pairs of items, which is not possible based on the responses of the four editions combined. Thus, the dimensionality analysis was performed only with the 2014 test candidates.
Chart 5 presents the result of principal component analysis based on the tetrachoric correlation matrix. The dotted line refers to the parallel analysis performed with simulated samples, where the items are statistically independent. This analysis was performed using the psych computational package of software R.
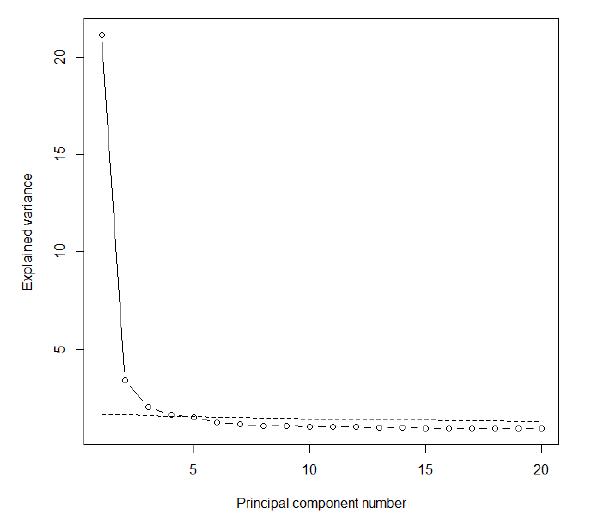
Chart 5 shows that the first principal component has a much higher explained variance than the others, which shows a dominant dimension, thus allowing the use of one-dimensional IRT. However, there are other points above the dotted line that represents the tolerable limit, according to the socalled parallel analysis. This suggests that while one-dimensional IRT can be applied, a multidimensional item response theory (MIRT) model should better fit candidates’ response patterns.
In order to elucidate the skills that are combined in the one-dimensional latent feature interpreted as candidates’ general proficiency, several MIRT models were adjusted using the software R mirt package, from the latent feature model or factor (one-dimensional model) to the one with seven latent features (multidimensional models). The quality of these adjustments was assessed through the TLI and CFI statistics discussed earlier. We also examined the deviance information criterion (DIC) discussed in Weakliem (1999). This statistic usually grows as the number of dimensions of the adjusted model increases, but the growth is relatively small when superfluous dimensions are included. Table 5 shows the results.
TABLE 5 Adjustment quality measures on models from one to seven dimensions
| DIMENSION | DIC | DIC REDUCTION | TLI | CFI |
|---|---|---|---|---|
| 1 | 7,882,498 | - | 0.982 | 0.983 |
| 2 | 7,830,303 | 52,195 | 0.993 | 0.994 |
| 3 | 7,806,596 | 23,707 | 0.996 | 0.997 |
| 4 | 7,799,396 | 7,200 | 0.997 | 0.997 |
| 5 | 7,794,582 | 4,814 | 0.996 | 0.996 |
| 6 | 7,792,613 | 1,969 | 0.912 | 0.926 |
| 7 | 7,792,175 | 438 | 0.952 | 0.960 |
Fonte: Prepared by the authors, 2018.
Table 5 shows that there is a strong reduction of DIC when moving from the one-dimensional to the two-dimensional model, and from the two- to the three-dimensional model. From this stage on, reductions are smoother, particularly after five dimensions. The TLI and CFI statistics show higher values in the three, four and five dimension models. In sum, this test’s dimensionality is best represented by three, four or five factors, according to statistics in both Table 5 and Chart 5.
Barbetta et al. (2014) adjusted models with three factors which were interpreted as: text comprehension and general knowledge, especially evidenced by Humanities, Portuguese and Literature items; logical reasoning and specific knowledge, evidenced by Physics and Mathematics items; and proficiency in English. Due to computational constraints of the time, their study had some limitations regarding data and the model parameter estimation process.
In the present study, using all 2014 data and estimating all item parameters simultaneously, the three-factor adjustment (three-factor MIRT model) presented similar results to the previous study, although the first factor, previously called text comprehension and general knowledge has now become more associated with Humanities items, while Languages a nd Codes (except English) items did not turn out so well represented. On the other hand, the five factor-solution showed more interesting results. Table 6 shows the factor loadings for the five-factor adjustment, which allows inferring what each factor is measuring.
TABLE 6 Factor loadings for the 2014 test via full information factor analysis, including Oblimin rotation
| ITEM(1) | F1 | F2 | F3 | F4 | F5 | ITEM(1) | F1 | F2 | F3 | F4 | F5 |
| 1 | 0.14 | 0.33 | 0.03 | -0.17 | 0.36 | 46 | 0.61 | 0.07 | 0.08 | 0,05 | 0,09 |
| 2 | -0.06 | 0.15 | 0.30 | 0.29 | 0.26 | 47 | 0.48 | -0.03 | 0.12 | 0,19 | 0,10 |
| 3 | -0.03 | 0.21 | 0.07 | -0.13 | 0.51 | 48 | 0.60 | 0.08 | 0.09 | 0,09 | -0,03 |
| 4 | 0.12 | 0.23 | 0.18 | -0.06 | 0.44 | 49 | 0.60 | 0.06 | 0.12 | 0,02 | 0,11 |
| 5 | 0.17 | 0.10 | 0.10 | 0.01 | 0.34 | 50 | 0.59 | -0.04 | 0.05 | -0,07 | 0,24 |
| 6 | 0.25 | 0.24 | 0.10 | -0.16 | 0.37 | 51 | 0.51 | 0.06 | 0.13 | 0,01 | 0,24 |
| 7 | 0.18 | 0.17 | 0.37 | -0.23 | 0.10 | 52 | - | - | - | - | - |
| 8 | 0.14 | 0.07 | 0.19 | 0.21 | 0.37 | 53 | 0.51 | 0.15 | -0.03 | -0,20 | 0,09 |
| 9 | 0.34 | -0.04 | 0.03 | 0.03 | 0.13 | 54 | 0.68 | 0.08 | 0.05 | 0,05 | 0,08 |
| 10 | -0.03 | 0.23 | 0.22 | 0.11 | 0.42 | 55 | 0.28 | -0.06 | 0.10 | 0,03 | 0,28 |
| 11 | 0.19 | 0.02 | 0.06 | 0.02 | 0.46 | 56 | 0.48 | -0.09 | -0.07 | -0,02 | 0,25 |
| 12 | 0.25 | 0.14 | -0.01 | -0.05 | 0.43 | 57 | 0.45 | 0.03 | 0.19 | 0,07 | 0,24 |
| 13 | 0.07 | 0.16 | 0.06 | 0.27 | 0.24 | 58 | 0.49 | -0.01 | 0.06 | 0,11 | 0,21 |
| 14 | 0.15 | -0.01 | 0.05 | 0.09 | 0.56 | 59 | 0.64 | -0.05 | 0.12 | -0,04 | 0,09 |
| 15 | 0.18 | 0.03 | 0.05 | 0.01 | 0.42 | 60 | 0.34 | -0.07 | 0.10 | -0,03 | 0,27 |
| 16 | 0.23 | 0.04 | 0.17 | 0.11 | 0.41 | 61 | 0.33 | 0.17 | 0.09 | 0,41 | 0,06 |
| 17 | 0.27 | 0.01 | 0.16 | -0.01 | 0.33 | 62 | 0.33 | 0.37 | 0.02 | 0,21 | 0,06 |
| 18 | -0.06 | 0.24 | 0.13 | 0.27 | 0.24 | 63 | 0.34 | 0.08 | 0.07 | 0,05 | 0,04 |
| 19 | -0.06 | 0.26 | 0.33 | 0.24 | 0.34 | 64 | 0.39 | 0.33 | 0.10 | 0,09 | 0,02 |
| 20 | 0.19 | -0.07 | 0.18 | 0.08 | 0.41 | 65 | 0.14 | 0.65 | 0.17 | -0,24 | 0,15 |
| 21 | 0.09 | 0.07 | 0.70 | 0.00 | 0.02 | 66 | 0.56 | 0.20 | 0.02 | 0,37 | -0,16 |
| 22 | 0.05 | -0.06 | 0.97 | -0.04 | -0.02 | 67 | 0.36 | 0.20 | 0.10 | 0,05 | -0,04 |
| 23 | 0.11 | -0.01 | 0.84 | -0.07 | 0.05 | 68 | 0.38 | 0.24 | 0.07 | 0,12 | 0,06 |
| 24 | -0.01 | 0.01 | 0.98 | -0.06 | -0.07 | 69 | - | - | - | - | - |
| 25 | 0.12 | 0.12 | 0.71 | -0.10 | -0.02 | 70 | 0.15 | 0.52 | 0.09 | 0,29 | 0,07 |
| 26 | -0.05 | -0.03 | 0.94 | 0.09 | 0.02 | 71 | 0.35 | 0.28 | 0.10 | 0,40 | 0,00 |
| 27 | 0.01 | 0.04 | 0.48 | 0.02 | 0.07 | 72 | 0.31 | 0.25 | 0.11 | 0,41 | -0,03 |
| 28 | 0.03 | -0.08 | 0.91 | 0.00 | 0.07 | 73 | 0.16 | 0.34 | 0.10 | 0,43 | 0,05 |
| 29 | -0.07 | 0.04 | 0.80 | 0.18 | 0.03 | 74 | 0.14 | 0.35 | 0.09 | 0,37 | 0,07 |
| 30 | -0.08 | 0.09 | 0.94 | -0.03 | -0.03 | 75 | 0.21 | 0.30 | 0.02 | 0,47 | 0,04 |
| ITEM(1) | F1 | F2 | F3 | F4 | F5 | ITEM(1) | F1 | F2 | F3 | F4 | F5 |
| 31 | 0.46 | 0.13 | 0.14 | 0.07 | 0.02 | 76 | 0.15 | 0.20 | 0.05 | 0,41 | 0,11 |
| 32 | 0.63 | 0.07 | 0.08 | -0.07 | -0.12 | 77 | 0.14 | 0.53 | 0.04 | 0,30 | 0,04 |
| 33 | 0.58 | 0.04 | 0.15 | 0.01 | 0.09 | 78 | 0.10 | 0.67 | 0.08 | 0,18 | 0,02 |
| 34 | 0.28 | 0.04 | 0.07 | -0.04 | 0.26 | 79 | 0.23 | 0.74 | 0.08 | 0,06 | -0,10 |
| 35 | 0.51 | -0.03 | 0.09 | 0.18 | 0.15 | 80 | 0.18 | 0.68 | 0.12 | 0,10 | -0,13 |
| 36 | 0.32 | 0.03 | 0.10 | -0.05 | -0.04 | 81 | -0.01 | 0.80 | 0.09 | 0,05 | -0,04 |
| 37 | 0.51 | 0.01 | 0.10 | 0.02 | 0.23 | 82 | 0.01 | 0.63 | 0.07 | 0,06 | 0,03 |
| 38 | 0.58 | 0.01 | 0.14 | 0.05 | 0.22 | 83 | 0.15 | 0.61 | 0.02 | 0,10 | -0,11 |
| 39 | 0.46 | 0.01 | 0.10 | -0.09 | 0.24 | 84 | 0.00 | 0.89 | 0.03 | -0,09 | 0,02 |
| 40 | 0.69 | 0.10 | 0.09 | -0.04 | 0.08 | 85 | 0.00 | 0.60 | 0.11 | 0,24 | 0,10 |
| 41 | 0.46 | 0.03 | 0.08 | 0.00 | 0.06 | 86 | 0.05 | 0.76 | 0.02 | -0,06 | 0,08 |
| 42 | 0.79 | 0.06 | -0.01 | 0.14 | -0.11 | 87 | - | - | - | - | - |
| 43 | - | - | - | - | - | 88 | -0.02 | 0.83 | -0.06 | 0,06 | 0,17 |
| 44 | 0.35 | 0.15 | 0.08 | 0.24 | -0.03 | 89 | -0.14 | 0.87 | 0.01 | -0,01 | 0,06 |
| 45 | 0.63 | 0.25 | 0.05 | 0.04 | -0.08 | 90 | 0.16 | 0.22 | 0.17 | 0,11 | 0,24 |
| Factors | F1 | F2 | F3 | F4 | F5 | ||||||
| Explained variance | 10.2 | 8.8 | 8.2 | 2.6 | 3.8 |
Source: Prepared by the authors, 2018.
(1) Items from 1 to 30 deal with Language and Codes, from 31 to 60, Humanities, and from 61 to 90, Natural Sciences and Mathematics.
Proficiency in English is represented by a factor of its own - items 21 to 30 are closely correlated with factor F3. The ability was previously classified under text comprehension and general knowledge and is now represented by factors F1 and F5, being F1 more associated with the Humanities items (31 to 60) and F5 with Portuguese and Literature items (1 to 20).
Factor F2 is well represented by Physics and Mathematics items (77 to 90), therefore related to candidates’ logical reasoning. Most Chemistry items (69 to 76) have a moderate F4 factor loading, and some are also associated with factor F2. Biology items (61 to 68) are more associated with factor F1, i.e., with Humanities items, but some of them also share their loading with factors F2 and F4 (logical reasoning and proficiency in Chemistry, respectively). In short, the test’s representation in five factors can be described as follows:
text comprehension and general knowledge, particularly in Humanities (F1);
logical reasoning (F2);
proficiency in English (F3);
proficiency in Chemistry (F4);
proficiency in Portuguese and Literature (F5).
It is worth noting that the factors with the highest explained variance (last line of Table 6) are F1, F2 and F3. Factor F1, mainly associated with Humanities items, and factor F2 (proficiency in Portuguese and Literature) have a moderate positive correlation. Both factors are also associated with text comprehension skills.
It must be noted that the factors described here are not in themselves measures of the constructs text comprehension, logical reasoning, etc., but rather measures formed by the test items associated with these constructs.
Results were similar to those found by Quaresma (2014), who analyzed the first phase of the Fuvest exam. Quaresma’s statistical analysis indicated adequacy from three to five factors, but he emphasized the four-factor solution. He found no direct relationship with the four major areas adopted by the Enem test since 2009, but interpreted the four factors that stood out in the analysis: “general ability” as it relates well to training and reading and comprehension items; “mastery of logical reasoning”, associated with training items; “mastery of interpretive analysis”, which involves items of various disciplines; and “mastery of English”.
FINAL CONSIDERATIONS
The Unesp general knowledge test is interdisciplinary and multidisciplinary and it is corrected according to CTT, with candidates’ scores being based on the number of correct answers. In this study, the test’s validity was evaluated in the context of its internal structure, particularly based on IRT. Even considering the test’s interdisciplinary nature, we found a significantly dominant factor which was interpreted as the “candidate’s overall performance”, a one-dimensional latent feature on which we proposed a pedagogically interpreted six-level scale.
Moreover, we performed factor analysis to identify the underlying factors that make up this test, which is justified since knowing what a measuring instrument is actually measuring allows using it more efficiently. The study shows that the technique for generating a single value for the candidate and the analysis resulting in multiple factors associated with that candidate’s skills are not contradictory. In fact, both analyzes complement each other, though in the first case we have the idea of the instrument’s one-dimensionality, while in the second there is the idea of multidimensionality.
In the analysis, we aggregated tests from 2011 to 2014 to obtain a single scale measure. The coefficient of correlation of this measure with the number of correct answers of each test’s candidates was 0.967, a very strong correlation, which shows the consistence between the two measurement processes. It is worth stressing, however, that the IRT-based measurement had the best fit for the purposes of this study.
In a complementary study that aimed to understand empirically what the test is measuring, we found that a five-dimensional model is well adjusted to candidates’ responses. By analyzing that result, we were able to see how the items of different disciplines interact.
While the results of adjusting a one-dimensional model allow classifying candidates through a general performance measure, the multidimensional model can provide more insight into what the test is measuring. In particular, we identified three factors with a high explanatory power which are associated with the humanities, logical reasoning and proficiency in English. It is also worth mentioning the Chemistry and Portuguese and Literature items, which stand out in two other factors.

