


Services on Demand
Journal

Article
 text in
  English (pdf)
 Article in xml format
 Send this article by e-mail
Share

 Permalink
Estudos em Avaliação Educacional
Print version ISSN 0103-6831On-line version ISSN 1984-932X
Est. Aval. Educ. vol.34 São Paulo 2023 Epub Dec 29, 2023
https://doi.org/10.18222/eae.v34.9117_port
ARTICLES
STUDY OF THE MULTIDIMENSIONAL ACADEMIC RANKING U-MULTIRANK

IInstituto Nacional de Pesquisas Espaciais (INPE), São José dos Campos-SP, Brazil; antonio.prado@inpe.br
The present paper explores the dimensions and indicators of the international multidimensional academic ranking U-Multirank. Studying this ranking is important in Brazil today, as the new evaluation of graduate programs in the country is incorporating several aspects of multidimensional evaluation, including concepts from U-Multirank. This ranking reveals the strengths and weaknesses of each academic institution through 5 dimensions formed by 36 indicators. While this large set of dimensions and indicators provides a comprehensive view of universities, it raises questions regarding their independence and data availability. The analysis focuses on the top 300 European academic institutions listed in the 2020 edition, describing the dimensions and indicators and calculating statistical correlations between them.
KEYWORDS: MULTIDIMENSIONAL ACADEMIC EVALUATIONS; EVALUATION OF THE EDUCATION SYSTEM; ACADEMIC RANKINGS; INTERNATIONAL EVALUATION; UNIVERSITY MANAGEMENT
Este artigo estuda as dimensões e indicadores do ranking acadêmico internacional multidimensional U-Multirank. O estudo desse ranking é importante no Brasil na atualidade, uma vez que a nova avaliação dos programas de pós-graduação brasileiros utiliza conceitos de avaliação multidimensional, incluindo alguns princípios usados no U-Multirank. Esse ranking apresenta os pontos fracos e fortes de cada instituição acadêmica por meio de 5 dimensões, compostas por 36 indicadores. Esse grande número de dimensões e indicadores gera uma visão mais completa das universidades, mas levanta questões sobre sua independência e disponibilidade de dados. São analisadas as trezentas melhores instituições acadêmicas europeias listadas na edição de 2020 do U-Multirank, explicando as dimensões e indicadores e fazendo correlações estatísticas entre tais indicadores e dimensões.
PALAVRAS-CHAVE: AVALIAÇÃO ACADÊMICA MULTIDIMENSIONAL; AVALIAÇÃO DOS SISTEMAS DE ENSINO; RANKINGS ACADÊMICOS; AVALIAÇÃO INTERNACIONAL; GESTÃO UNIVERSITÁRIA
Este artículo estudia las dimensiones e indicadores del ranking académico internacional multidimensional U-Multirank. En la actualidad, el estudio del ranking es importante en Brasil, una vez que la nueva evaluación de los programas de postgrado brasileños utiliza conceptos de evaluación multidimensional, que incluyen algunos principios utilizados en U-Multirank. Dicho ranking presenta los puntos débiles y fuertes de cada institución académica por medio de 5 dimensiones compuestas por 36 indicadores. Este gran número de dimensiones e indicadores genera una visión más completa de las universidades, pero suscita cuestiones sobre su independencia y disponibilidad de datos. Se analizan las trecientas mejores instituciones académicas europeas enumeradas en la edición de 2020 de U-Multirank, explicando las dimensiones e indicadores y presentando correlaciones estadísticas entre tales indicadores y dimensiones.
PALABRAS CLAVE: EVALUACIÓN ACADÉMICA MULTIDIMENSIONAL; EVALUACIÓN DEL SISTEMA EDUCATIVO; RANKINGS ACADÉMICOS; EVALUACIÓN INTERNACIONAL; GESTIÓN UNIVERSITARIA
INTRODUCTION
Academic evaluation is a problem that has long been examined in education. In Brazil, evaluations in higher education have been conducted for many years (Guimarães & Esteves, 2018). Regarding graduate programs, the Coordenação de Aperfeiçoamento de Pessoal de Nível Superior [Coordination for the Improvement of Higher Education Personnel] (Capes) has been evaluating these programs for several decades (Rodrigues et al., 2020). Studies are currently being conducted for a significant modification in the evaluation criteria, using concepts from the multidimensional approach.
Concerning international academic evaluations, numerous renowned rankings are available (Calderón et al., 2017; Calderón & França, 2018a; Dill & Soo, 2005; Eccles, 2002; Ganga-Contreras et al., 2020). These rankings emerged in the early 21st century and have been gaining popularity each year. Today, they are considered important by almost all academic institutions worldwide, serving as an official “seal of quality” for those institutions that achieve favorable positions, enhancing their ability to “sell their goods” in the competitive global education market. Academic rankings can even be considered a field of research, given the large number of available publications (Billaut et al., 2010; Calderón & França, 2018b; Gonçalves & Calderón, 2017; Herting, 2016; Liu & Cheng, 2005; Marginson & Wende, 2007; Bernhard, 2012; Shin et al., 2011; Sorz et al., 2015; Stack, 2016; Raan, 2005; Webster, 2001; Aguillo et al., 2010; Aguillo et al., 2006; Théry, 2010).
A multidimensional evaluation of academic institutions, as considered by Capes today, is not a new idea. This concept emerged in Europe in 2008, and a multidimensional ranking was proposed (Vught & Ziegele, 2012). Key considerations include which dimensions and indicators to use, as well as an initial examination of the independence of those dimensions and indicators. Capes’ current evaluation focuses on the “research” dimension of U-Multirank. Therefore, it is interesting to explore the correlations between this and other dimension in order to estimate, if roughly, what may happen when a multidimensional evaluation is used in Brazil.
The principle underlying U-Multirank is that there is no singular “best”, “top 10”, or universal classification for academic institutions worldwide. The “best” university is a personal choice of each student, dependent on their goals and constraints. Following this concept, a multidimensional ranking should only define the primary criteria (the dimensions) and how to evaluate those criteria (via the indicators and the rules to calculate them). Academic institutions are categorized into five groups of quality for each indicator, following specified rules. Rankings are determined individually for each indicator, without a unified ranking, thus allowing users to focus on the indicators that are most relevant to them.
U-Multirank (U-Multirank, 2023b; Prado, 2021, 2022) was created based on this idea. It evaluates the performance of educational institutions in five dimensions: (1) teaching and learning; (2) research; (3) knowledge transfer; (4) international orientation; and (5) regional engagement. Each of these dimensions is divided into a large number of indicators, ranging from 4 to 11, depending on the dimension. It is focused on future students who want to see an international classification of higher education institutions to choose the one that most closely matches their interests. Users can evaluate each indicator separately or grouped into families, focusing on the most important ones for their own decision-making.
Since U-Multirank has a far greater number of indicators (36), when compared to one-dimensional rankings, which usually have less than 15 indicators, missing data are expected to be a potential problem, which could be a negative point of this ranking. This is not as important for U-Multirank as it is for one-dimensional rankings, since a general classification is not the former’s purpose, and the user can just neglect the missing information and concentrate on the available data, loosing part of the information, but not the whole ranking. But the amount of missing data is not negligible in many situations, and the present paper will look at this point later.
Another main point to be studied in the present paper is to examine whether the institutions are typically focused on some of the dimensions and indicators or exhibit a homogeneous behavior across the dimensions. This study will be conducted for the 300 “best performers” in Europe because the institutions with better overall performances have more complete data sets, particularly in Europe, minimizing the problems caused by missing data.
To conduct this study, the initial step is to define the meaning of “best performers” in U-Multirank. This is not a simple question. The ranking was created based on the idea of avoiding a general classification, as explained earlier. The dimensions have different numbers of indicators, and many indicators have missing data. When it is required to provide a general classification of academic institutions or to examine the “best performers” in a given country, U-Multirank classifies them based on the number of “A” grades (the maximum grade) that an institution receives. Other grades are used only when there are ties between two or more institutions. This is a questionable rule because it makes little distinction between “B”, “E”, or missing data. The present paper considers two alternative options to create a general ranking. The first calculates the single average for all 36 indicators measured by U-Multirank. It has the advantage of considering all the available data, thus recognizing the efforts of to report data and increase their scores, even if they do not reach an “A”. The downside to this approach is that the dimensions have different numbers of indicators, ranging from 4 to 11, so dimensions with a higher number of indicators will have more weight on the final classification. To address this, a second alternative is proposed. We calculate the average for each dimension first, and then the average for the five grades given to the dimensions. While there is no perfect solution to build a general ranking using U-Multirank, which is sometimes necessary and performed by U-Multirank, the present paper will use this last option to select the “best” 300 performers in Europe in 2020, as it assigns equal weight to each dimension.
After compiling this list of institutions, the correlations among all pairs of indicators of the same dimension are calculated and analyzed. Similarly, the correlations among the averages of each dimension are computed. The purpose of calculating these correlations is to study how the dimensions and indicators are correlated, so as to understand the level of independence between the indicators and dimensions. Some of them are expected to have high correlations. For instance, the absolute number of publications, the normalized number of publications, and the number of top-cited publications are likely to be strongly correlated. It is expected that institutions with high numbers in one of these indicators will present high numbers in all of them. Examining these correlations is important because they provide an indication on whether we are actually measuring 5 dimensions and 36 indicators, or if some of them are merely different forms of measuring the same aspect under a different question.
Concerning dimensions, this paper examines the statistical correlations among all dimensions to determine whether institutions present homogeneous performances across the different dimensions or if they are more focused on specific ones. For example, the paper investigates if the best performers in “teaching and learning” also excel in “research” or any other dimension. Exploring the correlations between dimensions is also interesting, as Capes’ traditional evaluation is focused on the “research” dimension. Thus, it is interesting to understand how this dimension is usually related to others in multidimensional rankings.
A BRIEF HISTORY OF INTERNATIONAL RANKINGS
International rankings for academic evaluations emerged in the 2000s (Calderón & França, 2018a), with the goal of identifying academic institutions that could be considered “world class institutions”. The first international academic ranking was the Academic Ranking of World Universities (ARWU) (Shanghai Ranking, 2023), also known as the Shanghai Ranking, created in 2003 by the University of Shanghai, in China (Calderón & França, 2018a). This ranking was created to provide information for the Chinese government to select international educational institutions to send Chinese students abroad, and also to analyze the status of Chinese institutions in terms of international standards.
Inspired by this ranking, additional international rankings emerged. These include the Webometrics Ranking of World Universities (Ranking Web of Universities, 2023; Aguillo et al., 2008) in 2004 and the THE-QS ranking in the same year. Later, in 2010, THE-QS was split into the Times Higher Education World University Rankings (THE) (Times Higher Education, 2023) and the QS World University Rankings (QS) (QS World University Rankings, 2023). Following this success, numerous countries developed regional or national rankings. This was especially notable because international rankings do not usually reflect results of smaller and local academic institutions across all regions of the world (Righetti, 2019; Shin & Toutkoushian, 2011).
U-Multirank
The concept of a multidimensional ranking emerged in a conference held in 2008 (Vught & Ziegele, 2012), during the French Presidency of the European Union. The need for a new methodology to evaluate various dimensions of quality in higher education institutions was identified. This idea led to the development of U-Multirank, which lists 1,759 universities from 92 countries in its 2020 version. It comprised approximately 5,000 faculties and over 11,400 courses spanning 28 subject areas (U-Multirank, 2023a).
As previously mentioned, U-Multirank was not designed to formulate a general classification of educational institutions. Classifications are only provided within each performance indicator, and the indicators are grouped into dimensions. Consequently, this ranking presents institutional performances showing the strengths and weaknesses of each of them in each indicator and dimension. Considering these points, users can create their own ranking by selecting the dimensions and indicators they deem more important for their own needs. Another common justification for multidimensionality is that one-dimensional rankings are not robust, since small changes in the weights of currently employed indicators can significantly change results, which greatly reduces the validity of these one-dimensional rankings.
In U-Multirank, institutions are classified into five performance groups for each indicator: “A” (very good), “B” (good), “C” (average), “D” (below average) and “E” (weak). This is done to reduce accuracy problems, as grouping can filter out small differences arising from numbers below the accuracy of measurements. Therefore, accuracy issues only on the borderlines between the performance groups, which minimizes the problem. A consequence of this grouping is that a large number of institutions end up with the same grades.
A closer look at the U-Multirank shows that indicators derived from sources unrelated to the institutions under evaluation, such as the number of publications and citations, are available for all institutions and exhibit a high level of reliability. Conversely, information obtained from questionnaires, such as place of work of graduates and time of graduation, is not always available and lacks a high level of accuracy. Additionally, certain data are categorized as “not-applicable”, such as the number and job location of graduates in master programs for institutions where master programs are not offered, etc.
Figure 1 shows a classical view summarizing U-Multirank results (U-Multirank, 2020a), while Table 1 shows in detail U-Multirank’s dimensions and indicators, in a different, easier-to-see format. The circle and Table 1 show the ranking’s five dimensions: “teaching and learning” (green), “research” (pink), “knowledge transfer” (blue), “international orientation” (orange) and “regional engagement” (purple). Each of these is divided into indicators as follows.
Teaching and learning: (1) bachelor graduation rate; (2) masters graduation rate; (3) graduating on time (bachelors); (4) graduating on time (masters).
Research: (5) external research income; (6) research publications (size- normalized); (7) art-related output; (8) citation rate; (9) top-cited publications; (10) interdisciplinary publications; (11) post-doc positions.
Knowledge transfer: (12) income from private sources; (13) co-publications with industrial partners; (14) patents awarded (size-normalized); (15) industry co-patents; (16) spin-offs; (17) publications cited in patents; (18) income from continuous professional development.
International orientation: (19) foreign language bachelor programs; (20) foreign language master programs; (21) student mobility; (22) international academic staff; (23) international doctorate degrees; (24) international joint publications.
Regional engagement: (25) bachelor graduates working in the region; (26) student internships in the region; (27) regional joint publications; (28) income from regional sources; (29) master graduates working in the region.
More details can be found in the U-Multirank’s book of indicators (U-Multirank, 2020b), where all calculations for obtaining the indicators are explained. It is important to mention that the 2020 version of the U-Multirank has 36 indicators, but this classical figure and the respective table - Figure 1 and Table 1 - show only 29 of them. Besides those, we have the following ones: i) Research: research publications (absolute numbers), strategic research partnerships, professional publications and open access publications; ii) Knowledge transfer: patents awarded (absolute numbers); iii) Regional engagement: research publications with industrial partners.
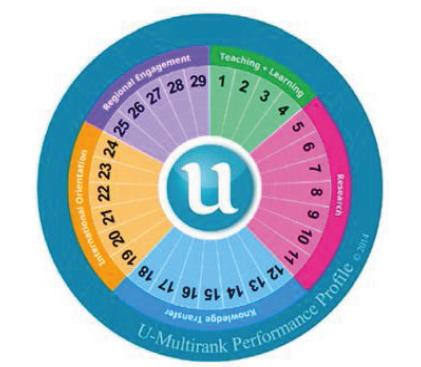
TABLE 1 Dimensions and indicators of the U-Multirank
| TEACHING AND LEARNING | RESEARCH | KNOWLEDGE TRANSFER | INTERNATIONAL ORIENTATION | REGIONAL ENGAGEMENT |
|---|---|---|---|---|
| Bachelor graduation rate | External research income | Income from private sources | Foreign language bachelor programs | Bachelor graduates working in the region |
| Masters graduation rate | Research publications (size-normalized) | Co-publications with industrial partners | Foreign language master programs | Student internships in the region |
| Graduating on time (bachelors) | Art-related output | Patents awarded (size-normalized) | Student mobility | Regional joint publications |
| Graduating on time (masters) | Citation rate | Industry co-patents | International academic staff | Income from regional sources |
| Top-cited publications | Spin-offs | International doctorate degrees | Master graduates working in the region | |
| Interdisciplinary publications | Publications cited in patents | International joint publications | ||
| Post-doc positions | Income from continuous professional development |
Source: U-Multirank (2020a).
In comparison with the tables generated by the website, we can see that 7 of the 36 indicators shown do not appear in the graphical format: research publications (absolute numbers), strategic research partnerships, professional publications, open access publications, patents awarded (absolute numbers), graduate companies and regional publications with industrial partners.
Each of the bars representing the indicators is divided into five parts and painted in dark color to represent the grade received in that indicator. This means that a full dark bar represents an “A”, while a full light bar represents “no data available”.
CREATING A GENERAL CLASSIFICATION USING U-MULTIRANK
There are many ways to create a general classification using U-Multirank. When prompted for such, U-Multirank uses a classification similar to an “Olympic medals table”, considering the best performers as the institutions that obtained the highest number of “A” grades. “B” grades and below are only used for tiebreakers. This implies, for example, that an institution with 20 “A” grades and 16 “E” grades appears ahead of an institution with 19 “A” grades and 17 “B” grades. This is a questionable rule to make a general classification, as it hardly discerns “B” from “E”. In extreme cases, institutions may focus on a smaller number of indicators and totally neglect others in order to obtain a better classification, providing poor services to their students in some respects.
The present paper proposes two other rules to make a general ranking that considers all grades. The first is the simple average of all indicators presented. It considers all the data available, but assigns the same weight to all the indicators, without considering the dimensions proportionally. The reason is that the number of indicators varies from 4 to 11, depending on the dimension. Therefore, some dimensions would have much more weight than others on the final grade.
To solve this problem, an alternative method is proposed for creating a general evaluation. This approach calculates the averages within each dimension and then computes the global average using the grades of each dimension. It assigns equal weight to each dimension, and different weights to the indicators.
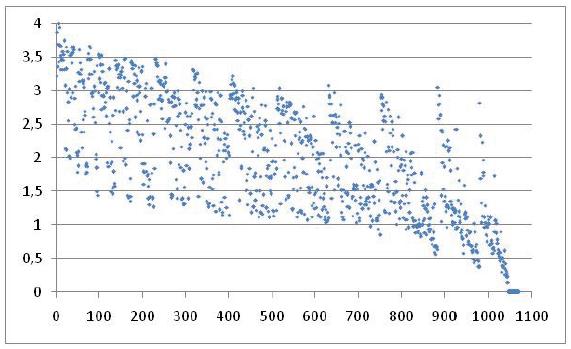
To illustrate the impact of the rules defined by U-Multirank, Figure 2 shows the average of the dimensions on the vertical axis as a function of the position of academic institutions as provided by U-Multirank on the horizontal axis. This study includes all 1,070 European academic institutions listed in the 2020 version of the ranking. While there is a tendency for higher averages among the best performers, this correlation is not strong, as evident in Figure 2. Many institutions with grades above 2.5 are among the last 300 positions in the general ranking. This shows that the rules defined by U-Multirank to make general classifications need to be considered carefully and even revised.
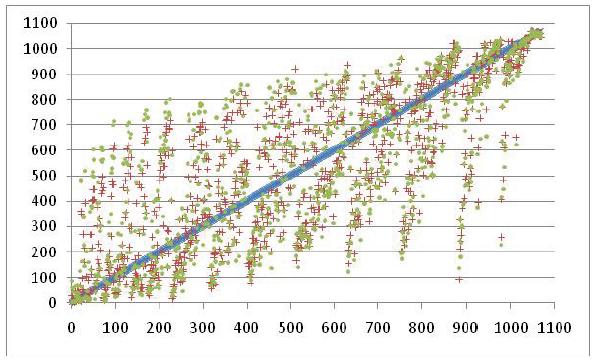
To examine this point more deeply, Figure 3 shows the results of the three approaches to general classification. The horizontal axis shows the position in the ranking generated by U-Multirank, using only the numbers of “A” grades. On the vertical axis, the results are represented as follows: the positions of institutions as provided by U-Multirank are represented by blue dots; the positions obtained from the average of indicators, by red dots; and the positions obtained from the average of dimensions are shown as green dots. The 1,070 European academic institutions listed in the 2020 version of U-Multirank were also used here. European countries were used because they have more complete databases compared with countries in other continents.
Source: Author’s elaboration.
FIGURE 2 Average of dimensions, on the vertical axis, as a function of the position of the academic institution as provided by U-Multirank, on the horizontal axis
Source: Author’s elaboration.
FIGURE 3 Positions of the 1,070 European academic institutions according to U-Multirank (blue dots), average of indicators (red dots) and average of dimensions (green dots) as a function of the positions provided by U-Multirank
It is evident that the differences in positions are substantial. Statistical correlations were calculated for each pair of classifications, and the results are as follows: U-Multirank versus average of indicators: 0.8035; U-Multirank versus average of dimensions: 0.6179; average of indicators versus average of dimensions: 0.8403. This means that using the averages of indicators and dimensions yields the best similarities in results, while using the rules adopted by U-Multirank produces less correlated results, particularly when compared with the results obtained from the average of dimensions. The alternative with the average of dimensions appears to be the most reasonable for making a general classification, so it is employed here to select the “best 300 performers” in Europe in 2020.
Of course, the effects of missing or “not applicable” data are present in all classifications. They do not count as an A in the classification made by U-Multirank, and they count as 0 (zero) in the classifications using the average of indicators or the average of dimensions. The effects will be stronger in these last two, but the present paper finds it fair to penalize the institutions that did not return data, which is the only reason for the missing data. “not applicable” data occurs on a much smaller scale and the differences it produces are not enough to affect the conclusions of the statistical studies made here.
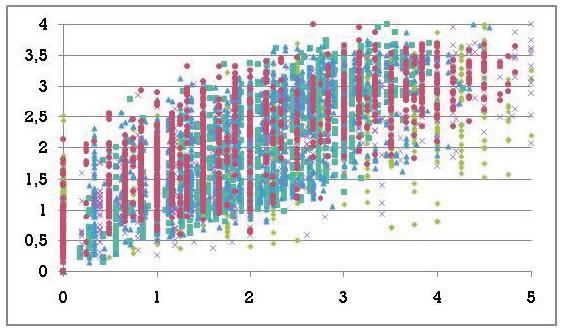
To obtain the average of dimensions, it is first necessary to calculate the average for each dimension of U-Multirank. Then, it is interesting to examine the distribution of those averages. For a first overview, we designed Figure 4. The horizontal axis shows the average of dimensions for each institution. In the vertical axis, we have the average for “teaching and learning” (in light green diamonds), “research” (in dark green squares), “knowledge transfer” (in blue triangles), “international orientation” (in red circles) and “regional engagement” (in purple X). The 1,070 European academic institutions listed in the 2020 version of U-Multirank were also used here.
A cloud of dispersed points tending to a positive correlation is observed, meaning that the grades in individual dimensions tend to be higher for institutions with a higher average of dimensions. This is an expected fact, of course, but Figure 4 illustrates these evolutions in greater detail. The presence of vertical lines is noticeable, indicating the interval of grades in each dimension for a given average of the dimension. They have a considerable magnitude, nearly two units in most cases, which is half of the total interval presented, as the averages are in the interval from 0 to 4.
These results show that the average of dimensions varies significantly for each academic institution because they do not have homogeneous performances across all dimensions, even for European countries. This indicates that making a general classification is not a good idea as it would conceal diverse performances, and there are no reasons to consider one dimension better than another, at least in general.
MAKING A GENERAL CLASSIFICATION USING U-MULTIRANK
Next, we conduct a more in-depth study on the amount of missing and available data in U-Multirank, as well as on the origin of this data, i.e., whether it comes from an open source or is provided by the institutions. The goal is to obtain a better understanding of each indicator, identifying those that are weaker or stronger measurements in the ranking, considering their source and availability. We will once again use the data available for the 300 best performers in European countries in the 2020 version of the ranking.
Table 2 shows all indicators used by U-Multirank, divided into the five dimensions. It provides the description of each indicator, the amounts of available data, missing data, and data labeled as “not applicable”, along with the source of data categorized into two groups: IQ, meaning data obtained from questionnaires answered by the institutions; and IND, representing data available from inde- pendent sources, like Web of Science.
TABLE 2 U-Multirank indicators for the 300 best European performers in 2020
| DATA AVAILABLE | MISSING DATA | NOT APPLICABLE | SOURCE | |
|---|---|---|---|---|
| Teaching and learning | 1,150 (95.83%) | 50 (4.17%) | 0 (0.00%) | |
| Bachelor graduation rate | 287 | 13 | 0 | IQ |
| Masters graduation rate | 278 | 22 | 0 | IQ |
| Graduating on time (bachelors) | 291 | 9 | 0 | IQ |
| Graduating on time (masters) | 294 | 6 | 0 | IQ |
| Research | 2,687 (81.42%) | 511 (15.49%) | 102 (3.09%) | |
| Citation rate | 275 | 0 | 25 | IND |
| Research publications (absolute numbers) | 300 | 0 | 0 | IND |
| Research publications (size-normalized) | 300 | 0 | 0 | IND |
| External research income | 299 | 1 | 0 | IQ |
| Art-related output | 190 | 109 | 1 | IQ |
| Top-cited publications | 275 | 0 | 25 | IND |
| Interdisciplinary publications | 275 | 0 | 25 | IND |
| Post-doc positions | 283 | 16 | 1 | IQ |
| Strategic research partnerships | 0 | 300 | 0 | IQ |
| Professional publications | 215 | 85 | 0 | IQ |
| Open access publications | 275 | 0 | 25 | IND |
| Knowledge transfer | 2,181 (80.78%) | 265 (9.81%) | 254 (9.41 %) | |
| Co-publications with industrial partners | 275 | 0 | 25 | IND |
| Income from private sources | 281 | 19 | 0 | IQ |
| Patents awarded (absolute numbers) | 298 | 2 | 0 | IND |
| Patents awarded (size-normalized) | 298 | 2 | 0 | IND |
| Industry co-patents | 91 | 5 | 204 | IND |
| Spin-offs | 256 | 44 | 0 | IQ |
| Publications cited in patents | 275 | 0 | 25 | IND |
| Income from continuous professional development | 266 | 34 | 0 | IQ |
| Graduate companies | 141 | 159 | 0 | IQ |
| International orientation | 1,713 (95.17%) | 53 (2.94%) | 34 (1.89%) | |
| Foreign language bachelor programs | 286 | 9 | 5 | IQ |
| Foreign language master programs | 298 | 1 | 1 | IQ |
| Student mobility | 289 | 11 | 0 | IQ |
| International academic staff | 294 | 6 | 0 | IQ |
| International joint publications | 275 | 0 | 25 | IND |
| International doctorate degrees | 271 | 26 | 3 | IQ |
| Regional engagement | 1,527 (84.83%) | 223 (12.39%) | 50 (2.78%) | |
| Bachelor graduates working in the region | 228 | 72 | 0 | IQ |
| Master graduates working in the region | 248 | 52 | 0 | IQ |
| Student internships in the region | 230 | 70 | 0 | IQ |
| Regional joint publications | 275 | 0 | 25 | IND |
| Income from regional sources | 271 | 29 | 0 | IQ |
| Regional publications with industrial partners | 275 | 0 | 25 | IND |
Source: Author’s elaboration.
Note: IQ: questionnaire answered by the academic institution; IND: independent data.
In global terms, for the top 300 performers among the European academic institutions listed in the 2020 ranking, we expect 10,800 grades, considering the existence of 36 indicators. However, it is noted that we have only 9,258 grades available, which corresponds to 85.72%. We also have 1,102 instances of missing data (10.20%) and 440 instances of data (4.08%) that were considered as “not applicable”. This means that we have around 15% blank data for this select group of academic institutions, which is not negligible.
It is also noted that the distribution of missing data is not uniform, making some indicators more complete than others. Based on Table 2, it was possible to create Figure 5, which presents the amount of data available per indicator. A review of this information reveals a significant imbalance between the indicators regarding data availability.
The most noticeable feature is the existence of two indicators that are very weak from this perspective, with less than 100 (33%) grades available: “strategic research partnerships”, which has only missing data, and “industry co-patents”, with 91 grades available, 5 missing, and 204 “not applicable”. Since we have another 34 indicators which are more complete, those two indicators will be excluded from the statistical analysis from now on, in order to avoid the influence of large numbers of unavailable data.
For the remaining indicators, we have one (“graduate companies”) below 50% and above 33% available data; one in the range 50%-66% (“art-related output”), and two in the range 66%-75% (“professional publications” and “spin-offs”). Thus, there are 30 indicators with more than 75% available data, representing 83.33% of indicators.
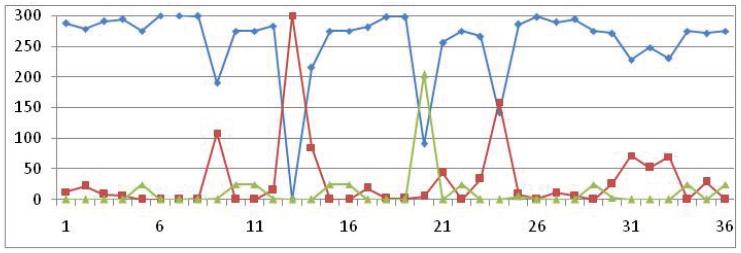
Source: Author’s elaboration.
FIGURE 5 Amount of available data (blue), missing data (red) and not applicable data (green) for the 36 indicators measured for the 300 top performers among the European academic institutions listed
Regarding dimensions, we have 95.83% available data for “teaching and learning”, 81.42% for “research”, 80.78% for “knowledge transfer”, 95.17% for “international orientation”, and 84.83% for “regional engagement”. In this respect, “teaching and learning” and “international orientation” stand out as the most reliable dimensions, with percentages above 95%, but the other dimensions also present acceptable numbers, all of which above 80%.
Next, Table 3 shows the amount of data obtained from independent sources and provided by academic institutions. There are 22 indicators obtained through questionnaires (61.11%) and 14 indicators (38.89%) obtained from independent sources. This fact indicates that this ranking’s results rely heavily on data reported by academic institutions. This means that a complete database is essential, and U-Multirank’s applicability varies between geographic regions, as the lack of data varies greatly from one country to the next. Looking at each dimension, we can see that “teaching and learning” has no data from open sources, “research” (54.55%) and “knowledge transfer” (55.56%) derive a little more than half of their data from open sources, and “international orientation” and “regional engagement” collect only 16.67% and 33.33% of their data from open sources, respectively. Thus, more efforts are recommended to motivate institutions to report their data in the most complete possible manner.
TABLE 3 Amount of data obtained from independent sources and questionnaires answered by institutions for each dimension
| DIMENSION | TEACHING AND LEARNING | RESEARCH | KNOWLEDGE TRANSFER | INTERNATIONAL ORIENTATION | REGIONAL ENGAGEMENT |
|---|---|---|---|---|---|
| IQ | 4 (100%) | 5 (45.45%) | 4 (44.44%) | 5 (83.33%) | 4 (66.67%) |
| IND | 0 (0.00%) | 6 (54.55%) | 5 (55.56%) | 1 (16.67%) | 2 (33.33%) |
Source: Author’s elaboration.
Looking deeper into indicators’ definitions, we can see that they are very objective, clearly defined and based on numbers with pre-defined rules (U-Multirank, 2020b). There are no results based on “reputation”, where the international academic and industrial communities choose the best academic institutions based on their experience and personal ideas, rather than on numbers. In this respect, this ranking differs substantially from one-dimensional rankings. For example, the Times Higher Education World University Rankings - THE (Times Higher Education, 2023) assigns a 33% weight to reputation-related Indicators in its final classification, and the QS World University Rankings - QS (QS World University Rankings, 2023) assigns even more, reaching 50%. This aspect is a strong characteristic of U-Multirank. However, despite being very objective, 61.11% of the data comes from the institutions, and many of them are still not reporting properly. This is reason for concern, and there is room for improvement on this point.
ANALYZING THE CORRELATIONS FOR ALL INDICATORS AND DIMENSIONS
The next point to be studied here is the behavior of the statistical correlations for different indicators and dimensions of U-Multirank. This is a very important aspect because high correlations among many indicators would indicate that we are not really measuring 36 indicators, as some of them may be redundant; we might thus be looking at similar aspects, just using different questions. This could be a strong point against U-Multirank’s results and multidimensional characteristics, the latter being its main new aspect.
These measurements can also help predict the behaviors of institu- tions when evaluated by multidimensional rules and understand whether the institutions considered in the present paper have homogeneous or heterogeneous performances in different dimensions.
The 300 best performers in Europe in the 2020 edition of U-Multirank were used for this study. This sample was chosen not only because these institutions have more complete data sets, as explained earlier, but also due to the advantage of belonging to the same continent, which can reduce effects from very different cultures and other particularities, leaving the focus on the indicators and dimensions used by the ranking.
The most important statistical tool used for the analysis made here is the correlation coefficient, which is defined by:
In this equation, X and Y are the values of the two variables under study, and “n” is the number of data pairs. The result is a number in the range from -1 to 1. A value -1 informs that the variables are inversely related in an exactly linear way. Thus, when one variable increases, the other decreases. The value 1 informs that the variables are related in a direct and exactly linear way and when one variable increases, the other also increases. A value 0 means that the variables are not linearly related. Intermediate values indicate that the variables are partially related, either directly (if the coefficient is positive) or inversely (if the coefficient is negative). For the present study, we consider the following interpretations for those numbers: -0.19 to 0.19: very weak correlation; -0.20 to -0.39 and 0.20 to 0.39: weak correlation; -0.40 to -0.69 and 0.40 to 0.69: moderate correlation; -0.70 to -0.89 and 0.70 to 0.89: strong correlation; -0.90 to -1.00 and 0.90 to 1.00: very strong correlation. The first results are presented in Table 4, which shows the correlations between all five dimensions of U-Multirank for the 300 top performers in Europe in 2020.
First, it is observed that there are no strong or very strong correlations among the dimensions, and only two moderate correlations appear: a positive one between “research” and “knowledge transfer”, and a negative one between “research” and “regional engagement”. This is very good for the ranking because it shows that we are close to having five independent dimensions under study. To better illustrate those moderate correlations, Figure 6 shows the distribution of grades for both of them: (a) presents the data for “research” and “knowledge transfer” (a correlation of 0.5509); and (b) shows the data for “research” and “regional engagement” (a correlation of -0.4175). They are typical plots of moderate positive and nega- tive correlations.
TABLE 4 Correlations between U-Multirank dimensions for the 300 top performers in Europe in 2020
| RESEARCH | KNOWLEDGE TRANSFER | INTERNATIONAL ORIENTATION | REGIONAL ENGAGEMENT | |
|---|---|---|---|---|
| Teaching and learning | -0.3745 | -0.2940 | -0.1507 | 0.2021 |
| Research | 0.5509 | 0.3613 | -0.4175 | |
| Knowledge transfer | 0.3123 | -0.2344 | ||
| International orientation | -0.3168 |
Source: Author’s elaboration.
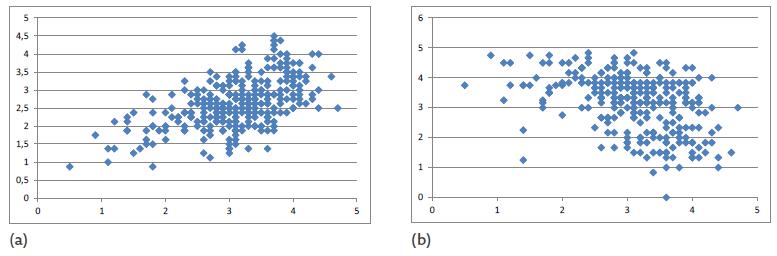
Source: Author’s elaboration.
FIGURE 6 Distribution of grades for: (a) research (horizontal axis) and knowledge transfer (vertical axis), with a correlation of 0.5509; and (b) research (horizontal axis) and regional engagement (vertical axis), with a correlation of -0.4175
The real meaning of these moderate correlations is that the institutions tend to have similar performances in “research” and “knowledge transfer” and opposite performances in “research” and “regional engagement”.
Although the correlations are weak, the negative numbers with a magnitude above 0.2500 stand out for the following dimension pairs: “teaching and learning” and “research”; “teaching and learning” and “knowledge transfer”; and “knowledge transfer” and “international orientation”. This means that they have some level of opposite performances.
Likewise, the positive weak correlations with a magnitude larger than 0.2500 stand out for these dimension pairs: “research” and “international orientation”; and “knowledge transfer” and “international orientation”. This means that they have slightly similar performances.
Still, as a general conclusion, the dimensions are not very correlated, which means that we are measuring different aspects of these academic institutions, and that they do not have an homogeneous performance across the dimensions. They may perform outstandingly in one dimension and not so well in others.
This independence between dimensions increases even further the importance of a multidimensional ranking not designed to make general classifications of academic institutions. A general classification would use an average of dimensions and indicators which are not correlated, thus hiding the strengths and weaknesses of institutions.
CORRELATIONS BETWEEN THE INDICATORS OF ALL DIMENSIONS
The present paper now focuses on the correlations between indicators of the same dimension, for all dimensions measured by U-Multirank. The first is “teaching and learning”. The results are shown in Table 5.
TABLE 5 Correlations between the indicators in the “teaching and learning” dimension
| MASTERS GRADUATION RATE | GRADUATING ON TIME (BACHELORS) | GRADUATING ON TIME (MASTERS) | |
|---|---|---|---|
| Bachelor graduation rate | 0.0254 | 0.3118 | 0.0261 |
| Masters graduation rate | -0.1179 | -0.0721 | |
| Graduating on time (bachelors) | 0.6496 |
Source: Author’s elaboration.
Table 5 shows that there are no strong or very strong correlations between the indicators, and a single moderate correlation (a positive one) between “graduating on time (bachelors)” and “graduating on time (masters)”. This means that in institutions whose students graduate on time, this occurs for both levels, master and bachelor, with a moderate correlation among them. The other correlations are weak, meaning that while “teaching and learning” has only four indicators, they have a good level of independence and are therefore adequate to measure this dimension. In sum, the average of the magnitudes for all indicators of this dimension is 0.2005, with a standard deviation of 0.2443. This is the lowest average among all dimensions. These results validate this dimension for the studied group of institutions.
Next, the “research” dimension is considered. Table 6 shows the correlations for the indicators in this dimension. The results show that there is only one very strong correlation, for indicators “citation rate” and “top-cited publications”. They have a correlation index of 0.9402, indicating a near-perfect positive relation. This means that the institutions with more citations are also the ones that have the most cited publications. While this fact is not surprising, the high value of this index suggests that we have nearly the same ranking for both indicators, therefore these indicators are redundant.
Subsequently, the second-highest correlation coefficient is found between “research publications (absolute numbers)” and “research publications (size-normalized)”, with a value of 0.6953, just on the limit with a strong correlation. This means that the rankings for total publications and publications by faculty member are similar, but not the same. I believe that the number of publications by faculty member is a better indicator, since it is not correct to compare such numbers for institutions of different sizes, though the results are not so different.
TABLE 6 Correlations between the indicators in the “research” dimension
| RESEARCH PUBLICATIONS (ABSOLUTE NUMBERS) | RESEARCH PUBLICATIONS (SIZE-NORMALIZED) | EXTERNAL RESEARCH INCOME | ART-RELATED OUTPUT | TOP-CITED PUBLICATIONS | INTERDISCIPLINARY PUBLICATIONS | POST-DOC POSITIONS | PROFESSIONAL PUBLICATIONS | OPEN ACCESS PUBLICATIONS | |
|---|---|---|---|---|---|---|---|---|---|
| Citation rate | 0.5130 | 0.5188 | 0.4120 | -0.3294 | 0.9402 | 0.4929 | 0.3998 | -0.1824 | 0.5024 |
| Research publications (absolute numbers) | 0.6953 | 0.3725 | -0.3515 | 0.4728 | 0.4104 | 0.3667 | -0.2223 | 0.5975 | |
| Research publications (size-normalized) | 0.4768 | -0.3154 | 0.4866 | 0.3657 | 0.4500 | -0.1602 | 0.4494 | ||
| External research income | -0.1755 | 0.3776 | 0.2436 | 0.3343 | 0.0161 | 0.2179 | |||
| Art-related output | -0.2931 | -0.0916 | -0.1657 | 0.3823 | -0.2368 | ||||
| Top-cited publications | 0.4391 | 0.3641 | -0.1676 | 0.4458 | |||||
| Interdisciplinary publications | 0.1648 | -0.1228 | 0.5537 | ||||||
| Post-doc positions | 0.0567 | 0.2234 | |||||||
| Professional publications | -0.2622 |
Source: Author’s elaboration.
There are 11 more moderate correlations, as shown in Table 6. In general, the average magnitude for all indicators in this dimension is 0.3515, and the standard deviation is 0.1763. While this is the highest average among all dimensions, it is not high enough to render the indicators redundant. Therefore, the results also validate this dimension for the group of institutions studied here.
Some interesting facts about the correlations are noted. The indicator “external research income” has no strong or very strong correlation with any other indicator. This means that, in general, this external income does not generate more publications, citations, art-related products, etc. The same holds for “post-doc positions”, which does not significantly affect those productions.
We now focus on the “knowledge transfer” dimension. Table 7 displays the correlations between the indicators within this dimension.
The results show that while there are no very strong correlations, two strong correlations exist. The first one involves the indicators “patents awarded (absolute numbers)” and “patents awarded (size-normalized)”, with a correlation index of 0.8077. This means that the institutions that are good at delivering new products have good grades in both indicators, therefore, these indicators are highly redundant.
The second strong correlation is found between the indicators “co-publications with industrial partners” and “spin-offs”, thus showing a connection between industrial outputs. They have a correlation index of 0.7197, therefore, they, too, are highly redundant.
There are also four moderate correlations, as shown in Table 7. The average magnitude for all indicators in this dimension is 0.2722, and the standard deviation is 0.1985. This shows that this dimension has a robust set of indicators, with only one redundancy out of seven indicators in the group of institutions used here.
TABLE 7 Correlations between the indicators in the “knowledge transfer” dimension
| INCOME FROM PRIVATE SOURCES | PATENTS AWARDED (ABSOLUTE NUMBERS) | PATENTS AWARDED (SIZE-NORMALIZED) | INDUSTRY CO-PATENTS | SPIN-OFFS | INCOME FROM CONTINUOUS PROFESSIONAL DEVELOPMENT | GRADUATE COMPANIES | |
|---|---|---|---|---|---|---|---|
| Co-publications with industrial partners | 0.2249 | 0.4883 | 0.4691 | -0.0155 | 0.7197 | -0.2425 | -0.2946 |
| Income from private sources | 0.1440 | 0.2254 | 0.0656 | 0.1579 | 0.2563 | -0.1031 | |
| Patents awarded (absolute numbers) | 0.8077 | 0.1692 | 0.5578 | -0.2382 | -0.2779 | ||
| Patents awarded (size-normalized) | 0.2253 | 0.5110 | -0.1874 | -0.2030 | |||
| Industry co-patents | 0.0034 | -0.1893 | 0.1707 | ||||
| Spin-offs | -0.2198 | -0.3969 | |||||
| Income from continuous professional development | 0.0566 |
Source: Author’s elaboration.
We now focus on the “international orientation” dimension. Table 8 displays the correlations between the indicators in this dimension.
The results show that there are neither very strong nor strong correlations between indicators in this dimension; only two moderate correlations are observed. Thus, the indicators within this dimension can be considered independent from each other. The average magnitude for all indicators in this dimension is 0.2451, with a standard deviation of 0.1278. These findings validate this dimension for the group of institutions under study.
Next, we analyze the “regional engagement” dimension, and the results are presented in Table 9. They show the absence of a very strong correlation, though there is a strong correlation between indicators in this dimension. This correlation is observed between the indicators “bachelor graduates working in the region” and “master graduates working in the region”, with a correlation coefficient of 0.7668. This correlation is not surprising, given the similarity of these indicators. Essentially, this means that institutions which have a great number of bachelors graduating and working in the region also have masters doing so. Apart from that, there is only one moderate correlation. Therefore, the indicators of this dimension can also be considered independent of each other, except for one. The average magnitude for all indicators in this dimension is 0.2483, with a standard deviation of 0.2001. These results validate this dimension for the group of institutions under study.
TABLE 8 Correlations between the indicators in the “international orientation” dimension
| FOREIGN LANGUAGE MASTER PROGRAMS | STUDENT MOBILITY | INTERNATIONAL ACADEMIC STAFF | INTERNATIONAL JOINT PUBLICATIONS | INTERNATIONAL DOCTORATE DEGREES | |
|---|---|---|---|---|---|
| Foreign language bachelor programs | 0.4607 | 0.0519 | 0.0596 | -0.1789 | -0.0975 |
| Foreign language master programs | 0.2201 | 0.4195 | 0.2102 | 0.2308 | |
| Student mobility | 0.2891 | 0.1949 | 0.1818 | ||
| International academic staff | 0.3810 | 0.3138 | |||
| International joint publications | 0.3868 |
Source: Author’s elaboration.
TABLE 9 Correlations between the indicators in the “regional engagement” dimension
| MASTER GRADUATES WORKING IN THE REGION | STUDENT INTERNSHIPS IN THE REGION | REGIONAL JOINT PUBLICATIONS | INCOME FROM REGIONAL SOURCES | REGIONAL PUBLICATIONS WITH INDUSTRIAL PARTNERS | |
|---|---|---|---|---|---|
| Bachelor graduates working in the region | 0.7668 | 0.3682 | -0.1083 | 0.2238 | -0.2295 |
| Master graduates working in the region | 0.3468 | -0.0546 | 0.2437 | -0.1699 | |
| Student internships in the region | -0.0685 | 0.2658 | -0.2005 | ||
| Regional joint publications | -0.0618 | 0.5596 | |||
| Income from regional sources | -0.0565 |
Source: Author’s elaboration.
Table 10 presents the means and standard deviations of the magnitudes of the correlation coefficients between the indicators of each dimension. It allows independence between the indicators, with a maximum average correlation coefficient of 0.3515, which occurs for the “research” dimension, which is the highest average. It confirms that the dimensions and indicators selected by “U-Multirank” constitute a good set for evaluating academic institutions, with few cases of redundancy among the set of indicators.
TABLE 10 Averages and standard deviations for the magnitudes of indicators in each dimension
| DIMENSION | TEACHING AND LEARNING | RESEARCH | KNOWLEDGE TRANSFER | INTERNATIONAL ORIENTATION | REGIONAL ENGAGEMENT |
|---|---|---|---|---|---|
| Average | 0.2005 | 0.3515 | 0.2722 | 0.2451 | 0.2483 |
| Standard deviation | 0.2443 | 0.1763 | 0.1985 | 0.1278 | 0.2001 |
Source: Author’s elaboration.
CONCLUSIONS
This paper conducted a study of the international multidimensional academic ranking U-Multirank, which comprises 5 dimensions and 36 indicators. This ranking was studied by Capes during the preparation of its new evaluation for post-graduate programs in Brazil (Coordenação de Aperfeiçoamento de Pessoal de Nível Superior [Capes], 2019). This fact justifies the need for further research into this ranking using data currently available, so as to gain insights into the types of results it might yield when applied in Brazil.
U-Multirank sometimes produces a list of “best performers” by country for a given year, which is not an easy task for multidimensional rankings. We showed that there are several ways of making such a general classification. U-Multirank uses an “Olympic medals table” format, considering the best ones as the institutions that obtained the highest number of maximum grades. The present paper described some problems caused by this rule and proposed two other ways of making this general ranking, namely the simple average of all indicators and the average of dimensions, which was considered best in this paper because it uses all data available and assigns the same weight to all dimensions. This point is important as some types of classification will be required if a multidimensional evaluation is used by Capes.
The paper also analyzed missing data, revealing that this is not a negligible issue in this ranking. For the top 300 performers in Europe in 2020, there is a 10.20% data gap. However, this percentage increases when considering other continents and institutions that are not top performers.
An examination of the indicators showed that they are highly objective, clearly defined and based on numbers with pre-defined rules. The importance of reliable data from institutions is also evident, as 22 indicators (61.11%) derive from questionnaires, and only 14 indicators (38.89%) are obtained from open sources.
A summary of the average magnitudes of indicators in each dimension confirms a high level of independence between most of the indicators, with a maximum average correlation coefficient of 0.3515 for the “research” dimension, for the group of institutions examined in this paper.
Based on the 300 top performers in Europe in 2020, it can be asserted that the dimensions and indicators selected by U-Multirank constitute a robust set for evaluating academic institutions, with not many cases of redundancy in the measurements. The multidimensional approach introduced by U-Multirank is very important, as the majority of institutions do not have homogeneous performances across the dimensions, and general classifications would conceal these substantial differences.
REFERÊNCIAS
Aguillo, I. F., Bar-Ilan, J., Levene, M., & Ortega, J. L. (2010). Comparing university rankings. Scientometrics, 85, 243-256. https://doi.org/10.1007/s11192-010-0190-z [ Links ]
Aguillo, I. F., Granadino, B., Ortega, J. L., & Prieto, J. A. (2006). Scientific research activity and communication measured with cybermetric indicators. Journal of the American Society of Information Science and Technology, 57(10), 1296-1302. https://doi.org/10.1002/asi.20433 [ Links ]
Aguillo, I. F., Ortega, J. L., & Fernandez, M. (2008). Webometric ranking of world universities: Introduction, methodology, and future developments. Higher Education in Europe, 33(2/3), 234-244. https://doi.org/10.1080/03797720802254031 [ Links ]
Bernhard, A. (2012). Quality assurance in an international higher education area: A case study approach and comparative analysis. Springer. [ Links ]
Billaut, J., Bouyssou, D., & Vinke, P. (2010). Should we believe the Shanghai ranking? An MCDM view. Scientometrics, 84, 237-263. https://doi.org/10.1007/s11192-009-0115-x [ Links ]
Calderón, A. I., & França, C. M. (2018a). Os rankings acadêmicos da educação superior: Apontamentos no campo da avaliação educacional. In J. C. Rothen, & A. C. M. Santana (Ed.), Avaliação da educação: Referências para uma primeira conversa (pp. 95-114). Editora UFSCar. [ Links ]
Calderón, A. I., & França, C. M. (2018b). Rankings acadêmicos na educação superior: Tendências da literatura ibero-americana. Avaliação: Revista da Avaliação da Educação Superior, 23(2), 448-466. https://doi.org/10.1590/S1414-40772018000200010 [ Links ]
Calderón, A. I., França, C. M., & Gonçalves, A. (2017). Tendências dos rankings acadêmicos de abrangência nacional de países do espaço ibero-americano: Os rankings dos jornais El Mundo (Espanha), El Mercurio (Chile), Folha de São Paulo (Brasil), Reforma (México) e El Universal (México). EccoS Revista Científica, (44), 117-142. https://doi.org/10.5585/eccos.n44.7943 [ Links ]
Coordenação de Aperfeiçoamento de Pessoal de Nível Superior (Capes). (2019). Avaliação multidimensional de programas de pós-graduação: Relatório DAV. Capes. [ Links ]
Dill, D. D., & Soo, M. (2005). Academic quality, league tables and public policy: A cross national analysis of university ranking systems. Higher Education, 49, 499-533. https://doi.org/10.1007/s10734-004-1746-8 [ Links ]
Eccles, C. (2002). The use of university rankings in the United Kingdom. Higher Education in Europe, 27(4), 423-432. https://doi.org/10.1080/0379772022000071904 [ Links ]
Ganga-Contreras, F., Sáez, W., Calderón, A. I., Calderón, Á., & Rodríguez-Ponce, E. (2020). Principales rankings académicos internacionales: El caso de Chile. Ensaio: Avaliação e Políticas Públicas em Educação, 28(107), 407-434. https://doi.org/10.1590/S0104-40362019002701964 [ Links ]
Gonçalves, A., & Calderón, A. I. (2017). Academic rankings in higher education: Trends of international scientific literature. Revista Diálogo Educacional, 17(54), 1125-1145. https://doi.org/10.7213/1981-416x.17.054.ds03 [ Links ]
Guimarães, E. R., & Esteves, M. (2018). Sistemas de avaliação da educação superior em Portugal e Brasil. Estudos em Avaliação Educacional, 29(72), 509-630. https://doi.org/10.18222/eae.v29i72.5200 [ Links ]
Herting, H. P. (2016). Universities, rankings and the dynamics of global higher education: Perspectives from Asia, Europe and North America. Palgrave Macmillan London. [ Links ]
Liu, N. C., & Cheng, Y. (2005). The academic ranking of world universities. Higher Education in Europe, 30(2), 127-136. https://doi.org/10.1080/03797720500260116 [ Links ]
Marginson, S., & Wende, M. van der. (2007). To rank or to be ranked: The impact of global rankings in higher education. Journal of Studies in International Education, 11(3/4), 306-329. https://doi.org/10.1177/1028315307303544 [ Links ]
Prado, A. F. B. A. (2021). Performances of the Brazilian universities in the “U-Multirank” in the Period 2017-2020. SciELO Preprints. https://doi.org/10.1590/SciELOPreprints.2351 [ Links ]
Prado, A. F. B. A. (2022). Multidimensional academic evaluation using the ‘U-Multirank’. Avaliação: Revista da Avaliação da Educação Superior, 27(1), 159-182. https://doi.org/10.1590/S1414-40772022000100009 [ Links ]
QS World University Rankings. (2023). University Rankings 2023. https://www.topuniversities.com/university-rankings [ Links ]
Raan, A. F. J. van. (2005). Fatal attraction-conceptual and methodological problems in the ranking of universities by bibliometric methods. Scientometrics, 62(1), 133-143. https://doi.org/10.1007/s11192-005-0008-6 [ Links ]
Ranking Web of Universities. (2023). https://www.webometrics.info/en [ Links ]
Righetti, S. (2019). O jogo dos rankings: Como surgiram e o que medem as principais classificações de universidades do mundo. Estante Labjor. [ Links ]
Rodrigues, L. M. A., Moreira, K. D., & Martins, C. B. (2020). Estratégias organizacionais no contexto da avaliação da pós-graduação brasileira. Estudos em Avaliação Educacional, 31(77), 287-317. https://doi.org/10.18222/eae.v31i77.7383 [ Links ]
Shanghai Ranking. (2023). Academic ranking of world universities 2023. http://www.shanghairanking.com/rankings/arwu/2023 [ Links ]
Shin, J. C., & Toutkoushian, R. K. (2011). The past, present, and future of University Rankings. In J. C. Shin, R. K. Toutkoushian, & U. Teichler (Eds.), University rankings, the changing academy: The changing academic profession in international comparative perspective (vol. 3). Springer Science. [ Links ]
Shin, J. C. L., Toutkoushian, R. K., & Teicher, U. (2011). University rankings, theoretical basis, methodology and impacts on global higher education. Springer. [ Links ]
Sorz, J., Wallner, B., Seidler, H., & Fieder, M. (2015). Inconsistent year-to-year fluctuations limit the conclusiveness of global higher education rankings for university management. PeerJ, 3, Article e1217. https://doi.org/10.7717/peerj.1217 [ Links ]
Stack, M. (2016). Global university rankings and the mediatization of higher education, palgrave studies in global higher education. Palgrave Macmillan. [ Links ]
Théry, H. (2010). Classificações de universidades mundiais, “Xangai” e outras. Estudos Avançados, 24(70), 185-205. https://doi.org/10.1590/S0103-40142010000300012 [ Links ]
Times Higher Education. (2023). World university rankings 2023. https://www.timeshighereducation.com/world-university-rankings [ Links ]
U-Multirank. (2020a). U-Multirank 2020: British universities in global comparison. https://www.umultirank.org/export/sites/default/press-media/media-center/universities/2020/country-reports/UK-Country-report-2020.pdf [ Links ]
U-Multirank. (2020b). U-Multirank 2020: Indicator book 2020. https://www.umultirank.org/export/sites/default/press-media/documents/Indicator-Book-2020.pdf [ Links ]
U-Multirank. (2023a). Frequently asked questions about U-Multirank world university rankings. https://www.umultirank.org/about/u-multirank/frequently-asked-questions/ [ Links ]
U-Multirank. (2023b). U-Multirank: Universities compared. Your way. https://www.umultirank.org/ [ Links ]
Vught, F. A. van, & Ziegele, F. (Ed.). (2012). Multidimensional ranking: The design and development of U-Multirank. Springer. [ Links ]
Webster, T. J. (2001). A principal component analysis of the US News & World Report tier rankings of colleges and universities. Economics of Education Review, 20(3), 235-244. https://doi.org/10.1016/S0272-7757(99)00066-7 [ Links ]
Received: October 31, 2021; Accepted: September 19, 2023
 Este é um artigo publicado em acesso aberto sob uma licença Creative Commons
