


 Inglês (pdf)
 Artigo em XML
 Enviar este artigo por email
 Permalink
1 Introduction
Education has a transforming role in the development of citizens due to a series of factors, such as: the economic development of nations ( CARVALHO; SOUSA, 2014 ), determination and distribution of income ( NEAMTU, 2015 ) and the improvement of social markers ranging from, among others, crime rates, population health conditions, social cohesion, life expectancy and infant mortality rates ( CARVALHO; SOUSA, 2014 ).
Such aforementioned factors, hand in hand with high values of current expenditure by governments and families, have raised the interest of economic and administration science in the Education area, generating new studies (GOMES et al ., 2016; DUMCIUVIENE, 2015 ; MELHUISH, 2013 ; NEAMTU, 2015 ; SALGADO JUNIOR; NOVI, 2015; SALGADO JUNIOR et al ., 2016), which have focused on the debate related to “efficiency in Education” ( WITTE; LÓPEZ-TORRES, 2015 ). The demand for such studies emerges from the necessity of governments to balance their expenditure in the area with other essential public services, such as health and transportation (JOHNES et al ., 2017).
When evaluating Education, it is necessary to understand that quality is the most important variable to explain economic development, outweighing quantity (SALGADO JUNIOR; NOVI, 2014). The difference in economic performance among countries is related to differences in their Education levels ( MERCAN; SEZER, 2014 ). Similarly, due to internal quality differences, this phenomenon may be observed within the same country or Educational system (WU et al ., 2017).
The concept of quality in the educational area addresses structures, processes and educational outcomes ( DAVOK, 2007 ). In this sense, two distinct dimensions are approached: (i) from the institutional point of view, referred to educational quality; (ii) and from the point of view on generated results at the central main agent, the student. In the first sense, efficiency, efficacy, effectiveness and relevance of educational systems and institutions are contemplated; and in the second sense, the development of learning skills on predicted contents, knowledge of scientific-literary culture, and technical knowledge for the labor market and social transformation are considered.
Dourado and Oliveira (2009) acknowledge the recent advance in Brazil to access and coverage, especially in elementary school; however, it is necessary to improve learning process in an efficient way that improves the quality of teaching. Education is transversal to pedagogical, economic, social, cultural and political dynamics of a given society, according to Darling-Hammond and Ascher (1991) and Dourado et al. (2007). These authors claim that influencing factors are: from the social point of view, income concentration, social inequality, Education as a right, and institutional issues such as school organization and management that interfere with working conditions, school management processes, curricular dynamics, teacher training and teacher professionalization.
“There is a certain consensus that the school quality assessment theme needs to be addressed and that quality measurement must necessarily involve the use of different tools”1 ( GOUVEIA; SOUZA, 2013 , p. 841). The evaluation of the quality of Education remains a controversial issue in the literature and has been carried out through large-scale evaluations, which generally evaluate the performance of students in specific subjects, such as mathematics and reading ( FERNANDES; GREMAUD, 2009 ).
Among the criticisms of current large-scale evaluation models, it is possible to mention the limited focus, which restricts the evaluation of a multi-context and facets system to some subjects to the detriment of other expected school objectives, such as ethics and the development of some non-cognitive skills as well as the non-identification of other social development factors related to Education ( FERNANDES; GREMAUD, 2009 ).
Brazil has not presented satisfactory results in those evaluations. In the Program for International Students Assessment (Pisa), Brazil presented, in the 2015 edition, an average of 407 points in reading in comparison with the average of 493 points from other evaluated countries (OECD, 2015).
Inside national scope, the Development of Basic Education Index (Ideb) is the main quality indicator available. It is composed by two components: approval index and performance on the Prova Brasil (Brazil Exam). The introduction of Ideb by the federal government represented a significant change in the way Education has been monitored in Brazil. Passing through Ideb, the evolution of educational services offered inside the country raised, this being possible thanks to tracking the results by state, municipality and school, providing a comparative value in relation to goals, and also comparing to other schools and municipalities ( ALVES; SOARES, 2013 ).
In the Brazil Exam, the largest instrument for evaluating Brazilian basic Education, the average score in the subject of Portuguese language, in the 2015 edition, was 252 points, which was below the score obtained by students in 1995, when 256 average points were reached in the final years of elementary school ( INEP, 2016 ). In spite of the growing current expenditure in recent years, this diagnosis demonstrates the need for improvements in the country’s educational process.
Despite the strong connection identified among extra-school factors, such as the socioeconomic level of the student and family, and their educational results (ALVES et al., 2013; MATOS et al., 2017), several studies pinpoint the importance of the “school effect”, which is a part of the result of students that can be attributed to the pedagogical and management practices adopted in schools ( ALVES; SOARES, 2007 ; BLOOM et al., 2015; GONÇALVES; FRANCE, 2013; GOUVEIA; SOUZA, 2013 ; SALGADO JUNIOR; NOVI, 2015; SALGADO JUNIOR et al., 2016).
Several studies have indicated the relevance of intra-school factors in student performance, such as administrative management (BLOOM et al., 2015), low remuneration of professionals, lack of training and inadequate work environment (AMÂNCIO-VIEIRA et al., 2015), principal profile in pedagogical results ( DHUEY; SMITH, 2014 ), innovative didactic project ( DOLZ, 2016 ), offer of classes during school holidays to students at disproof risk (VANDECANDELAERE et al., 2016) and emotional factors ( PARISOTTO; RINALDI, 2016 ).
The identification of these practices is fundamental, as they can contribute to the improvement of the performance of the educational service and the results of students, allowing a systemic view of Education that encompasses pedagogical aspects as well as those related to management activities (SALGADO JUNIOR; NOVI, 2015).
In addition, since Education is a process of aggregation of knowledge, the studies that focus on improving elementary school, which is one of the most important level of Education, are essential as the experience of a child at this stage brings relevant consequences to the rest of his/her academic life ( MELHUISH, 2013 ). This Education level is also relevant due to its representativeness in the Brazilian educational system: data from the 2013 School Census indicated that 29.7 million out of the 50.5 million students enrolled in basic Education in 2012, 68.2%, studied in the municipal educational systems (REGALO et al., 2016). Among the competencies acquired in the school, reading and writing skills are of paramount importance, as students who have better reading skills, perform better in other disciplines (OLIVEIRA et al ., 2008). Apart from the benefits in the educational field, proper literacy provides the individual with economic gains, as people with higher literacy earn more than those with lower literacy levels (BRAY et al., 2014).
In light of the above, the present work aims to identify the indicators and goals for the increase in school performance in the subject of Portuguese language in municipal lower secondary Education. By using such parameters, some evidences show the improvement of students’ performance in reading and writing in the final years of elementary school.
2 Methodological aspects
In order to improve school performance and identify its indicators and goals, the methodology used was divided into two parts. The first consisted of the separation of schools that were studied according to the level of efficiency in relation to knowledge aggregation as well as the knowledge of the students of lower secondary Education, which is also called school effect. Once the level of efficiency was defined, the next move dealt with identifying the factors related to school performance and its goals.
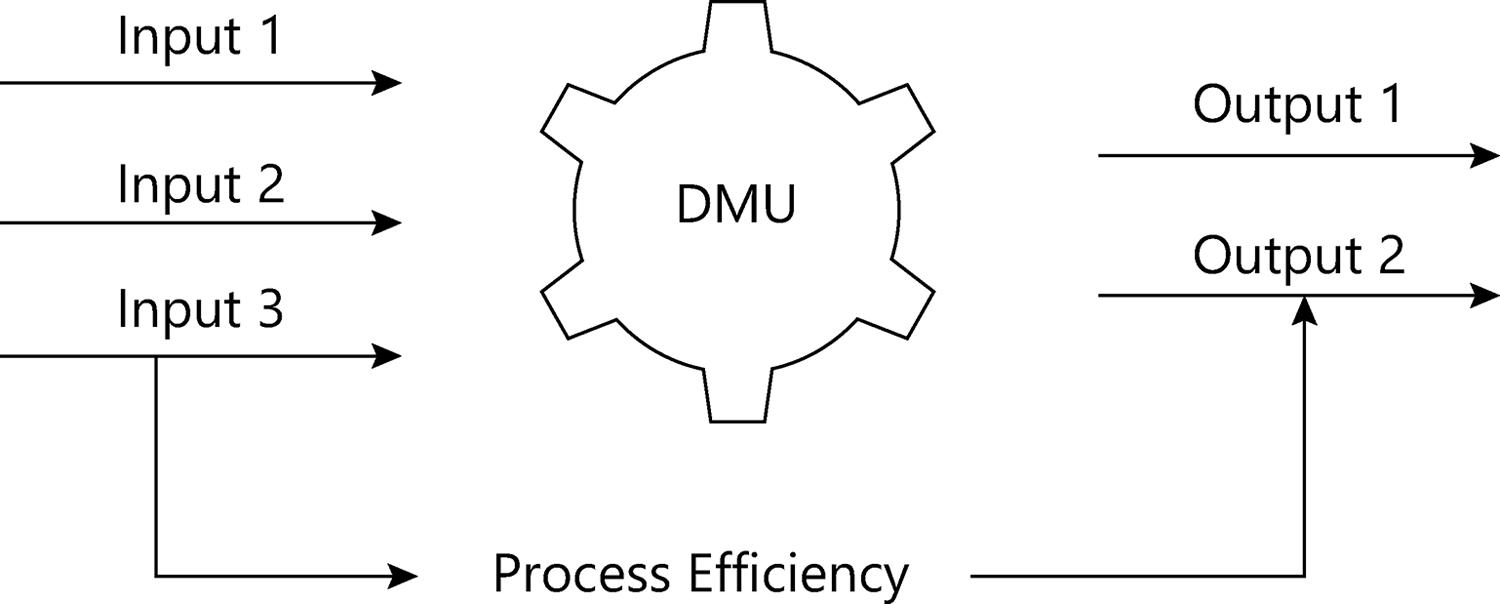
Barra and Zotti (2016) indicate the use of non-parametric methods for the educational sector as more appropriate because, different from the parametric techniques, they do not require any knowledge of the theoretical boundary of production. Another advantage is that “non-parametric methods can handle multiple inputs and outputs in a simple manner, while most stochastic approaches require the choice of a single explanatory variable” ( Figure 1 ) ( WITTE; LÓPEZ-TORRES, 2015 , p.15).
Thus, the authors chose to use the Data Envelopment Analysis to measure efficiency. The technique allows a relatively efficient comparison between the groups of schools that were studied, which proved to be a necessary procedure for the development of this research (SALGADO JUNIOR; NOVI, 2015).
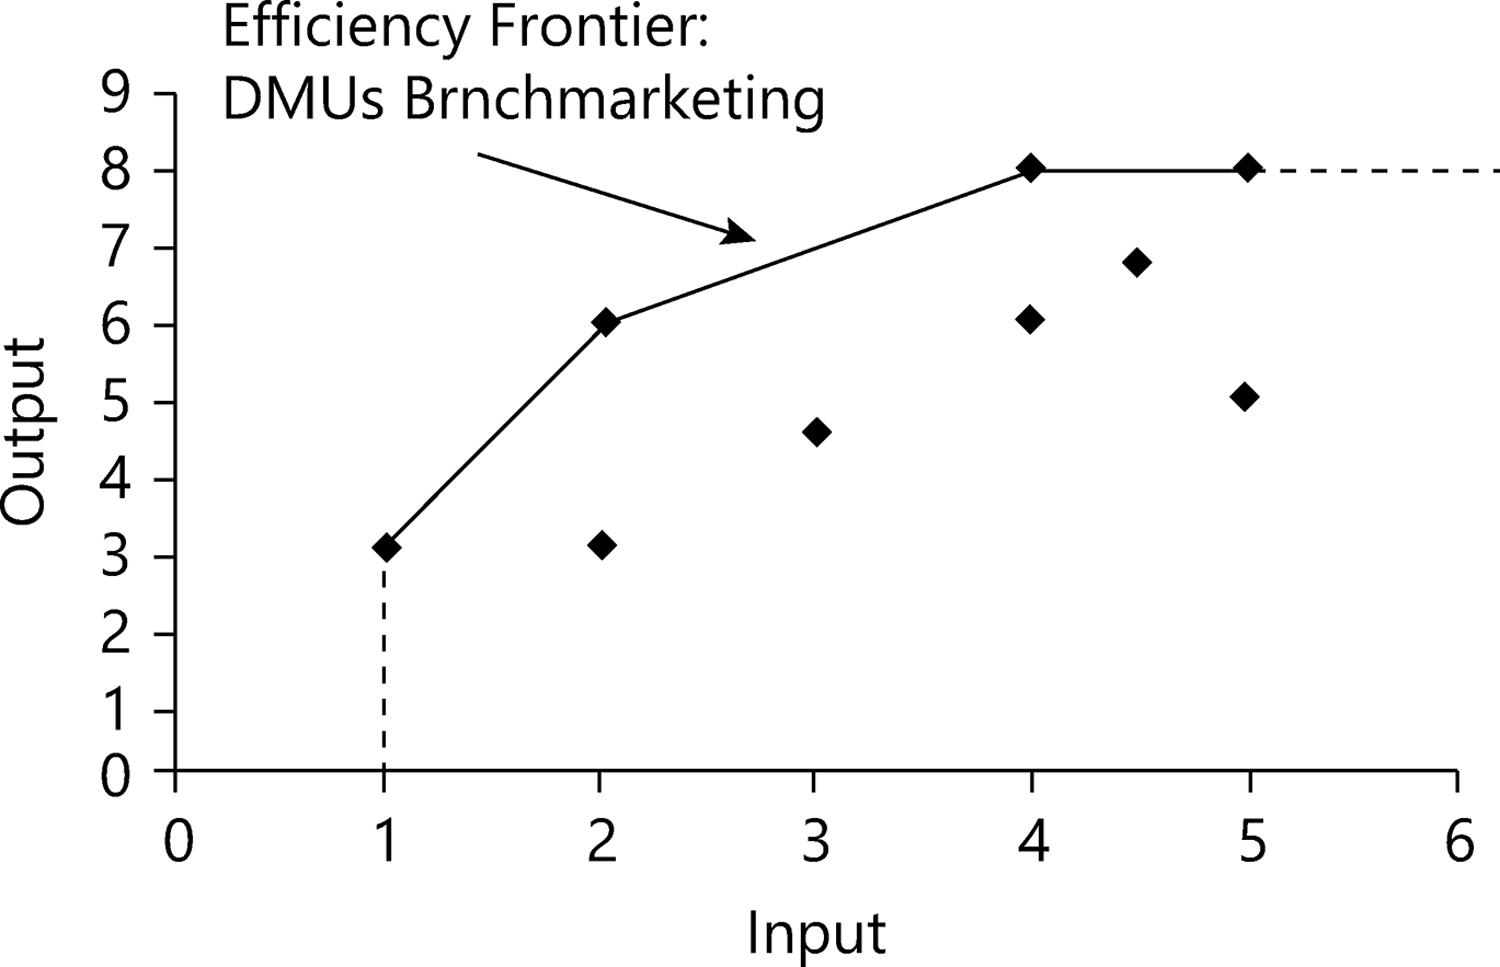
The aim of the DEA is to allow the comparison of Decision Making Units (DMU), which perform similar tasks obtaining different results in the relationship between the number of input used and the amount of output produced (MEZA et al., 2005). The efficiency frontier resulting from the application of the DEA technique ( Figure 2 ) indicates the efficient DMU that can be studied and compared to find the best practices. In addition, the technique also shows how distant other DMU are from those so-called efficient (FLACH et al ., 2017).
In light of this, it is essential to define the efficiency model in order to find the correct relationship with their respective explanatory factors. The proposed efficiency model aims to identify schools that have managed to aggregate more performance in the results of the subject of Portuguese-language in the Prova Brasil in relation to the same group of students.
For this, this research takes as input the average per school of the performance of students in Portuguese language in the Prova Brasil , taken at the end of the fifth year. The use of this input corrects one of the main problems of research on the subject, since most studies ignore the previous results obtained by students, resulting in the impossibility of estimating efficiency impartially ( WITTE; LÓPEZ-TORRES, 2015 ). As output, the average performance was used in this evaluation at the end of the ninth year as well as the performance indicator of each school in this period, which is an index that presents the approval rate of students among the evaluations as shown in Chart 1 and Figure 3 .
Chart 1 Variables for the DEA model
| type | Variable | Description | Source |
|---|---|---|---|
| Input | Portuguese Grade of the 5th year (4th grade) | Average per school in the 2011 edition | Prova Brasil – Inep |
| Output | Portuguese Grade of the 9th year (8th grade) | Average per school in the 2015 edition | Prova Brasil – Inep |
| Output | Performance indicator | Approval rate of the teaching stage per school | Ideb – Inep |
Source: Elaborated by the authors (2021)
Inep: Instituto Nacional de Estudos e Pesquisas Educacionais Anísio Teixeira ; Ideb: Índice de Desenvolvimento da Educação Básica
Source: Elaborated by the authors (2021)
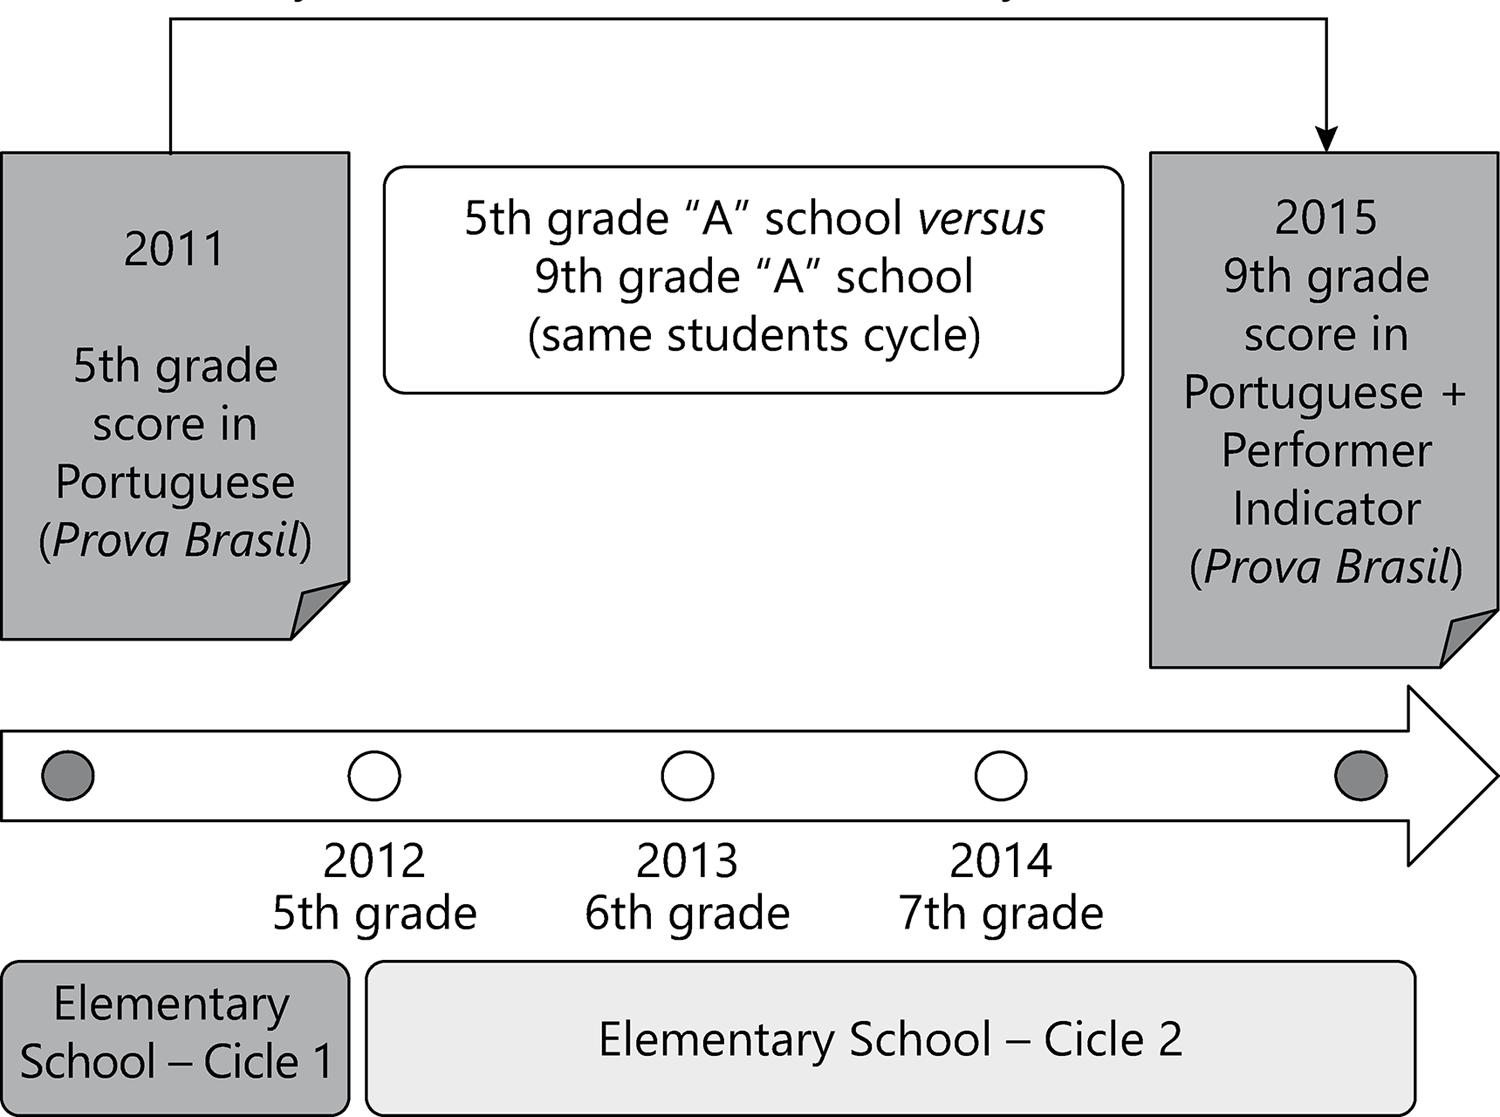
Figure 3 Evaluation cycle of Prova Brasil – efficiency model
Thus, the proposed model seeks to evaluate the same cycle of students of each school, according to Figure 3 , to verify those who aggregated the highest performance, considering that, for the most part, students remained in the same institution throughout all the years of elementary school.
Two models considered classic are CCR and BCC. The CCR model (CHARNES et al ., 1978), “considers constant returns to scale, that is, any variation in input produces proportional variation in output” (MEZA et al., 2005, p. 2525). The BCC model considers variable returns to scale, being more appropriate in relation to CCR to produce more efficient DMU (BANKER et al. , 1984).
According to Flach et al. (2017), output guidance is the most appropriate because the objective of the public service is not to reduce input, but rather to have the best application to obtain the best results to the society. In this study, since the goal is to improve the student’s performance in the output test of the model ( Prova Brasil of the 8th grade), and not reduce his/her entry grade ( Prova Brasil of the 4th grade), the orientation to output will be used. Furthermore, in the hypotheses in which the establishment of proportionality between input and output is not possible, as in this study, it is recommended the adoption of the BCC model (SALGADO JUNIOR; NOVI, 2015). The model formulation can be represented as follows:
Subject to restrictions:
ur, vi ≥ 0
j = 1, ... , s
r = 1, ... , m
i = 1, ... , n
Where Y ij and X ij are the products and input of j-th DMU, u r and v i represent the weights (weighting coefficients or relative importance of each variable) to be determined by the solution of the problem. The u r and v i weights obtained are corresponding to the current DMU. This process is repeated for each of the DMU, obtaining different values for u r and v i .
However, since the DEA is a non-parametric technique, it is not susceptible to statistical inference, presenting great dependence on the quality of the sample and the specification of the efficiency model adopted ( BARRA; ZOTTI, 2016 ; MARQUES; SILVA, 2006 ). An alternative to this scenario is the implementation of the bootstrap methodology ( EFRON, 1979 ) to DEA estimators. It allows statistical inference ( MARQUES; SILVA, 2006 ) and the achievement of more reliable estimates of efficiency indexes and confidence intervals ( DELGADO; MACHADO, 2007 , p. 435).
Because of this, for this study, we opted for the application of the BCC DEA with bootstrap, in which “estimates of corrected frontier by adjusted polarization are obtained, indicating the sensitivity of efficiency scores in relation to the sampling variations of the estimated frontier” ( BARRA; ZOTTI, 2016 , p. 13). Finally, the PIM DEA software, version 3.2, was used to calculate the efficiency scores.
For the application of the DEA technique in the proposed model, data from the municipal elementary schools of Prova Brasil were extracted from the Inep website; Inep’s test is applied every 2 years. The results are only available for consulting at school level; therefore, the data of the average grades in the subject of Portuguese language of the students by school are used. From the 2011 base of Prova Brasil , the 5th year and 2015 base grades were used as well as the Performance Indicator of the Ideb of 2015. The use of data from the base years 2011 and 2015 was adopted to measure the evolution of the performance of the same cycle of students, since there is a high probability that those who took the test in the 9th year in 2015 are the same who performed it in 2011, during the 5th year. Data extraction was performed by developing a SQL program using Postgre SQL software.
The initial database had the performance data of 40,957 municipal elementary schools from all over the country. Initially a filter was performed, remaining only those schools that offered both the early years and the final years of elementary school, admitting that, in general, students tend to continue their studies at the same institution. Following the procedures, there was a new restriction in order to maintain only schools that had all the necessary data for the execution of the DEA. Then, schools that had obtained a performance indicator of 2015 lower than 0.50 were eliminated from the base, keeping 9,120 schools.
The DEA technique presents as a restriction the inability to distinguish the inefficiency attributed to the poor management practices from those resulting from socioeconomic differences or other factors that are not under the managers control ( CARVALHO; SOUSA, 2014 ). Thus, the homogeneity of DMU is presented as pre-supposed for its use, that is, the units must perform equal tasks, with similar objectives, acting under the same market conditions and having autonomy for decision-making (MEZA et al., 2005). Ensuring their homogeneity is an essential item for the efficiency scale obtained to reflect only the differences between the practices adopted by schools and not the interference of external factors.
Thus, initially schools need to be separated according to socioeconomic level - SEL, to allow a fairer comparison among them ( ANDRADE; SOARES, 2008 ), since this factor has been identified in educational research as one of the main influencers of student performance ( ALVES; SOARES, 2007 ; HAELERMANS; RUGGIERO, 2013 ).
To ensure homogeneity among DMU, schools were classified into seven bands, according to the SEL proposed by Alves, Soares and Xavier (2014), with the sample having 3,330 schools of SEL 5 and 6, which were used to generate the efficiency ranking using the DEA technique.
The following were the data of the contextual questionnaires of Prova Brasil (four context questionnaires: about the school, the teacher, the principal and the students) and the data of the School Census for each school. Data on the school and the principal were extracted from the bases of the School Census and the Prova Brasil of 2013, to identify the structure available during the period in which the student was studying as well as the characteristics of the principal and the management actions implemented by him/her, whose effect can be observed over a longer period. For students and teachers, we opted for the use of the 2015 database, since such data more accurately portray the characteristics of these actors at the time of the last edition of Prova Brasil , understanding that these characteristics have a direct influence on the result of the evaluation; 1,392 variables were obtained in these databases.
Due to the large volume of variables, a two-step analysis was performed: initially a quintile analysis was performed to identify those with significant differences between the groups and then a second stage of DEA, which is the Multiple Linear Regression, was used.
For each of the variables, normality test was performed to guide the next stages of the analysis. Then, the averages and/or medians of these variables were obtained, and, through the Mann-Whitney test, those with significant differences between the lower and upper quintiles were identified.
Subsequently, those that appeared in duplicity between the bases and those inversely significant dichotomous were removed since they offered the same response, opting for the maintenance of only one of the variables. Some variables were also maintained, which, despite not having a difference between high and low-performance schools, were understood as relevant and were also the object of other studies identified during the survey of the theoretical framework. These were classified as “neutral” and are the ones whose average or median showed no statistically significant difference between the upper and lower quintiles. After this last analysis, 162 variables remained.
From these variables, the second stage of DEA was performed, through Multiple Linear Regression. This technique has been widely applied to research in Education ( ALVES; SOARES, 2013 ; AMÂNCIO-VIEIRA et al., 2015; ANDRADE; SOARES, 2008 ), and allows to identify the existence of a dependent relationship between the dependent variable, that is, the one that one wishes to explain – in the case of this study, the efficiency score of each school generated by the DEA technique – and the independent ones, that is, those that may be related to this performance; in this work, independent ones are related to those available in the bases of the School Census and the Prova Brasil (CORRAR et al., 2009, p. 132).
Multiple Linear Regression Equation:
Where:
Y = Dependent Variable (DEA BCC score);
β 0 = Intercept (Value of Y when X = 0);
X 1, X 2, ... X n = independent variables (variables identified in the quintile analysis);
β 1, β 2, ... β n = regression parameters;
ε = residual or regression error.
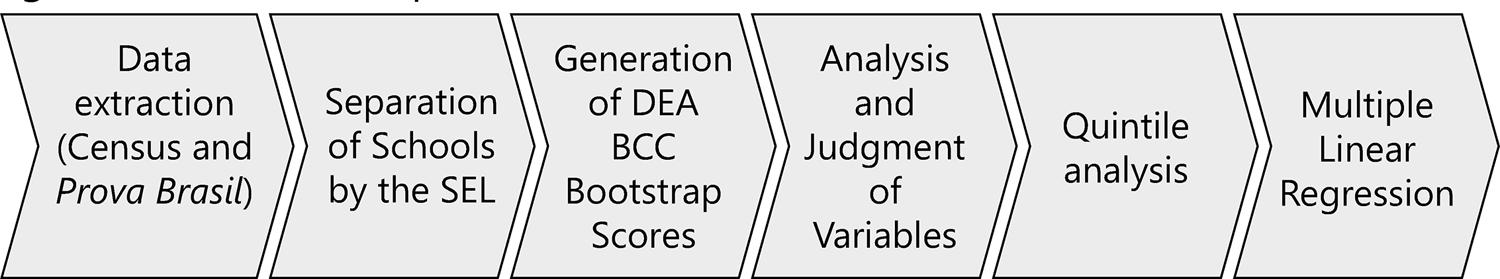
The method used was sequential search, with stepwise estimation. According to Corrar et al. (2009, p. 160), “this method performs an initial estimate with a set of independent variables and adds or eliminates variables until they achieve the best measure within the criterion used”. For this, the IBM SPSS Statistics version 22 software was used. The Figure 4 summarizes the steps of the method.
Based on this two-stage DEA analysis, it was possible to both measure the level of efficiency of schools (first step) and identify factors related to their performance. From the exploration of the method, it was possible to determine the goals of each identified indicator. The constant value of the upper quintile and its respective trend was set as a goal. Thus, it is possible for each school to evaluate its own individual performance in relation to each of the indicators related to reading and writing. The next section details the search results.
3 Results
The selection of the statistical techniques is linked to the type of distribution of the data. Initially we present the analysis of the BCC DEA scores to verify whether they presented normal distribution or not.
The visual analysis of Graph 1 seems to indicate that the DEA BCC score does not present normal distribution, which can be confirmed by the Kolmogorov-Smirnov statistical test, according to Table 1 , since its Sig was 0.000 (Sig < 0.05).
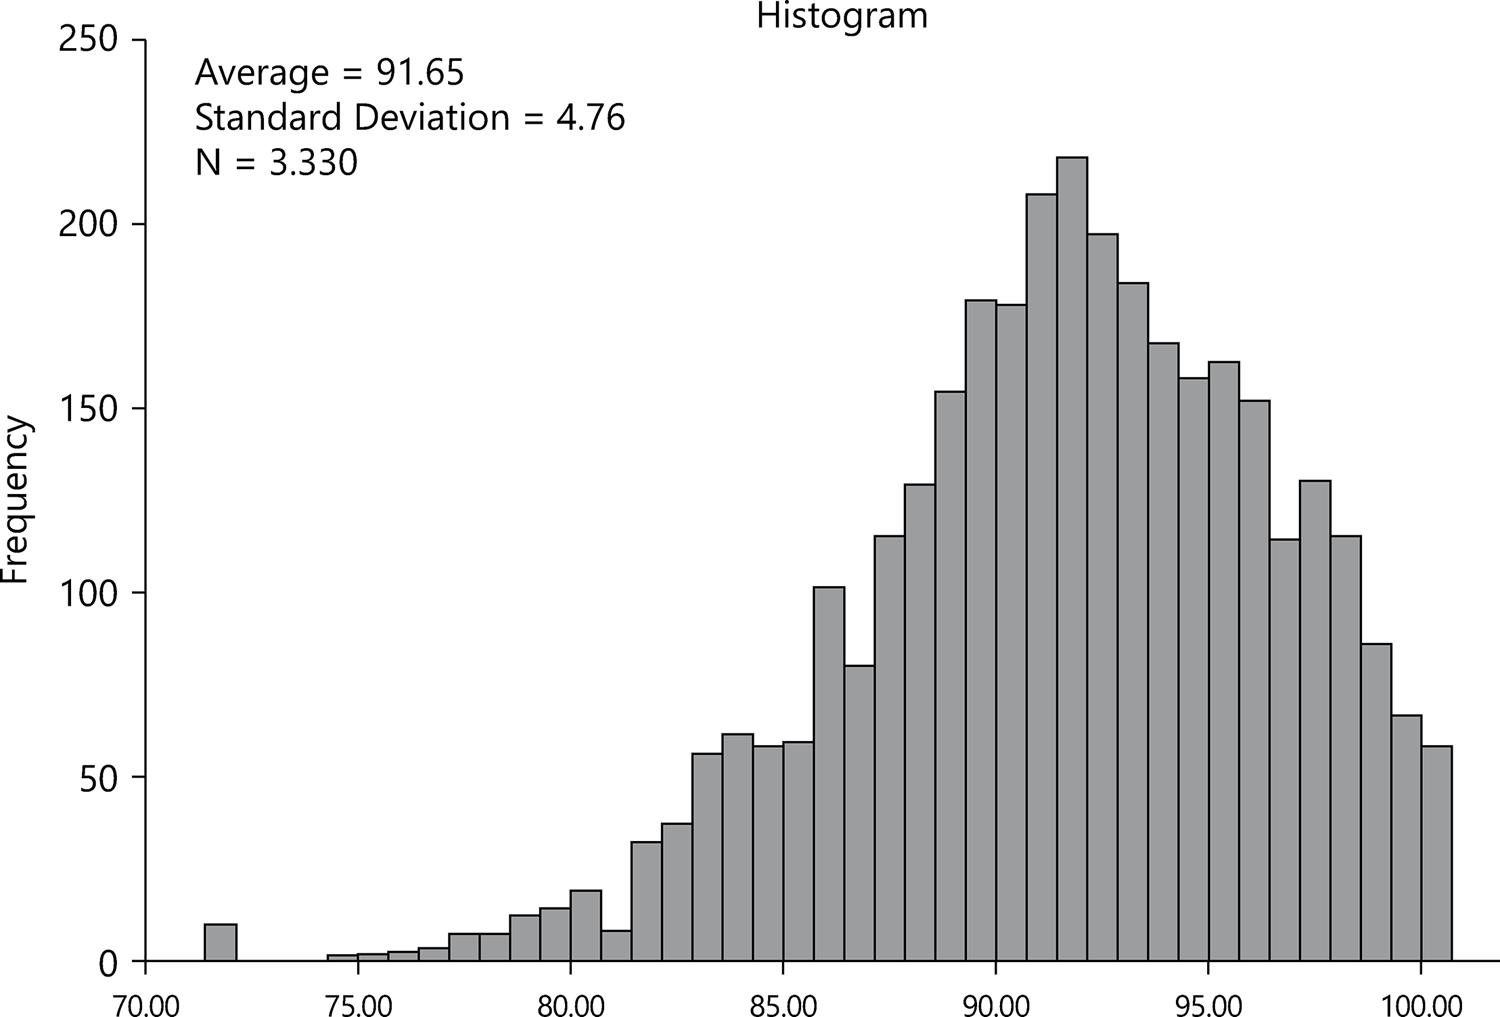
Source: Elaborated by the authors (2021)
Graph 1 Histogram DEA BCC - schools of SEL 5 and 6 - Brazil
Table 1 Normality test - DEA BCC RANKING - SEL 5 and 6 - Brazil
| Normality Tests | |||
|---|---|---|---|
|
| |||
| Kolmogorov-Smirnova | |||
|
| |||
| Statistic | df | Sig. | |
| DEA_LP_BOOTSTRAP_BCC | ,040 | 3330 | ,000 |
Source: Elaborated by the authors (2021)
a. Lilliefors Significance Correlation
The following is the descriptive statistics for the quintiles with DEA score, performance in Portuguese language in Prova Brasil , in their editions of 2011 and 2015 and Performance Indicator of 2015 ( Table 2 ).
Table 2 Descriptive statistic for the DEA score
| Average of the school in Portuguese Language | Performance Indicator 2015 | DEA Score | ||||||
|---|---|---|---|---|---|---|---|---|
|
| ||||||||
| 2011 | 2015 | |||||||
|
| ||||||||
| Q1 | Q5 | Q1 | Q5 | Q1 | Q5 | Q1 | Q5 | |
| Minimum | 152,74 | 155,22 | 205,13 | 176,83 | 0,62 | 0,50 | 95,96 | 71,62 |
| Avarege | 202,12 | 192,20 | 265,42 | 240,67 | 0,96 | 0,78 | 97,91 | 84,54 |
| Maximum | 258,38 | 236,70 | 315,79 | 271,59 | 1,00 | 0,88 | 100,00 | 87,75 |
| Standard Deviation | 19,16 | 13,47 | 18,72 | 12,98 | 0,05 | 0,07 | 1,24 | 2,66 |
Source: Elaborated by the authors (2021)
A quintile analysis was performed to identify those ones that presented a statistically significant average or median difference between the upper quintile (schools considered of high performance in the DEA ranking) and the lower quintile (schools considered of low performance in the DEA ranking).
From the 161 variables identified in the quintile analysis, the analysis was performed using Multiple Linear Regression. The stepwise model pointed to a result composed of 39 selected independent variables. This model, due to the complexity involved in the educational service and the influence of numerous external factors on the students’ results, obtained a R2 of 0.248, presenting limited explanatory power, according to Table 3 . However, if the technical assumptions are met, we can use its results to reinforce the analysis on the items highlighted by it.
Table 3 Summary of the multiple linear regression model
| Model | R | R Square | R Square Adjusted | Standard error of the estimate | Durbin-Watson |
|---|---|---|---|---|---|
| 39 | ,498am | ,248 | ,239 | 4,17785 | 1,721 |
Source: Elaborated by the authors (2021)
According to Corrar et al. (2009), the main assumptions for regression analysis are normality and homocedasticity of the residuals. The analysis of the histogram of the residuals ( Graph 2 ) seems to indicate normality, which is confirmed by the Kolmogorov-Smirnov test ( Table 4 ).
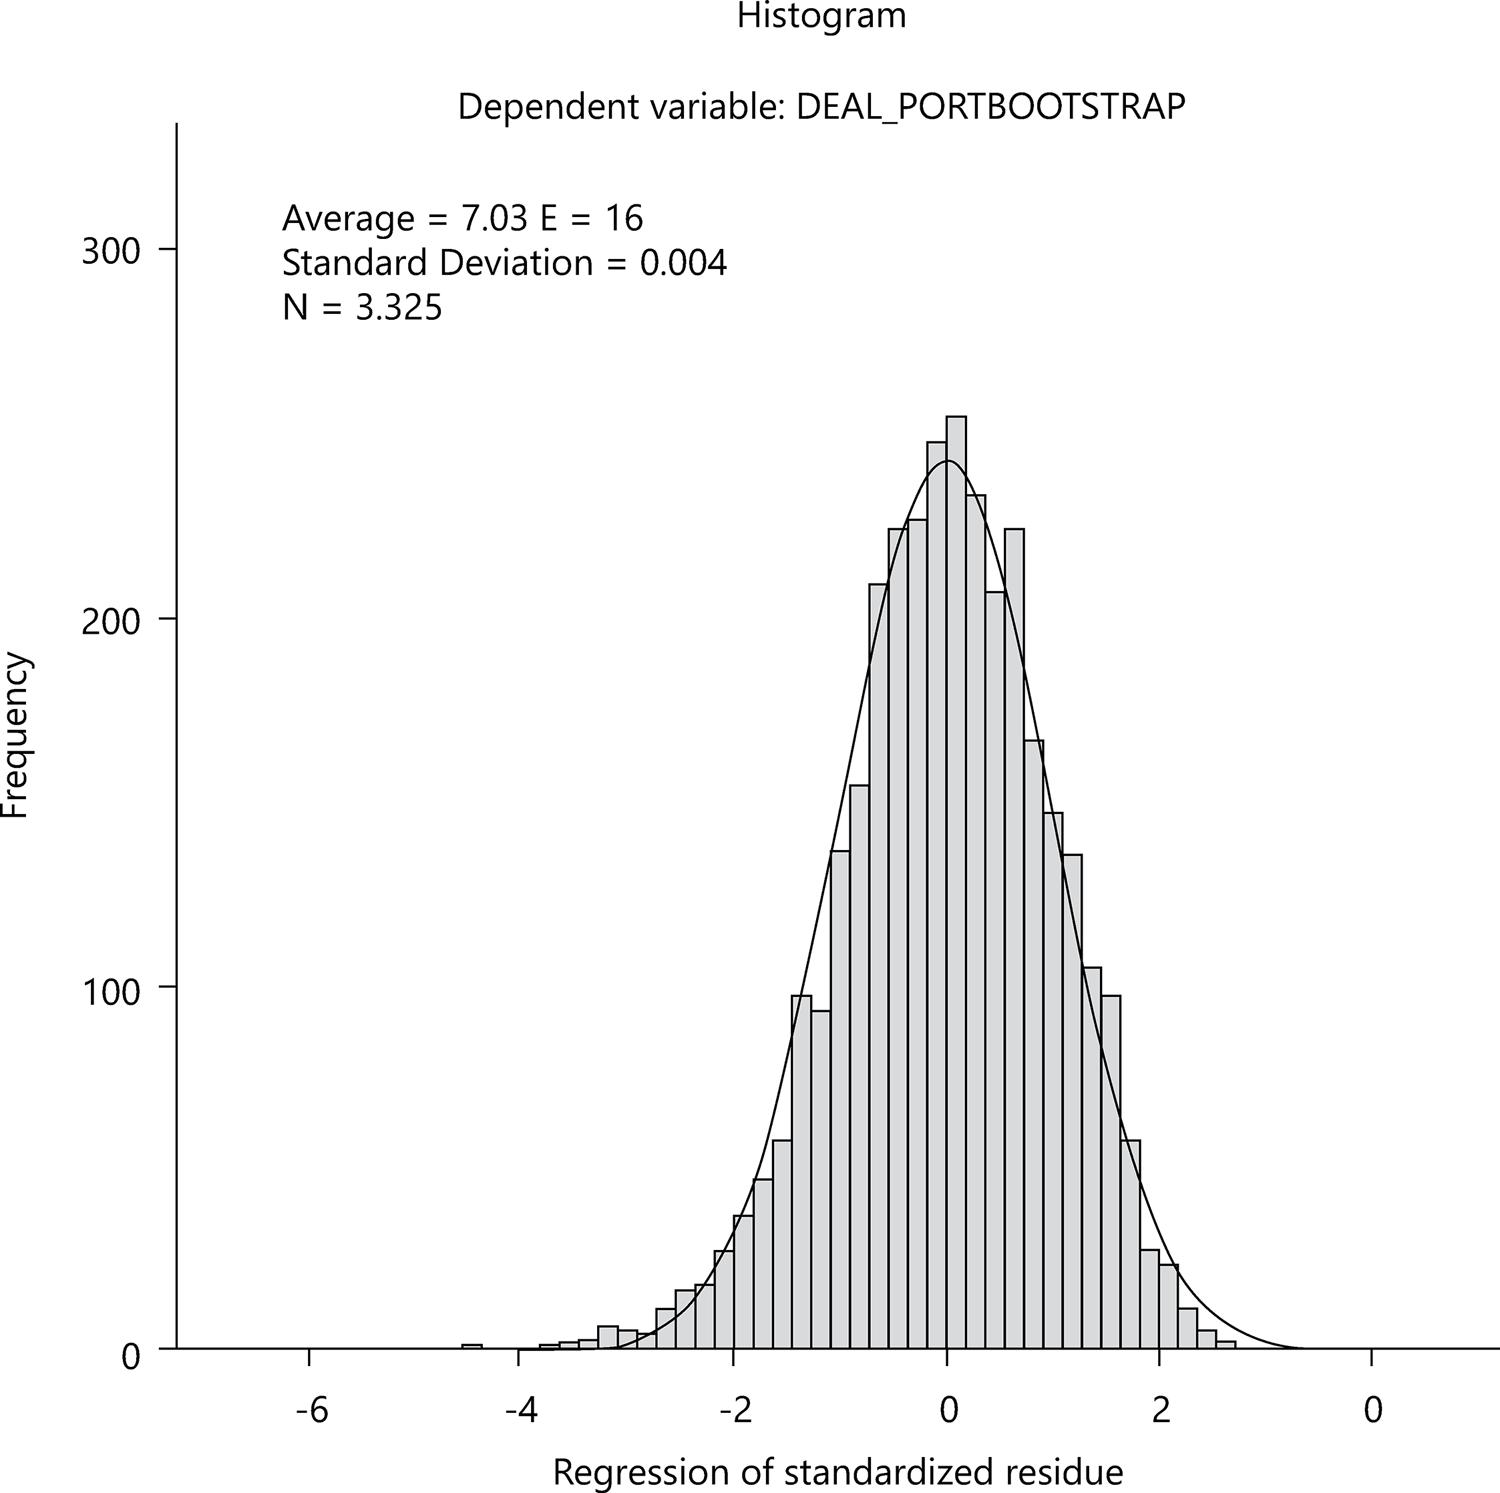
Table 4 Kolmogorov-Smirnov normality test of regression residuals
| Standardized Residual | ||
|---|---|---|
| N | 3325 | |
| Normal parametersa,b | Average | ,0000000 |
| Standard Deviation | ,99411626 | |
| More Extreme Differences | Absolute | ,018 |
| Positive | ,013 | |
| Negative | -,018 | |
| Test Statistic | ,018 | |
| Significance Sig. (2 ends) | ,014c | |
Source: Elaborated by the authors (2021)
a: The distribution of the test is Normal; b: Calculated of the data; c: Lilliefors Significance Correction
The verification of linear relationships between the variables can be performed through statistical tests such as the Variance Inflation Factor - VIF and Tolerance (CORRAR et al., 2009). For these indexes, it can be observed in Table 5 that there is no multicollinearity among the independent variables that remained in the model, since both, VIF and tolerance, are within the acceptable ranges.
Table 5 Regression multicollinearity test
| Model | Non-standardized coefficients | Standardized coefficients | t | Sig. | Collinearity Statistics | |||
|---|---|---|---|---|---|---|---|---|
|
|
|
|||||||
| B | Standard Error | Beta | Tolerance | VIF | ||||
| 39 | (Constant) | 76,904 | 2,098 | 36,657 | 0 | |||
| PB_ALUNO_V04 | 4,672 | 1,4 | 0,073 | 3,336 | 0,001 | 0,477 | 2,098 | |
| PB_ALUNO_V29 | 3,264 | 0,546 | 0,1 | 5,982 | 0 | 0,823 | 1,215 | |
| PB_PROFESSOR_V10 | -1,037 | 0,214 | -0,077 | -4,839 | 0 | 0,901 | 1,109 | |
| PB_ALUNO_V17 | -4,674 | 1,143 | -0,071 | -4,091 | 0 | 0,768 | 1,302 | |
| PB_ALUNO_V26 | 4,138 | 0,618 | 0,113 | 6,694 | 0 | 0,81 | 1,235 | |
| PB_ALUNO_V08 | 8,919 | 1,915 | 0,077 | 4,658 | 0 | 0,835 | 1,197 | |
| PB_PROFESSOR_V48 | 1,114 | 0,266 | 0,065 | 4,184 | 0 | 0,934 | 1,07 | |
| PB_ALUNO_V15 | -5,227 | 1,025 | -0,086 | -5,1 | 0 | 0,803 | 1,246 | |
| PB_ALUNO_V14 | 2,259 | 0,505 | 0,074 | 4,473 | 0 | 0,828 | 1,207 | |
| PB_DIR_V30 | 0,336 | 0,093 | 0,061 | 3,627 | 0 | 0,82 | 1,219 | |
| PB_ESCOLA_V14 | -0,33 | 0,079 | -0,067 | -4,153 | 0 | 0,892 | 1,121 | |
| PB_ALUNO_V20 | -2,768 | 0,966 | -0,05 | -2,866 | 0,004 | 0,739 | 1,353 | |
| C_TURM_V08 | -1,442 | 0,319 | -0,069 | -4,518 | 0 | 0,992 | 1,008 | |
| PB_PROFESSOR_V27 | 0,991 | 0,272 | 0,056 | 3,64 | 0 | 0,955 | 1,047 | |
| PB_PROFESSOR_V03 | 0,628 | 0,211 | 0,047 | 2,976 | 0,003 | 0,901 | 1,11 | |
| PB_DIR_V53 | -0,242 | 0,081 | -0,048 | -3,005 | 0,003 | 0,881 | 1,135 | |
| PB_PROFESSOR_V18 | -1,545 | 0,55 | -0,043 | -2,806 | 0,005 | 0,976 | 1,024 | |
| PB_DIR_V10 | 0,187 | 0,035 | 0,102 | 5,303 | 0 | 0,62 | 1,612 | |
| PB_DIR_V18 | -0,308 | 0,062 | -0,083 | -4,939 | 0 | 0,819 | 1,222 | |
| PB_PROFESSOR_V11 | 0,697 | 0,194 | 0,057 | 3,587 | 0 | 0,897 | 1,115 | |
| PB_ALUNO_V24 | 3,589 | 1,135 | 0,049 | 3,161 | 0,002 | 0,942 | 1,061 | |
| PB_PROFESSOR_V23 | -0,796 | 0,243 | -0,052 | -3,273 | 0,001 | 0,901 | 1,11 | |
| PB_PROFESSOR_V37 | 0,535 | 0,217 | 0,039 | 2,458 | 0,014 | 0,926 | 1,079 | |
| PB_ALUNO_V27 | 1,352 | 0,583 | 0,04 | 2,319 | 0,02 | 0,766 | 1,305 | |
| PB_PROFESSOR_V32 | -1,725 | 0,572 | -0,046 | -3,014 | 0,003 | 0,977 | 1,023 | |
| PB_DIR_V41 | 0,181 | 0,094 | 0,03 | 1,916 | 0,055 | 0,935 | 1,07 | |
| PB_PROFESSOR_V12 | 0,529 | 0,199 | 0,042 | 2,662 | 0,008 | 0,937 | 1,067 | |
| PB_ALUNO_V07 | 4,94 | 1,699 | 0,063 | 2,907 | 0,004 | 0,482 | 2,075 | |
| PB_ALUNO_V22 | -2,898 | 0,89 | -0,058 | -3,257 | 0,001 | 0,721 | 1,386 | |
| PB_ALUNO_V02 | -3,874 | 1,3 | -0,053 | -2,98 | 0,003 | 0,711 | 1,407 | |
| PB_DIR_V14 | -0,142 | 0,049 | -0,052 | -2,918 | 0,004 | 0,734 | 1,363 | |
| PB_DIR_V50 | -0,19 | 0,08 | -0,037 | -2,365 | 0,018 | 0,916 | 1,091 | |
| PB_PROFESSOR_V33 | 0,503 | 0,204 | 0,039 | 2,469 | 0,014 | 0,9 | 1,112 | |
| PB_ESCOLA_V23 | 0,493 | 0,169 | 0,052 | 2,918 | 0,004 | 0,729 | 1,372 | |
| PB_DIR_V42 | 0,231 | 0,105 | 0,034 | 2,208 | 0,027 | 0,975 | 1,026 | |
| PB_ESCOLA_V22 | -0,294 | 0,134 | -0,038 | -2,191 | 0,029 | 0,763 | 1,31 | |
| PB_DIR_V32 | 0,269 | 0,126 | 0,036 | 2,13 | 0,033 | 0,795 | 1,258 | |
| PB_ALUNO_V23 | -3,274 | 1,634 | -0,031 | -2,003 | 0,045 | 0,929 | 1,077 | |
| PB_PROFESSOR_V50 | 0,434 | 0,217 | 0,031 | 2,001 | 0,045 | 0,926 | 1,08 | |
Source: Elaborated by the authors (2021)
The Dependent Variable: DEAL_PORTBOOTSTRAP
Thus, the model complies with the statistical assumptions of the analysis, assisting in the identification of variables with greater explanatory potential among those initially selected, which are identified in Table 5 .
Once regression was performed, it was possible to identify, at a level of 5% confidence, which variables were significant to explain the students’ school performance in the Ideb evaluations. The variables were classified according to their effect in schools – negative, positive or neutral. Variables with negative effect were considered those that, presenting statistically significant difference, were more present in low-performance schools; and positive, those who, also presenting statistically significant difference, had higher frequency in schools considered efficient by the model. For each variable, the constant value of the upper quintile and its respective trend was set as a goal.
In addition to the identification of indicators, it is also essential to define the goals for each of these, allowing each school to evaluate its individual performance compared to the others in each aspect addressed in this study.
School A is located in a municipality with approximately 15,000 inhabitants with GDP per capita of R$ 16,058.64 ( IBGE, 2016 ). It is located in a country town of São Paulo state, close to important centers such as Piracicaba and Limeira cities. The municipality also does not have private elementary schools.
The municipality referring to school B has approximately 137,000 inhabitants with GDP per capita of R$ 35,223.10 ( IBGE, 2016 ), and is located in a country town of São Paulo state, exactly 60 kilometers from Campinas and Limeira cities. The municipality has a strong performance in citrus, besides housing large industrial enterprises in the metal mechanics sector and the paper industry. The municipality has a large network of private primary schools.
The school C is located in a municipality with approximately 29,000 inhabitants with GDP per capita of R$ 31,168.75 ( IBGE, 2016 ), and is located in a country town of São Paulo state, with 16 kilometers from the city of Piracicaba. The city has municipal, state and private schools to offer basic education.
Finally, the municipality of school D has about 51,000 inhabitants with GDP per capita of R$ 30,453.74 ( IBGE, 2016 ), and is located in a country town of São Paulo state, 130 km distant from Ribeirão Preto city and 160 km from Campinas city. The government is the largest employer of the municipality, being also responsible for most of the local economy, followed by industry and agriculture, respectively. The municipality has a network of private primary schools.
Thus, from the results found in linear regression, the results of high-performance schools were evaluated, using the quintile analysis; and the constant value of the upper quintile and its respective trend were determined as the goal of each variable. The Chart 2 presents the compiled results, as well as the values observed in each of the variables in the selected schools.
Chart 2 Results of the quantitative step
| LEVEL (*) | RESPONDENT (*) | QUESTIONAIRE (**) | GROUP | VARIABLE_CODE | VARIABLE_DESCRIPTION | QUINTILE | REGRESSION | EFFECT | GOAL | SCHOOL A | SCHOOL B | SCHOOL C | SCHOOL D | |
|---|---|---|---|---|---|---|---|---|---|---|---|---|---|---|
| P | P | C | Personal Profle | C_PROF_CONS_V03 | Percentage of female teachers. | X | ● | ↑ | 71,70% | 63,60% | 84,80% | 58,80% | 85,70% | |
| P | P | C | PB_PROF_V142 | Frequency of going to the cinema. | X | X | ♦ | ↓ | 20,11% | 0,00% | 0,00% | 0,00% | 0,00% | |
| P | P | P | PB_PROF_V270 | Teacher’s dissatisfaction and discouragement with the teaching career. | X | ♦ | ↓ | 29,98% | 0,00% | 0,00% | 0,00% | 0,00% | ||
| P | P | P | PB_PROF_V10 | Higher Education in Pedagogy. | X | ● | ↑ | 0,10% | 0,00% | 0,00% | 0,00% | 0,50% | ||
| P | P | C | PB_PROF_V17 | Type of HEI he / she attended: public (-) or private (+). | X | ● | ↑ | 57,00% | 100,00% | 81,80% | 76,50% | 21,04% | ||
| P | P | P | Work Type | PB_PROF_V71 | Type of contract: Statutory. | X | X | ♦ | ↓ | 68,19% | 0,00% | 0,00% | 0,00% | 50,00% |
| P | P | P | PB_DIR_V151 | Less than 25% of schoolteachers have a stable bond. | X | X | ● | YES | NO | NO | NO | NO | ||
| P | D | P | PB_PROF_V78 | Teachers with longer hours at school (over 20 hours) perform better. | X | X | ● | ↑ | 61,99% | 100,00% | 50,00% | 100,00% | 33,33% | |
| P | P | P | PB_PROF_V80 | Working in just one school improves performance. | X | X | ● | ↑ | 42,48% | 0,00% | 100,00% | 0,00% | 66,67% | |
| P | P | P | Teaching Planning | PB_PROF_V178 | Pedagogical Project ready and adapted without discussion with teachers. | X | X | ♦ | ↓ | 0,02% | 0,00% | 0,00% | 0,00% | 0,00% |
| P | P | P | PB_PROF_V264 | Curricular contents inadequate to the needs of students. | X | ♦ | ↓ | 14,52% | 0,00% | 0,00% | 0,00% | 0,00% | ||
| P | P | P | PB_PROF_V196 | Weekly exchange of teaching materials with colleagues. | X | ● | ↑ | 20,77% | 0,00% | 50,00% | 0,00% | 0,00% | ||
| P | P | P | PB_PROF_V201 | Weekly meeting with teachers who work at the same. | X | ● | ↑ | 27,30% | 0,00% | 50,00% | 100,00% | 100,00% | ||
| P | P | P | PB_PROF_V206 | Participate in weekly discussions on learning development. | X | X | ● | ↑ | 32,22% | 0,00% | 50,00% | 100,00% | 83,33% | |
| P | P | P | PB_PROF_V211 | Development of joint activities with other teachers weekly. | X | ● | ↓ | 8,99% | 0,00% | 0,00% | 0,00% | 0,00% | ||
| P | P | P | Teaching Pratice | PB_PROF_V153 | Use of literature books is good. | X | ● | ↑ | 39,37% | 0,00% | 50,00% | 0,00% | 50,00% | |
| P | P | P | PB_PROF_V157 | Using a projector. | X | X | ● | ↑ | 20,66% | 0,00% | 50,00% | 0,00% | 0,00% | |
| P | P | P | PB_PROF_V165 | Teacher uses photocopying equipment. | X | ● | ↑ | 59,48% | 0,00% | 100,00% | 0,00% | 33,33% | ||
| P | P | P | PB_PROF_V169 | Teacher uses pedagogical applications. | X | ● | ↓ | 21,88% | 0,00% | 50,00% | 100,00% | 0,00% | ||
| P | P | P | PB_PROF_V173 | Teacher uses the internet. | X | ● | ↓ | 12,25% | 0,00% | 0,00% | 0,00% | 33,33% | ||
| E | AP | P | PB_ESC_V91 | Availability and number of computers for student use (Good). | X | ● | YES | YES | YES | NO | YES | |||
| E | AP | P | PB_ESC_V97 | Broadband internet access for students (Good). | X | ● | YES | YES | YES | NO | YES | |||
| E | AP | P | PB_ESC_V103 | Availability of computers for use by teachers (Good). | X | X | ● | YES | YES | YES | NO | YES | ||
| P | P | P | PB_PROF_V321 | More time dedicated to classes and less to the administrative question (80% / 100%). | X | ● | ↑ | 72,06% | 100,00% | 50,00% | 100,00% | 66,67% | ||
| P | P | P | PB_PROF_V84 | Hours dedicated to extra-class activities (None). | X | X | ● | ↓ | 0,02% | 0,00% | 0,00% | 0,00% | 0,00% | |
| P | P | P | PB_PROF_V268 | Overload of teachers’ work, making it difficult to plan and prepare classes. | X | ♦ | ↓ | 35,46% | 0,00% | 50,00% | 0,00% | 16,67% | ||
| P | P | P | PB_PROF_V310 | Spend less than 10% of the time ensuring discipline in the classroom. | X | ● | ↑ | 37,35% | 0,00% | 50,00% | 100,00% | 33,33% | ||
| D | D | P | PB_DIR_V457 | School functioning interrupted by discipline problems. | X | X | ♦ | NO | NO | NO | YES | NO | ||
| P | P | P | PB_PROF_V336 | Daily homework offer. | X | ● | ↑ | 28,85% | 0,00% | 0,00% | 0,00% | 0,00% | ||
| P | A | P | PB_PROF_V342 | Teacher corrects homework daily. | X | ● | ↑ | 80,40% | 86,00% | 88,00% | 73,00% | 55,00% | ||
| P | P | P | PB_PROF_V360 | Copying contents of the book or blackboard is negative. | X | ♦ | ↓ | 30,34% | 0,00% | 50,00% | 0,00% | 50,00% | ||
| P | P | P | Teaching Pratice | PB_PROF_V366 | Activities that encourage students to express their opinions and create arguments. | X | ● | ↑ | 65,17% | 100,00% | 100,00% | 0,00% | 50,00% | |
| P | P | P | PB_PROF_V377 | Promote discussions based on texts (newspapers and magazines) weekly. | X | ● | ↑ | 41,41% | 41,41% | 100,00% | 35,00% | 0,00% | ||
| P | P | P | PB_PROF_V402 | Propose grammatical activities related to the texts of newspapers or magazines daily. | X | ♦ | ↓ | 18,40% | 18,16% | 0,00% | 21,57% | 0,00% | ||
| P | P | P | PB_PROF_V389 | Promote reading and discussion of short stories, chronicles, poetry or novels weekly. | X | ● | ↑ | 48,02% | 47,97% | 0,00% | 42,95% | 33,33% | ||
| P | P | P | PB_PROF_V330 | Ensure compliance with at least 80% of the contents of the school trajectory. | X | ● | ↑ | 57,35% | 100,00% | 87,50% | 100,00% | 33,33% | ||
| P | P | P | PB_PROF_V267 | Comply with the curriculum content throughout the student’s trajectory. | X | X | ● | ↑ | 74,46% | 100,00% | 100,00% | 100,00% | 100,00% | |
| P | P | P | PB_PROF_V321 | More time dedicated to classes and less to the administrative question (80% / 100%). | X | ● | ↑ | 72,06% | 100,00% | 50,00% | 100,00% | 66,67% | ||
| P | P | P | PB_PROF_V268 | Overload of teachers’ work, making it difficult to plan and prepare classes. | X | ♦ | ↓ | 35,46% | 0,00% | 50,00% | 0,00% | 16,67% | ||
| P | P | P | PB_PROF_V178 | Pedagogical Project ready and adapted without discussion with teachers. | X | X | ♦ | ↓ | 0,02% | 0,00% | 0,00% | 0,00% | 0,00% | |
| P | P | P | PB_PROF_V264 | Curricular contents inadequate to the students’ realities. | X | ♦ | ↓ | 14,52% | 0,00% | 0,00% | 0,00% | 0,00% | ||
| P | P | P | PB_PROF_V310 | Spend less than 10% of the time ensuring discipline in the classroom. | X | ● | ↑ | 37,35% | 0,00% | 50,00% | 100,00% | 33,33% | ||
| D | D | P | Work type, Training and Experience | PB_DIR_V37 | Exclusive dedication to the school. | X | ● | YES | YES | YES | YES | YES | ||
| D | D | P | PB_DIR_V54 | Has 40 hours a week OR + of workload at school. | X | ● | YES | YES | YES | YES | YES | |||
| D | D | P | PB_DIR_V61 | Entry into office via Public Tender or Direct Nomination. | X | ● | YES | YES | YES | YES | YES | |||
| D | D | P | PB_DIR_V30 | Possess post-graduation (specialization). | X | X | ● | YES | YES | YES | YES | YES | ||
| D | D | P | PB_DIR_V75 | Previous experience as a teacher (+ 20 years). | X | X | ♦ | NO | NO | NO | NO | NO | ||
| D | D | P | PB_DIR_V90 | Principal at the same school for 6 to 10 years. | X | ● | YES | NO | NO | NO | NO | |||
| D | D | P | Acting with the family and the community | PB_DIR_V276 | Frequency with which the Principal communicates to parents about problems related to students (always or almost always). | X | ● | YES | NO | NO | NO | YES | ||
| A | A | P | PB_ALUN_V29 | Parents’ participation in school meetings. | X | ● | ↑ | 55,40% | 86,00% | 67,00% | 69,00% | 64,00% | ||
| D | D | P | PB_DIR_V311 | The Principal promotes thematic projects (such as bullying, inequalities and socio-environmental impacts) (Often). | X | ● | YES | NO | NO | YES | YES | |||
| D | D | P | PB_DIR_V317 | Principal promotes events for the community (Often). | X | ● | YES | YES | YES | NO | YES | |||
| D | D | P | PB_DIR_V321 | Principal gives the school space for events held by the community (Never). | X | ♦ | NO | NO | NO | NO | NO | |||
| E | AP | P | PB_ESC_V172 | Library allows access of the collection to the community. | X | X | ● | YES | NO | YES | NO | YES | ||
| D | D | P | PB_DIR_V472 | Receives support from the community. | X | ● | YES | YES | YES | YES | YES | |||
| D | D | P | PB_DIR_V327 | Principal promotes community participation by volunteering for the school. | X | X | ● | YES | YES | YES | YES | YES | ||
| D | D | P | PB_DIR_V212 | Adopts student admission policy according to place of residence (neighborhood of school). | X | ● | YES | YES | YES | YES | NO | |||
| D | D | P | Management practices | PB_DIR_V232 | Assignment of classes considering the choice of teachers, according to the score for length of service and training. | X | ● | YES | YES | NO | YES | NO | ||
| D | D | P | PB_DIR_V161 | Principal holds and participates in School Board meetings three or more times a year. | X | ● | YES | NO | - | YES | NO | |||
| D | D | P | PB_PROF_V186 | Principal holds class council meetings (the body made up of all teachers who teach in each grade) three or more times a year. | X | X | ● | ↑ | 75,36% | 100,00% | 100,00% | 100,00% | 100,00% | |
| D | P | P | PB_PROF_V222 | The Principal frequently informs about the possibility of improvement for teachers. | X | ● | ↓ | 4,17% | 0,00% | 0,00% | 0,00% | 0,00% | ||
| D | D | P | PB_DIR_V464 | Receive support from higher levels. | X | ● | YES | YES | YES | YES | YES | |||
| D | D | P | PB_DIR_V368 | School meal: Availability of financial resources (Good or above). | X | ● | YES | YES | YES | YES | NO | |||
| D | D | P | PB_DIR_V376 | School meal: Amount of food (Great). | X | ● | YES | YES | NO | YES | YES | |||
| D | D | P | PB_DIR_V383 | School meal: Food quality (Great). | X | ● | YES | YES | NO | YES | YES | |||
| D | D | P | PB_DIR_V390 | School meal: Physical space for cooking (Great). | X | ● | YES | NO | NO | NO | YES | |||
| D | D | P | PB_PROF_V263 | Ensure that the staff of pedagogical support professionals is complete. | X | X | ● | ↑ | 90,00% | 100,00% | 100,00% | 100,00% | 100,00% | |
| D | D | P | PB_DIR_V406 | Ensure that the teaching staff is complete. | X | ● | YES | YES | NO | NO | YES | |||
| D | D | P | PB_DIR_V412 | Ensure that the administrative staff is appropriate to the school structure. | X | ● | NO | NO | NO | NO | NO | |||
| D | D | P | Management practices | PB_DIR_V418 | Ensure that the support staff (coordinator, supervisor, advisor) is complete. | X | X | ● | ↑ | 90,06% | 100,00% | 100,00% | 100,00% | 100,00% |
| E | AP | P | PB_ESC_V14 | Present infrastructure in good conditions of conservation and operation. | X | ● | ↑ | 74,61% | 100,00% | 0,00% | 0,00% | 100,00% | ||
| E | AP | P | PB_ESC_V43 | All classrooms are well lit. | X | ● | YES | YES | YES | YES | YES | |||
| E | AP | P | PB_ESC_V61 | Control of entry of strangers (Good). | X | ● | YES | YES | YES | YES | YES | |||
| E | AP | P | PB_ESC_V79 | Policing system to inhibit drug trafficking within and around the school (Good). | X | ● | YES | YES | NO | NO | NO | |||
| E | AP | P | PB_ESC_V91 | Availability and number of computers for student use (Good). | X | ● | YES | YES | YES | NO | YES | |||
| E | AP | P | PB_ESC_V97 | Broadband internet access for students (Good). | X | ● | YES | YES | YES | NO | YES | |||
| E | AP | P | PB_ESC_V103 | Availability of computers for use by teachers (Good). | X | X | ● | YES | YES | YES | NO | YES | ||
| E | AP | P | PB_ESC_V109 | Broadband internet access for teachers (Good). | X | ● | YES | YES | YES | YES | YES | |||
| E | AP | P | C_ESC_V14 | Availability of computers for use by administrative staff. | X | ● | ↑ | 10,80% | 11,00% | 8,00% | 5,00% | 7,00% | ||
| E | AP | C | C_ESC_V09 | School has printer. | X | ● | ↑ | 1,20% | 2,00% | 1,00% | 4,00% | 2,00% | ||
| D | P | P | PB_PROF_V231 | The Principal is frequently involved in administrative rules. | X | ● | ↑ | 50,54% | 0,00% | 50,00% | 100,00% | 50,00% | ||
| D | P | P | PB_PROF_V235 | The Principal is frequently involved in the maintenance of the school. | X | ● | ↑ | 51,56% | 0,00% | 50,00% | 100,00% | 50,00% | ||
| D | D | P | PB_DIR_V488 | Seek financial support from private companies. | X | ● | YES | NO | NO | NO | YES | |||
| D | D | P | Management practices | PB_DIR_V400 | There is no interruption of school activities due to lack of financial resources. | X | ● | YES | YES | YES | NO | YES | ||
| D | D | P | PB_DIR_V342 | The Principal is to ensure an adequate infrastructure to serve people with disabilities or special needs. | X | X | ● | YES | NO | NO | NO | YES | ||
| E | AP | P | PB_ESC_V133 | Existence of a reading classroom for students. | X | ● | YES | YES | NO | NO | YES | |||
| E | AP | P | PB_ESC_V181 | Existence of personnel responsible for service in the library. | X | X | ● | YES | YES | NO | NO | YES | ||
| E | AP | P | PB_ESC_V172 | Library allows the collection access to the community. | X | X | ● | YES | NO | YES | NO | YES | ||
| E | AP | P | PB_ESC_V127 | Existence of a library in good condition. | X | ● | YES | YES | NO | NO | YES | |||
| D | P | P | Pedagogical Practices | PB_PROF_V219 | The Teacher and Principal understand that quality is a collective responsibility and helps to improve performance. | X | ● | ↑ | 41,46% | 0,00% | 0,00% | 100,00% | 50,00% | |
| D | P | P | PB_DIR_V264 | Principal discusses measures with teachers with the objective of improving students’ teaching and learning (Always or Almost always). | X | X | ● | YES | NO | NO | NO | NO | ||
| P | P | P | PB_PROF_V215 | Frequent discussion with school management about educational goals and performance improvement. | X | ● | ↓ | 3,97% | 0,00% | 0,00% | 0,00% | 0,00% | ||
| D | P | P | PB_DIR_V503 | School receives the textbooks chosen at the beginning of classes. | X | ● | ↑ | 71,40% | 100,00% | 50,00% | 100,00% | 100,00% | ||
| D | P | P | PB_DIR_V509 | All students have a textbook. | X | ● | ↑ | 66,72% | 100,00% | 50,00% | 100,00% | 100,00% | ||
| T | AP | C | C_TURM_V08 | Foreign Language course offer is associated with good performance. | X | ● | YES | YES | YES | YES | YES | |||
| D | D | P | Pedagogical Practices | PB_DIR_V196 | Principal tracks the school’s SAEB results. | X | ● | YES | NO | YES | YES | YES | ||
| D | D | P | PB_DIR_V201 | Principal tracks the results of the municipality’s SAEB. | X | ● | YES | YES | YES | YES | YES | |||
| D | D | P | PB_DIR_V206 | Principal tracks the results of the state SAEB. | X | ● | YES | NO | YES | YES | YES | |||
| D | D | P | PB_DIR_V226 | Adopt criteria for the formation of heterogeneous classes in relation to performance. | X | ● | YES | NO | NO | YES | NO | |||
| D | D | P | PB_DIR_V246 | Principal performs actions to reduce dropout rates. | X | ● | YES | YES | YES | YES | YES | |||
| A | A | P | PB_ALUN_V38 | Follow-up from parents for attending classes. | X | ● | ↑ | 98,60% | 100,00% | 99,00% | 100,00% | 98,00% | ||
| D | D | P | PB_DIR_V253 | Adoption of actions to reduce failure. | X | X | ● | YES | YES | NO | NO | YES | ||
| D | D | P | PB_DIR_V258 | Offer of extra-classes school tutoring. | X | ● | YES | YES | YES | YES | YES | |||
| A | A | P | Family Participation | PB_ALUN_V29 | Parents’ participation in school meetings. | X | ● | ↑ | 55,40% | 86,00% | 67,00% | 69,00% | 64,00% | |
| A | A | P | PB_ALUN_V34 | Follow-up from parents about homework. | X | ● | ↑ | 95,10% | 100,00% | 98,00% | 92,00% | 95,00% | ||
| A | A | P | PB_ALUN_V38 | Follow-up from parents about attending classes. | X | ● | ↑ | 98,60% | 100,00% | 99,00% | 100,00% | 98,00% | ||
| A | A | P | PB_ALUN_V36 | Parents’ encouragement to read. | X | ● | ↑ | 88,40% | 95,00% | 91,00% | 88,00% | 86,00% | ||
| A | A | P | Family Aspects | PB_ALUN_V07 | Mother with incomplete primary education. | X | X | ♦ | ↓ | 15,70% | 9,00% | 12,00% | 23,00% | 19,00% |
| A | A | P | PB_ALUN_V11 | Mother with complete higher education. | X | X | ● | ↑ | 12,30% | 5,00% | 12,00% | 8,00% | 5,00% | |
| A | A | P | PB_ALUN_V22 | Father with complete higher education. | X | X | ● | ↑ | 9,10% | 9,00% | 10,00% | 0,00% | 0,00% | |
| A | A | P | PB_ALUN_V24 | Father can read and write. | X | X | ● | ↑ | 95,70% | 95,00% | 100,00% | 92,00% | 98,00% | |
| A | A | P | PB_ALUN_V44 | Mother can read and write. | X | X | ● | ↑ | 97,80% | 95,00% | 100,00% | 100,00% | 95,00% | |
| A | P | P | PB_PROF_V272 | Influence of the student’s social environment. | X | ● | ↑ | 23,13% | 0,00% | 50,00% | 0,00% | 33,33% | ||
| A | P | P | Family Aspects | PB_PROF_V274 | Cultural level of parents. | X | ● | ↑ | 24,03% | 0,00% | 50,00% | 0,00% | 0,00% | |
| A | A | P | PB_ALUN_V47 | Student see the mother reading. | X | X | ● | ↑ | 88,90% | 95,00% | 86,00% | 92,00% | 81,00% | |
| A | A | P | PB_ALUN_V27 | Student see the father reading. | X | ● | ↑ | 74,60% | 90,00% | 79,00% | 69,00% | 71,00% | ||
| A | A | P | PB_ALUN_V02 | Having a computer at home has a positive effect. | X | ● | ↓ | 19,30% | 27% | 11% | 23 | 24 | ||
| A | P | P | Students Habits | PB_PROF_V280 | Students’ lack of interest and effort. | X | ♦ | ↓ | 91,68% | 100,00% | 100,00% | 100,00% | 100,00% | |
| A | P | P | PB_PROF_V278 | Low self-esteem of the student. | X | ♦ | ↓ | 66,88% | 0,00% | 50,00% | 100,00% | 100,00% | ||
| A | P | P | PB_PROF_V282 | Students’ indiscipline. | X | ♦ | ↓ | 66,29% | 0,00% | 50,00% | 0,00% | 100,00% | ||
| A | P | P | PB_PROF_V284 | High absenteeism rate of the student (++). | X | ♦ | ↓ | 28,94% | 0,00% | 50,00% | 100,00% | 33,33% | ||
| D | D | P | PB_DIR_V457 | School functioning interrupted by indiscipline problems. | X | X | ♦ | NO | NO | NO | YES | NO | ||
| A | A | P | PB_ALUN_V87 | Likes Portuguese language discipline. | X | X | ● | ↑ | 72,70% | 73,00% | 79,00% | 81,00% | 67,00% | |
| A | A | P | PB_ALUN_V107 | Use the school library and reading room (Always). | X | X | ● | ↑ | 21,40% | 5,00% | 2,00% | 4,00% | 17,00% | |
| A | A | P | Students Habits | PB_ALUN_V66 | Frequency of going to the cinema (Always). | X | X | ♦ | ↓ | 15,90% | 14,00% | 31,00% | 8,00% | 0,00% |
| A | A | P | PB_ALUN_V69 | Frequency with which the student goes to shows and exhibitions (Always). | X | X | ♦ | ↓ | 7,20% | 5,00% | 6,00% | 0,00% | 14,00% | |
| A | A | P | PB_ALUN_V74 | Time spent on TV, internet and games. | X | X | ● | ↑ | 19,90% | 18,00% | 16,00% | 15,00% | 14,00% | |
| A | A | P | Students Habits | PB_ALUN_V89 | Frequency of doing Portuguese language homework. | X | X | ● | ↑ | 54,30% | 77,00% | 63,00% | 54,00% | 17,00% |
| A | A | P | PB_ALUN_V34 | Follow-up from parents about homework. | X | ● | ↑ | 95,10% | 100,00% | 98,00% | 92,00% | 95,00% | ||
| A | A | P | PB_ALUN_V36 | Parents’ encouragement to read. | X | ● | ↑ | 88,40% | 95,00% | 91,00% | 88,00% | 86,00% | ||
| A | A | P | PB_ALUN_V45 | Frequency of reading books of general interest (Always). | X | ● | ↑ | 27,90% | 23,00% | 31,00% | 16,00% | 5,00% | ||
| A | A | P | PB_ALUN_V42 | Frequency of reading newspapers (Always). | X | ♦ | ↓ | 6,20% | 0,00% | 4,00% | 0,00% | 3,00% | ||
| A | A | P | PB_ALUN_V55 | Frequency of comic book reading (Always). | X | ● | ↑ | 44,10% | 45,00% | 48,00% | 38,00% | 47,00% | ||
| A | A | P | PB_ALUN_V48 | Frequency of reading Literature books (Always). | X | ● | ↑ | 24,10% | 23,00% | 31,00% | 13,00% | 13,00% | ||
| A | A | P | PB_ALUN_V57 | Frequency of reading behavioral magazines (Always). | X | X | ♦ | ↓ | 27,40% | 36,00% | 19,00% | 8,00% | 28,00% | |
| A | A | P | PB_ALUN_V51 | Frequency of reading magazines in general (Always). | X | X | ♦ | ↓ | 15,70% | 10,00% | 16,00% | 22,00% | 5,00% | |
| A | A | P | PB_ALUN_V60 | Frequency of reading news on the Internet (Always). | X | ♦ | ↓ | 56,60% | 41,00% | 61,00% | 63,00% | 49,00% | ||
| A | A | P | PB_ALUN_V63 | Frequency of visits to the Library. | X | ● | ↑ | 11,40% | 0,00% | 6,00% | 0,00% | 7,00% | ||
Source: Elaborated by the authors (2021)
Legenda:
Effect ♦ Negative (*) P = Teacher | A = Student | D = Director | T = Class | E = School | AP = Prova Brasil Applicant ● Positive (**) C = Scholar Census | B = Prova Brasil
4 Conclusion
In this research, indicators and pedagogical and management goals used in high-performance municipal elementary schools in reading and writing evaluations were identified. Aware of the importance of socioeconomic factors in the performance of students, the authors chose to analyze the practices performed in Brazilian municipal elementary schools of similar socioeconomic level. Indicators related to the various actors of the educational process were found, namely: students, teachers and principals. Of these actors, some were related to the Principal’s management skills, reinforcing his/her role in promoting the quality of teaching.
This article approaches the multiple dimensions of quality pointed out in the literature through social, economic, organizational and institutional performance variables.
The results contribute to show that factors are related to quality of Education, represented here by the concept of school performance; however, other dimensions such as social inequality, teacher Education, management capacity of the principal, pedagogical activities and intra and extra school learning strategies are understood as explanatory factors.
For policymakers, this paper also contributes by presenting a benchmarking of efficient schools. This measure points to a direction for the planning of school principals and education departments.
Results corroborate the importance of the school and the adoption of good pedagogical and management practices in the educational process. In addition, resorting to this study, it is possible for each school to evaluate its own individual performance in relation to each of the indicators related to school performance in reading and writing.
This research is limited to the use of quantitative data for analysis and completion. In addition, the database used to identify explanatory factors comes from declaratory and opinion research, which could have subjectivity in perception. Still, we chose it use it because it is the only database available. Future research should include qualitative data analysis and on-site research on how these practices are performed, thus providing subsidies to the various educational actors for the performance of their functions.

