


 Inglês (pdf)
 Artigo em XML
 Enviar este artigo por email
 Permalink
1 Introduction
The educational training process at an undergraduate level is fundamental for the regional development (economic, political, social) of several characteristics, impacting the formation and the aspect of society inserted in each context. Within this process, the student’s Education must be complete to obtain good academic results by approving the steps proposed by the course he has chosen to take. Some researchers still highlight Higher Education training linked to incorporation into the social world (BEAUMONT; MOSCROP; CANNING, 2016; KOIVUNIEMI et al., 2017; OLIVEIRA; LUZ; OLIVEIRA, 2020; SÁEZ et al., 2018).
When viewing the reality of Brazil, Higher Education can bring economic and social benefits to the country and the people who graduate, however, retention, which is conceptualized as the student’s prolonged stay in the higher course, in which the student remains enrolled in the Undergraduate course for a longer time than planned by the curriculum of the educational institution, impacts the regional and personal development of the population (LIMA JUNIOR et al., 2019).
Carnevale, Hanson and Gulish (2013) highlight that good academic performance is fundamental for the economic development of countries, generating a long-term economic perspective, in which it is understood that most jobs in the 21st century, for example, will require Higher Education. Thus, understanding the academic results of undergraduate students is essential to identify problems and making it possible to distinguish factors and characteristics that form the teaching-learning environment. Cox Méndez (2006) mention that several factors need to be evaluated to facilitate interpreting the results in that process.
According to Xie and Zhang (2020), the relationship between faculty members, and students and their characteristics is fundamental in the teaching-learning process, becoming relevant for the excellent performance of students, for obtaining good grades, and, consequently, for approval in the subjects provided for in the course. Some of the difficulties may be related to the course chosen by the student, such as the methodology of the faculty member’s, lack of knowledge about the course, and the complexity of the subject being studied (DONOSO-DÍAZ; ITURRIETA; TRAVERSO, 2018).
There are factors related to students and faculty members that can influence academic approval rates. On the part of the students, there are elements such as age, attendance in the classroom, finances, family, and availability to study outside the usual hours of the classroom. Regarding faculty members, the influence occurs through observation of their training, the type of contract, and the degree, among others (GOES, 2007; HARRIS; SASS, 2011).
Based on the understanding that Higher Education plays an essential role in social, economic, and political development and that models that meet the excellent performance of students should be sought, the research question arises: What are the factors related to students and professors that influence the approval rates of the higher course in Management Processes in a Brazilian public institution?
From this question, the general objective was defined: to identify statistically which factors related to students and faculty members impact the approval rates in the undergraduate course in Management Processes. A case study was applied to a higher course in Management Processes at a public Brazilian educational institution to carry out this research. The factors evaluated were the age of the student, approval status in the subject, the frequency of the student in the classroom, the student’s grade in the subject, the type of contract of the faculty members (temporary or effective) if they have a degree and their title (just undergraduate, or master, or Ph.D.), comparing them to student approval rates. This work is justified because it supports identifying factors that can impact the performance of the teaching-learning process of students and, consequently, their approval rate, generating a set of information for analysis and organizational decision-making to improve results, process, and approval rates. This research comprises the sections introduction, conceptual framework, method, results, analysis of results, and conclusions.
2 Conceptual Framework
The hypothetical framework is organized from two different dimensions: the student and the faculty members. In the dimension of the faculty members, it is assumed that those with Higher Education, faculty members that have an effective work contract and a higher level of degree can lead their students to better results in the classroom and, consequently, obtain higher approval rates due to your preparation. This assumption is based on Lee and Lee (2020), who describe some studies that demonstrate a positive relationship between faculty member’s Education and student performance. This positive relationship is also presented in other studies (BETTS; ZAU; RICE, 2003; HARRIS; SASS, 2011). However, different results present no significant relationship between faculty members training and student performance, i.e., there is no consensus on the topic (BUDDIN; ZAMARRO, 2009; GOES, 2007).
In their study, Frison et al. (2021) expose that part of Brazilian and Portuguese students as a problem, with the teaching method adopted by faculty members, considering it little stimulating. This perception is also reported by research by Panadero and Alonso-Tapia (2014) that only part of the faculty members works with methodologies that represent a pedagogical alternative in the teaching-learning process. Another pointed out was about elements of faculty members training and didactics, which one of the facilitators in the teaching-learning processes and the activities developed in the classroom (OLIVEIRA et al., 2014).
Another dimension assessed concerns the characteristics of the students. For example, Calcagno et al. (2008), point out that students aged 25 and over are less likely to have good academic performance rates when compared to younger students. Older students are more likely to have to support a family, have a job, and have a work schedule that is incompatible with their studies, which certainly makes it difficult to allocate time for academic activities, increasing the likelihood of staying in college for a while bigger than expected (ARAÚJO; MARIANO; OLIVEIRA, 2021).
This negative relationship is also perceived to about students with a lower attendance rate in the classroom. From the discussions presented, Figure 1 was elaborated, which represents the elements that influence the academic performance of the students analyzed in this research.
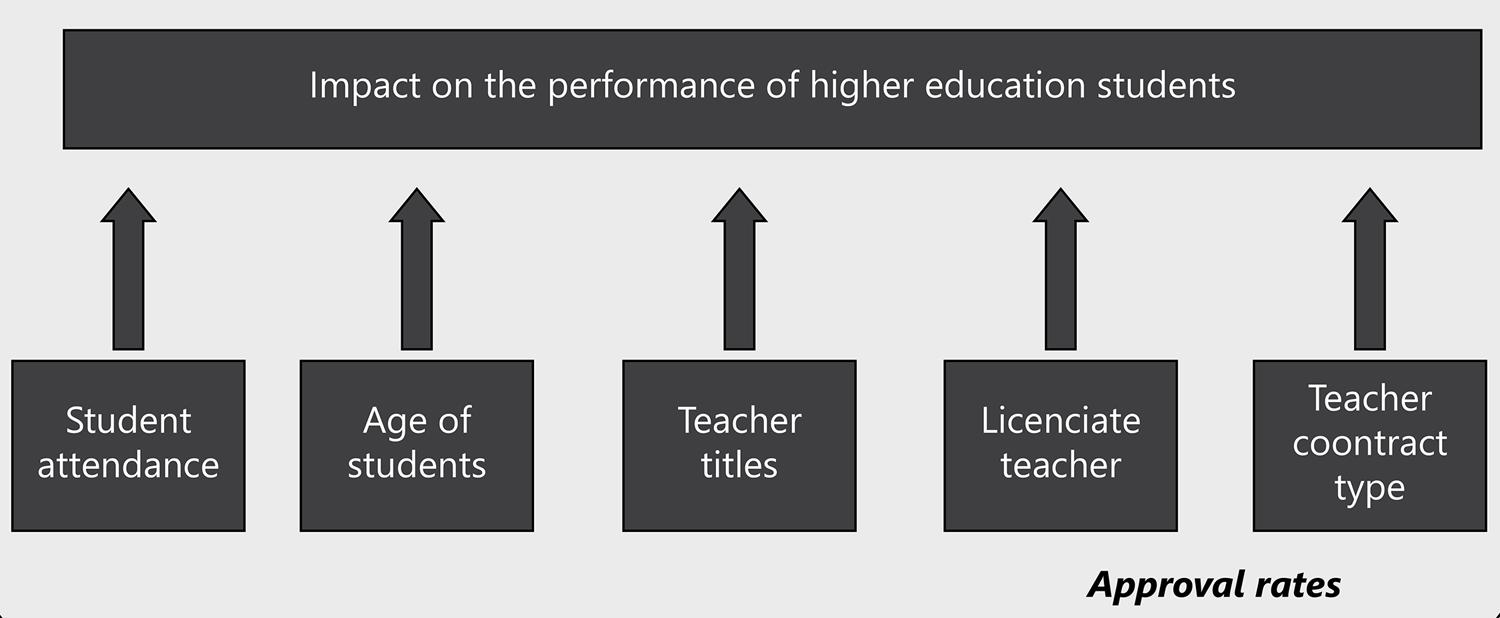
The conceptual framework, elaborated after searches in the existing literature, presents five factors that somehow impact the approval rate of undergraduate students in Higher Education, which are the frequency in the classroom and age of students and the degree, possession of a degree, and the type of faculty member’s contract, and it is used as the database in this case study. The detailed hypotheses for understanding the impact of the factors evaluated are organized in the next section.
2.1 Formulation of hypotheses
For each assessment of the dates, the null hypothesis was, elaborated and, consequently, the alternative hypothesis to reject the null hypothesis. The elaborate hypotheses are outlined in Table 1.
Table 1 Hypotheses elaborated for the execution of the statistical tests
| Issue | Hypotheses |
|---|---|
| 1 | |
| 2 | |
| 3 | |
| 4 | |
| 5 | |
| 6 | |
| 7 | |
| 8 | |
| 9 |
Source: Elaborated by the authors (2022)
The hypotheses are tested with the software R Studio Cloud (COMPUTING, 2021).
3 Method
For this research, we chose to use the case study as a research method. Dresch, Lacerda and Antunes Junior (2015) mention that this method is used for complex problems, to understand why the problems occur. In research using the case study, it is essential to organize five components, which are (YIN, 2015):
The case study questions;
Prepositions;
The unit of analysis;
The logic that links data to propositions; and
The criteria for interpreting the findings.
The case study questions are presented in the introduction to the research. In this stage, the motivation of the research is highlighted, and organized in the question of research and objectives. The prepositions described in hypothesis format are detailed in Table 1 and were answered in the results and interpreted in the data analysis.
This case study will be a type 1 (holistic) project, which, according to Yin (2015), is characterized by evaluating a unit of analysis once at a time. Such an option occurs due to the characteristic of the sample.
Students of the undergraduate course integrate the unit of analysis of this case study in Management Processes of the Instituto Federal do Rio Grande do Sul (IFRS), campus Caxias do Sul, located in the South of Brazil. IFRS is a federal autarchy, a public educational institution, which offers technical, undergraduate, post-graduate lato sensu, and stricto sensu courses. It has 17 campuses in the state of Rio Grande do Sul, spread over different cities in the region.
The undergraduate course in Management Processes at IFRS, campus Caxias do Sul has been offered at the institution since 2017, with annual admission of 40 students. The course has a total of 1,699 hours, fully face-to-face, of which 1,617 hours are organized into subjects, 66 hours in course completion work, and 16 hours in complementary course activities.
The sample analyzed refers to students entering the course in the years 2017 and 2018. Its definition occurred due to the need for students to have completed part of the course to enable data for the assessment. The sample is composed of 63 students and is characterized according to data organized in Table 2.
Table 2 Characterization of students who served as a sample in this case study
| Characteristics | Category | Sample |
|---|---|---|
| Gender | Male | 33 students |
| Female | 30 students | |
| Average ages | Male | 31.97 years old |
| Female | 32.46 years old | |
| Age range | From 20 to 25 years old | 12 students |
| From 26 to 30 years old | 21 students | |
| From 31 to 35 years old | 10 students | |
| From 35 to 40 years old | 10 students | |
| From 41 to 45 years old | 4 students | |
| > 45 years old | 6 students |
Source: Elaborated by the authors (2022)
The database was extracted from the student’s academic records and had 1.372 rows and 13 columns. The columns have this information: 1. Student’s name; 2. Gender; 3. Age; 4. Subject; 5. Faculty members; 6. Student attendance in the classroom; 7. Grade of student in the subject; 8. Status of the student (approved or disapproved) in the subcject; 9. Student age range; 10. The student frequency range in the classroom; 11. Type of faculty members contract (permanent or temporary); 12. The faculty members has a licentiate degree, and; 13. Faculty members degree (just undergraduate, or master, or Ph.D.).
As mentioned in the previous sections, it is believed that some factors impact the students’ approval rate, such as the example age and frequency in the classroom of students, the type of contract, and faculty members degrees. For such an analysis, research was organized on issues to be applied through statistical tests.
To assess the data, Student’s t-tests were used for hypotheses 1 and 3. For hypotheses 4, 5, and 6, the chi-square test was used. For hypothesis 2, analysis of variance (ANOVA) was used. At this point in the research, an index of a maximum of 5% significance was used; that is, the chance of inappropriately rejecting the null hypothesis was 5%. For the age indices, students were segregated according to the index shown in Table 2. For frequency in the classroom indices, by curriculum component, students were separated as described in Table 3.
4 Results
The hypotheses were tested using the tests described in the section called Formulation of Hypotheses. The first test performed was to identify the relationship between the frequency in the classroom index in the classroom and the approval index. The results of the t-student test are described in Table 4
Table 4 Results of the t-student test for the relationship between attendance index in the classroom and approval index
| Statistics t | Degrees of freedom | P-value | Mean Difference |
|---|---|---|---|
| 30,796000 | 63,406000 | 0,003063 | 4,212450 |
Source: Elaborated by the authors (2022)
Evaluating the data in Table 4, it can be seen, from the p-value, that the null hypothesis was rejected, accepting the alternative hypothesis. There is a positive relationship between the frequency index in the classroom and the approval index, that is, the higher index of the frequency in the classroom impact in higher the approval index. This result can be better interpreted after the assessment of hypothesis 9.
The next item assessed refers to the influence that the faculty members of the subject have on the grades obtained by the students. For this test, analysis of variance (ANOVA) was applied, in which faculty members, and students’ grades were compared. The data are shown in Table 5.
Table 5 Results of the ANOVA test between grades obtained by students and faculty members
| Df Sum | SqMean | Sq F | Value | Pr(>F) | |
|---|---|---|---|---|---|
| Base_anova$Docente | 27 | 588 | 27.763 | 3.143 | 1.41e-07*** |
| Residuals | 1344 | 9334 | 6.945 | - | - |
Source: Elaborated by the authors (2022)
Table 5 shows that the p-value is much less than 0.05, not allowing the rejection of the null hypothesis, in which the faculty members can influence the students’ grades. This result can be better understood after analyzing hypothesis 8, which assesses the association between the Subjects and the approval rate.
The following assessment was carried out to understand whether there is a relationship between the age range of the students and the approval rate in the subjects. For this assessment, the t-student test was applied, and its result is described in Table 6.
Table 6 Results of the t-student test between the age of the students and approval index
| Statistics t | Degrees of freedom | P-value | Mean Difference |
|---|---|---|---|
| 2,738600 | 67,929000 | 0,007872 | 3,002870 |
Source: Elaborated by the authors (2022)
Exploring the results shown in Table 6, it can be seen, through the p-value, that the null hypothesis was rejected, favoring the acceptance of the alternative hypothesis (the age group interferes with the approval index). Table 7 shows the proportion of approvals by age group of students over 40 years of age who approve more than younger students.
Table 7 Student approval rate by age range
| Age Range | Approved subjects index | No approved subjects index | Approval ratings (%) |
|---|---|---|---|
| 40–45 | 100 | 2 | 98 |
| > 45 | 128 | 15 | 90 |
| 35–40 | 180 | 27 | 87 |
| 30–35 | 192 | 32 | 86 |
| 20–25 | 219 | 40 | 85 |
| 25–30 | 352 | 85 | 81 |
Source: Elaborated by the authors (2022)
Subsequently, the relationship between the degree of the professor (just undergraduate, master, or Ph.D.) and the academic approval index was analyzed. In this stage, the chi-square test was performed, and the results are shown in Table 8.
Table 8 Results of the chi-square test between the professor’s degree and the approval index
| Statistics X2 | Degrees of freedom | P-value |
|---|---|---|
| 1,95330 | 2,00000 | 0,37660 |
Source: Elaborated by the authors (2022)
It is noticed that, in this case, due to the high value of the p-value, the null hypothesis cannot be rejected; that is, the approval rate of the students does not depend on the professor’s degree. The chi-square test was also used to assess the relationship between the faculty member’s degree qualification (being licensed to teach classes) and the academic approval index in the subjects. The results are described in Table 9.
Table 9 Results of the chi-square test, between the faculty members degree qualification and the approval index
| Statistics X2 | Degrees of freedom | P-value |
|---|---|---|
| 0,85216 | 1,00000 | 0,3559 |
Source: Elaborated by the authors (2022)
The test presented a representatively significant value for p; that is, the null hypothesis cannot be rejected. Thus, it cannot be said that the faculty members degree qualification influences the students’ approval rate. Subsequently, the same test was applied to verify whether the type of faculty members contract (effective or temporary) interferes with the students’ approval rate (Table 10).
Table 10 - Results of the chi-square test, between the type of faculty members contract, and approval index
| Statistics X2 | Degrees of freedom | P-value |
|---|---|---|
| 3,2744 | 1,00000 | 0,0737 |
Source: Elaborated by the authors (2022)
Likewise, the null hypothesis cannot be rejected; that is, the type of faculty members contract does not influence the students’ approval rate. To assess the association between the students’ age range (segregation defined in the method) and the approval index in the subjects, the APRIORI algorithm (COMPUTING, 2021) was used. The results are recorded in Table 11.
Table 11 Results of the association rules between the students’ age group and the approval rate
| Age Range | Status | Support | Confidence | Lift | Count |
|---|---|---|---|---|---|
| 40–45 | Approved | 0,0853971 | 0,990099 | 1,0425 | 100 |
| 35–40 | Approved | 0,15371477 | 0,9836066 | 1,0356 | 180 |
| > 45 | Approved | 0,10930828 | 0,969697 | 1,021 | 128 |
| 30–35 | Approved | 0,16396243 | 0,9648241 | 1,0159 | 192 |
| 20–25 | Approved | 0,18701964 | 0,9439655 | 0,9939 | 219 |
| 25–30 | Approved | 0,30059778 | 0,9142857 | 0,9626 | 352 |
Source: Elaborated by the authors (2022)
Analyzing the data of Table 11, which presents data in agreement with Table 7, it is noted that there are more positive association rules; that is, some age groups have stronger rules between the approval index and the age group of the students. Through the lift index, the data show that students aged between 40 and 45 years old have an association with approval 4.25% higher than the average of students. At the other extreme, students aged between 25 and 30 years old have an association of 3.73% less than the average. This analysis reveals ‘that older students (over 30 years old) are more likely to approve than students under the age of 30.
The relationship between the subject and the academic approval index was also detailed. The intention was to understand if some subjects demonstrate a more significant association with the approval rate. For the execution of this test, the APRIORI algorithm was used, and the results are listed in Table 12.
Table 12 Results of the association rules between the Subjects attended by the students and the approval index
| Subject | Support | Confidence | Lift | Count |
|---|---|---|---|---|
| Entrepreneurship and innovation II | 0,0179 | 1,0000 | 1,0529 | 21 |
| Quality management | 0,0444 | 1,0000 | 1,0529 | 52 |
| Knowledge and skills management | 0,0179 | 1,0000 | 1,0529 | 21 |
| Libras | 0,0367 | 1,0000 | 1,0529 | 43 |
| Sales and negotiation workshop | 0,0350 | 1,0000 | 1,0529 | 41 |
| People management II | 0,0453 | 0,9824 | 1,0344 | 53 |
| Introduction to marketing | 0,0478 | 0,9824 | 1,0344 | 56 |
| Instrumental english | 0,0401 | 0,9791 | 1,0310 | 47 |
| Entrepreneurship and innovation I | 0,0384 | 0,9782 | 1,0300 | 45 |
| Supply chain and logistics management | 0,0196 | 0,9777 | 1,0295 | 23 |
| Applied computer science I | 0,0376 | 0,9777 | 1,0295 | 44 |
| Applied computer science II | 0,0325 | 0,9743 | 1,0259 | 38 |
| Fundamentals of administration | 0,0436 | 0,9622 | 1,0132 | 51 |
| Financial math | 0,0436 | 0,9622 | 1,0132 | 51 |
| People management I | 0,0427 | 0,9615 | 1,0124 | 50 |
| Strategic management and planning | 0,0196 | 0,9583 | 1,0094 | 23 |
| Ethics and social practices | 0,0350 | 0,9534 | 1,0039 | 41 |
| General and management accounting | 0,0444 | 0,9454 | 0,9955 | 52 |
| Financial management | 0,0427 | 0,9433 | 0,9933 | 50 |
| Production systems | 0,0401 | 0,9400 | 0,9897 | 47 |
| Ergonomics and safety at work | 0,0350 | 0,9318 | 0,9811 | 41 |
| Environmental management | 0,0333 | 0,9285 | 0,9777 | 39 |
| Costs management | 0,0333 | 0,9285 | 0,9777 | 39 |
| Process analysis | 0,0205 | 0,9230 | 0,9719 | 24 |
| Project management | 0,0205 | 0,9230 | 0,9719 | 24 |
| Reading and production of academic texts | 0,0359 | 0,9130 | 0,9613 | 42 |
| Research methodology | 0,0342 | 0,8888 | 0,9359 | 40 |
| Economic scenarios and the business world | 0,0325 | 0,8636 | 0,9093 | 38 |
| Planning and production control | 0,0299 | 0,8139 | 0,8570 | 35 |
Source: Elaborated by the authors (2022)
Table 12 shows that some Subjects have rules of positive association, while others have rules of a negative association with the indices of probation. There is a set of five Subjects (Entrepreneurship and Innovation II, Quality Management, Knowledge and Skills Management, Libras - Brazilian Sign Language, and Negotiation and Sales Workshop) that presents a positive association rule, that is, the possibility of being approved in these disciplines is greater because the combination of approval and discipline shows the highest lift rates (forces of association). On the other hand, other Subjects have weaker associations, emphasizing Project Management, Reading and Production of Academic Texts, Research Methodology, Economic Scenarios, and the Business World, and, finally, Planning, Programming and Production Control. The possibility of not being approved in these disciplines is greater since the combination between approval and the discipline has the lowest lift rates (forces of association).
Through the perception that there are different association rules by subject, better approval rates can also be related to the complexity of each subject. This reinforces the lack of influence on the approval rates of the professor who is responsible for ministering the subject and our degree (only graduated, master or Ph.D.) or type of contract (effective or temporary).
Concerning the relationship between the student attendance index in the classroom and the approval index, the APRIORI algorithm was applied. The results are described in Table 13.
Table 13 Results of the association rule between students’ attendance index and the approval index
| Attendance range | Status | Support | Confidence | Lift | Count |
|---|---|---|---|---|---|
| 87–93 | Approved | 0,19897523 | 0,9708 | 1,0222 | 233 |
| 94–100 | Approved | 0,47566183 | 0,962 | 1,0129 | 557 |
| 81–86 | Approved | 0,16396243 | 0,96 | 1,0108 | 192 |
| 75–81 | Approved | 0,16140051 | 0,913 | 0,9613 | 189 |
Source: Elaborated by the authors (2022)
Table 13 shows that there are positive associations between attendance in the classroom rates and student approval. Those with higher rates of attendance have a greater association with the approval rate. Students with an attendance rate between 75% and 81% have a possibility of non-association with the approval of 4% less than the average of students.
5 Analysis of results
Evaluating the collected results is an essential mission in research because it enriches existing knowledge or generates the opportunity to develop new knowledge. This research was developed based on assumptions organized in hypotheses, which were accepted or rejected through statistical analysis of data.
The first assumption evaluated refers to the impact of the frequency indexes in the classroom on the approval rates of the selected academics. The evaluation was positive. In Table 3, it is possible to observe that the statistical test accepts the alternative hypothesis that the student’s attendance in the classroom rates influences the approval rate. Table 13 completes the assessment using the association rules, as it shows which frequency indexes are most likely to pass. For example, students with less frequency (75% to 86%) have less chance of approval when compared with the other groups (87% to 100% of frequency). The data presented in the research agree with the data presented by (ARAÚJO; MARIANO; OLIVEIRA, 2021; CALCAGNO et al., 2008). Thus, there is a need for Higher Education institutions (undergraduate courses) to devise strategies that increase the frequency of students in the classroom to obtain greater approval rates.
The second assumption examined is related to the age of the students and the approval rate. The analyzed data differed from the data presented by Calcagno et al. (2008) since these authors mention that younger students or up to 25 years of age present better academic performance. Table 4 shows that acceptance of the alternative hypothesis is possible when comparing the age group of the students with the approval rate in the subjects. It is worth mentioning that the rule of association between the age groups of the sample and the approval index was used. The data presented in Tables 7 and 11 indicate that students aged up to 30 years old are less likely to pass when compared to age groups older than 30. However, it is possible to state that students with a larger age and the reflexes of age and factors indicated by Araújo, Mariano and Oliveira (2021), such as supporting a family, having a job and having a work schedule incompatible with studies, do not apply in this sample
Some assumptions assessed relate to the faculty member’s and the student’s approval rating. Such assumptions considered factors related to the degree, possession of a degree (just undergraduate, master, or Ph.D.), and type of contract (temporary or effective) with the educational institution. According to Tables 5, 8, 9, and 10, there is a characteristic among the data that needs to be discussed. Tables 8, 9, and 10, respectively, do not present the possibility of rejecting the null hypothesis. It is not possible to state that the professor’s degree, possession of undergraduate training, and the type of contract impact on approval rates. Table 5 shows the possibility of accepting the alternative hypothesis, that is, the faculty members interfere with the grades obtained by the students.
It is understood that some faculty members apply higher grades to their students than others, as well as it is known that some subjects are more complex than others and, consequently, have lower grades within the same course. This understanding is reinforced by the data presented in Table 12, in which the rule of association between subjects and the approval index applies. Some subjects are more likely to pass than others. Thus, it cannot be said that the impact of the data presented in Table 5 is the responsibility of the faculty members, but, possibly, of the complexity of the subject for which them is responsible. This assessment contrasts harmoniously with the author’s citation Donoso-Días, Iturrieta and Traverso (2018) that the complexity of the subject addressed was the lowest performing influencer in student approval rates, however, no influence of factors related to Type of faculty member’s contract (permanent or temporary), the faculty members has a licentiate degree and teacher degree (just undergraduate, master, or Ph.D.).
6 Conclusion
From the sample evaluated, it is concluded that it is possible to identify factors that impact the approval rates in the subjects of students of the undergraduate course in Management Processes at IFRS, Caxias do Sul campus were age range and attendance in the classroom. It was not noticed that factors related to faculty members (their degree, undergraduate Education, and the type of employment contract) impact the approval rates. However, it was found that the complexity of some subjects can interfere with the average obtained by students and the approval rate.
This work has some limitations, such as, for example, assessing qualitative factors of students and their impact on approval rates (weekly time dedicated to studies outside the classroom, with whom they live, family situation (married or single), if they have children, distance, and time from the place of residence and work to the study environment).
These limitations, in turn, provide opportunities for future research, in which students’ data can be completed with qualitative information and applied to statistical analysis to verify the existence of other factors that impact approval rates but not yet presented. Future research opportunities may be expanded to more courses at the institution and with a larger sample of students to validate the factors presented as relevant and considering the relationship between students and professors.

