


Serviços Personalizados
Journal

Artigo
 texto em
  Inglês (pdf)
 Artigo em XML
 Enviar este artigo por email
Compartilhar

 Permalink
Revista Brasileira de Educação
versão impressa ISSN 1413-2478versão On-line ISSN 1809-449X
Rev. Bras. Educ. vol.25 Rio de Janeiro jan./dez 2020 Epub 17-Dez-2020
https://doi.org/10.1590/s1413-24782020250064
ARTICLE
Performance of quota students in the national exam for evaluating student achievement: evidence on federal higher education institutions
I
 http://orcid.org/0000-0003-4036-5429
I
http://orcid.org/0000-0001-7354-5632
IUniversidade Federal do Ceará, Fortaleza, CE, Brazil.
The performance differential between quota and non-quota students at the National Exam for Evaluating Student Achievement between 2013-2015 is investigated using data from the National Institute for Pedagogical Studies, as well as whether there is a heterogeneous effect between the types of available quotas: ethnic-racial, income, public school, combination, and others. Two methods were used: Balancing by Entropy and Matching by Propensity Score (Pareamento por Escore de Propensão) for multiple treatments. The results show that the quota effect was significant, but negative on the gross grade. In the multiple treatment model, there is a negative and significant effect on ethnic-racial, income, and others quotas. However, they were positive and significant in public and combination schools. It is concluded that the performance is affected in a heterogeneous way depending on the type of quota. In addition, on average, quota students perform below non-quota ones in ENADE.
KEYWORDS performance differential; quota students; National Exam for Evaluating Student Achievement
Investiga-se o diferencial de desempenho entre os estudantes cotistas e não cotistas no Exame Nacional de Desempenho de Estudantes (ENADE) entre 2013 e 2015 com base em dados do Instituto Nacional de Estudos e Pesquisas Educacionais Anísio Teixeira, assim como se há efeito heterogêneo entre os tipos de cotas disponíveis: étnico-racial, renda, escola pública, combinação e outros. Foram utilizados dois métodos: balanceamento por entropia e pareamento por escore de propensão para múltiplos tratamentos. Os resultados apontam que o efeito das cotas foi significativo, porém negativo sobre a nota bruta. No modelo de múltiplos tratamentos, constata-se efeito negativo e significante em cotas étnico-racial, renda e outros, contudo foram positivos e significativos os efeitos em escola pública e combinação. Conclui-se que o desempenho é afetado de maneira heterogênea a depender do tipo de cota. Ademais, em média, o cotista apresenta desempenho abaixo do não cotista no ENADE.
PALAVRAS-CHAVE: diferencial de desempenho; estudantes cotistas; Exame Nacional de Desempenho de Estudantes
El diferencial de rendimiento entre los estudiantes con la cuota en el Examen Nacional de Rendimiento Estudiantil entre 2013-2015 se investiga utilizando datos del Instituto Nacional de Estudios Pedagógicos, como si hubiera un efecto heterogéneo entre los tipos de cuota disponibles: étnico-racial, ingresos, escuela pública, combinación y otros. Se utilizaron los métodos: Balance por entropía y correspondencia por puntaje de propensión para múltiples tratamientos. Los resultados muestran que el efecto de la cuota fue significativo, pero negativo en la calificación bruta. En el modelo de tratamiento múltiple, hay un efecto significativo y negativo sobre los orígenes étnicos y raciales, los ingresos y otros cuotas. Sin embargo, fueron positivos y significativos en las escuelas públicas y combinadas. Se concluye que el desempeño se ha visto afectado de manera heterogénea según el tipo de cuota. Además, en promedio, el cuotista tiene un desempeño inferior al no cuotista en ENADE.
PALABRAS CLAVE diferencial de rendimiento; cuota de estudiantes; Examen Nacional de Rendimiento Estudiantil
INTRODUCTION
Affirmative action1 policies aim to equalize opportunity among groups of individuals who have historically been in an unequal situation. Inequality is understood as a discriminatory issue and limited access to resources. Thus, according to Mayorga and Souza (2012), this policy promotes opportunities for disadvantaged groups, aiming to conquer a more egalitarian society.
The legitimation of affirmative action policies at Brazilian universities succeeds Law No. 12.711, of August 29th, 2012, known as the Quota Law (Brasil, 2012). This legislation reserves at least 50% of vacancies in federal institutions for public high school students, of which 50% must be from families with an income equal to or less than 1.5 minimum wages per capita and the other 50% for students from families with higher income than 1.5 minimum wages per capita. In both cases, a percentage is reserved for self-declared black, brown or indigenous students, considering their representativeness in the states. Law No. 13.409, of December 28th, 2016, included people with disabilities.
The loss of meritocracy is often used as an argument against educational quotas (Santos, 2013; Queiroz and Santos, 2007). In addition, some authors also emphasize the drop in quality due to the effects of peers, while other authors claim that it hurts the equality of citizens’ rights (Daflon, Feres Junior and Campos, 2013; Bittar and Almeida, 2006). Therefore, educational quotas can even encourage changes in terms of human capital accumulation (Arabage and Souza, 2017).
On the other hand, groups that speak in favor consider quotas a tool for repairing and/or preventing discrimination, since it fights inequalities (Daflon, Feres Junior and Campos, 2013).
In the literature, there is no consensus on the educational performance gap, as, while some researchers point out that non-quota students have higher performance (Velloso, 2005; Queiroz and Santos, 2007), others show that there is a performance differential in some or no courses (Valente and Berry, 2017; Gutterres, 2015; Childs and Stromquist, 2015).
In this paper, the performance of quota and non-quota students at Brazilian federal universities is investigated with data from the National Assessment of Student Achievement (Exame Nacional de Desempenho de Estudantes - ENADE) from 2013 to 2015. The objective is to ascertain whether there is a difference in the performance of these students and its magnitude. In addition, the heterogeneity of existing groups of quota holders2 is explored to capture the different effects of the types of quotas in ENADE. Considering the lack of consensus in the literature regarding student performance, this research aims to contribute to the debate on this topic.
The Balancing by Entropy and Matching by Propensity Score (Pareamento por Escore de Propensão - PEP) was applied (Watson and Elliot, 2016; Hainmueller, 2012) in order to robustly balance the variables associated with ENADE performance. Given that students have the possibility to enter a higher education institution (HEI) through the quota in which they fit, a Multinomial Logit model of Multiple Treatments was carried out, which considered a categorical treatment variable3 (Rosenbaum and Rubin, 1983).
The results of the empirical strategy applied by Watson and Elliot (2016) show that, although negative, the effect of quotas was significant on ENADE’s test score. The Average Treatment Effect on the Treated (ATE) was found for the multiple treatment model, which shows that quotas of ethnic-racial (-3%) and income (-8.8%) types and others (-6.8%) showed negative and significant effects on the overall test score in ENADE. However, the quotas of public school (3.2%) and combination (2%) showed positive and significant effects on the score, that is, students who entered university through these quotas have a higher performance when compared to the control group.
Subsequently, four more sections will be presented, in addition to this introduction. The section of literature review contains the theoretical framework, covering theoretical and empirical aspects of the literature on affirmative actions at universities in Brazil and abroad. In the section of database and methodological procedures, the methodological approach is presented, followed by the results section, in which the results are interpreted. Finally, we present the final considerations.
LITERATURE REVIEW
AFFIRMATIVE ACTION AT UNIVERSITIES INTERNATIONALLY
The debate about affirmative action in the United States, for example, is older than in Brazil. Since 1960, measures have been sought to minimize the inequality of opportunities faced by minorities.
The arguments against affirmative policies are based on the disrespect for meritocracy and the dissociation of race as a determinant for educational performance. Many critics of affirmative action omit that, in North-American history, there has always been positive discrimination4 for white men (Oliven, 2007).
In the 1960s, the University of California (UC) was the first to introduce affirmative action in order to promote equal opportunities. However, in 1977, complaints about quality reduction in the university started. Thus, the UC admission process, which combines high school performance with the Scholastic Assessment Test (SAT), becomes more rigorous, so that the admission of students through affirmative actions is reduced (Moehlecke, 2004).
As the first university to revoke race as a criterion for admission to universities in the second half of the 1990s, the UC was able to verify, in 2001, that the representation of black students reached similar levels to those in the 1960s. In 1996, the racial issue at the University of Texas also ended and was replaced by the percentage regime5, similarly adopted by UC and in Florida (Cortes, 2010; Dickson, 2006; Moehlecke, 2004). The percentage used for admission to UC, 4%, is much lower than that of the University of Texas, 10%, while in Florida, with the program called Florida’s Talented 20 Program, the top 20% students in the class in high school will be admitted to a public state university (Hinrichs, 2012).
The share does not present the same results of affirmative actions for black students as before, but it was able to increase their representativeness in universities (Moehlecke, 2004; Dickson, 2006). Still on the United States, in Washington and Nebraska, voters voted to end affirmative actions (Silva, 2014; Hinrichs, 2012).
As in the United States, the establishment of affirmative action in Malaysia has affected interest in attending the university in different ways for both quota and non-quota students. The Malaysian government initiated, in 1969, what was called the New Economic Policy, which, among other aspects (labor, economic)6, included the racial composition in access to education and the end of access to universities based on individual performance, that is, the Government tried to guarantee access to higher education for Malaysians in relation to Chinese and Indian minorities in the country (Sowell, 2017).
Preferential entry into both education and employment can generate a feeling of a guaranteed future for Malaysians, reducing interest in better performance among quota holders. If, on the one hand, the Chinese minority was forced to improve its educational and professional performance, since vacancies were scarce, on the other hand the Malaysians felt less pressured. There is also a change in the incentive of those who do not benefit from quotas due to the issue of merit involved, which culminated in the departure of tens of thousands of Chinese people to study in Singapore (Horowitz, 1985).
AFFIRMATIVE ACTIONS AT BRAZILIAN UNIVERSITIES
Considering the specificities of each university, some studies were carried out in order to obtain a more precise analysis of some Brazilian HEI. In this context, at Universidade de Brasília (UnB), Universidade Estadual de Campinas (Unicamp), and Universidade Federal da Bahia (UFBA), through the Differential Performance Index (DPI), it was found that the averages between quota and non-quota students were similar and, therefore, the entrance exam score should not be used solely as a method of predicting student performance in HEI (Childs and Stromquist, 2015). Opposition to the quotas points out that this result is due to the quality of some public schools, such as federal institutes and military schools. Students who attend these institutions raise the group’s average and take advantage of university admission at UFBA (Guimarães et al., 2010).
Considering the first semester of courses at UnB, a study found that quota and non-quota students had insignificant average differences, pointing out that this difference in score is greater in the selection process than during the course (Cardoso, 2008).
At UFBA, non-quota students showed superior performance in 13 of the 48 courses analyzed, using the Performance Coefficient (PC)7. Quota students have higher performance in the arts and humanities subjects. However, it is worth noting that this result is closely related to courses considered of low prestige8. In addition, students from private schools, regardless of color/race, have better scores and performance than students from public schools (Peixoto et al., 2016; Queiroz and Santos, 2007).
At UnB, there was also a great representation of quota students in the areas of arts and humanities. There was a large number of quota-enrolled students, however, the effectiveness is higher among non-quota ones (Cardoso, 2008). In 2004, through the Final Argument (FA)9, it was found that the demand from quota holders is concentrated in less competitive courses, generating self-selection. In addition, in the most demanded courses, the percentages of mothers of students with higher level of education and of students in private education are higher (Velloso, 2005).
As for the influence of parental education for entering university, when analyzing universities with and without quotas, it was found that it has less influence on universities in which the quota law was implemented (Arabage and Souza, 2017). Furthermore, between 2004 and 2012, in the ENADE cycles, there was a decrease in the influence of parents’ education for a student to enter higher education, implying a change in the socioeconomic profile of higher education students in Brazil (Ristoff, 2014). It is noticed that high demand courses, such as Medicine and Dentistry, are composed mainly of non-quota students, corroborating the result found by Velloso (2005) and Waltenberg and Carvalho (2012). Mendes Junior (2014) notes that, although quota holders at the Universidade do Estado do Rio de Janeiro (UERJ) have a worse performance in terms of Income Ratio, they do better in relation to the graduation and dropout rates of the courses, as they present greater persistence in completing their undergraduate courses.
In state, federal, and private institutions, the higher the prestige of the course, the lower the participation of quota students, according to data from ENADE 2008. Regarding performance by race, some authors point out that black students have inferior performance in public and private institutions compared to white students - 3 and 5%, respectively (Waltenberg and Carvalho, 2012). Other researchers point out that white students obtain higher averages only in highly prestigious careers and, in other careers, the performance of black students is higher (Velloso, 2005). The author states that affirmative actions at UnB doubled the possibility of black students entering higher education. A similar result was found by Cardoso (2008) for some courses.
In this perspective, the performance of students in ENADE suggests that, in public and private HEI, public school quota holders, by combining this with another affirmative actions, obtain higher scores than those who are not quota holders. In addition, quota students due to low income present a different situation from other quota students, considering that they showed inferior performance to other students in both types of institutions (Valente and Berry, 2017; Gutterres, 2015).
Other aspects not linked to performance are also analyzed by researchers. At Universidade Federal do Sergipe (UFS), there was an increase in the self-esteem of quota students, although there are tensions of economic nature between quota and non-quota students, as well as with professors (Neves, Faro and Schmitz, 2016).
Clashes between students and professors were also observed in the University Council of the Universidade Federal do Rio Grande do Sul (UFRGS), when discussing compensatory policies, such as the reservation of vacancies in higher education, expanding the debate about the relationship among state, social justice, and democracy (Batista, 2015).
DATABASE AND METHODOLOGICAL PROCEDURES
ENTROPY BALANCING WITH MATCHING BY PROPENSITY SCORE
The objective of the quantitative evaluation of public policies is to verify whether the group of students who received any treatment, in this case, quota students (treatment group), differs in any way from the group that did not receive the treatment (control group). The best scenario for making this comparison is that the treatment and control groups are as similar as possible in terms of observed variables, except for the result variable. In the case of this study, the outcome variable is the student’s score in ENADE. Methods such as the nearest neighbor or propensity score are quite common, however, in some situations, these fail to adequately balance all distributions of observed variables (Hainmueller and Xu, 2013).
Introduced by Rosenbaum and Rubin (1983), the procedure of PEP compares the treatment group in relation to the control one in order to determine a confrontational through the similarity in the probability of receiving the treatment, so that selection biases are mitigated due to adjustments in the difference between groups.
The Entropy Balancing Method corrects these balance flaws, since, in entropy10, weights11 that satisfy a large set of conditions are assigned to achieve the desired equilibrium level. This method generates weightings to the data, enabling the weighted balance at all times in the distributions of the treatment and control covariate, that is, mean, variance, and asymmetry, respectively, the 1st, 2nd, and 3rd moments. Consequently, the efficient use of weights prevents possible loss of relevant information.
In order to properly balance all covariate distributions and reduce selection bias, that is, to obtain an ideal comparison group to the treatment, entropy balancing was used together with the PEP.
In PEP, control units receive a weight calculated according to the propensity score, which is commonly estimated through a probit or logit regression. If this model is correctly specified, then the estimated weight ensures that the covariate distribution of the weighted control units corresponds to the distribution in the treatment group.
However, in practice, this approach often fails to balance all covariates together. In contrast to other matching methods, Entropy Balancing ensures a high balance of covariates between treatment and control groups, even in small samples.
Hainmueller (2012) developed this method, which allows the weighting of a set of data, such that the distributions of the variables in the reweighted observations satisfy a set of special moment conditions, so that there is an exact balance over the first (mean), second (variance), and third (asymmetry) moments of the distribution of independent variables in both treatment and control groups. This method allows the researcher to specify a desirable equilibrium level for covariates, using a set of conditions associated with the moments of the distribution. The advantage of this method over the logit/probit algorithms lies in the ability to directly implement the exact balance.
The idea behind entropy balancing is to find weights for observations that minimize the metric distance between the treatment and control groups, considering the momentum constraints (mean, variance, and asymmetry), normality and non-negativity.
The method is as follows. Consider a sample with n 1 observations belonging to the group of treatment and n 0 students in the control group, which were randomly selected from a population of size N 1 and N 0 , respectively (n 1 ≤ N 1 en 0 ≤ N 0 ). Let D i ∈ {1,0} be a binary treatment variable, which will take the value of 1 if student i belongs to the treatment, and 0 if he/she belongs to the control group. Let X be a matrix containing the observations of J exogenous pretreatment variables; X ij corresponds to the value of the j-th covariate of student i, such that, X i = [X i1 , X i2 , ..., X iJ ] refers to the student’s characteristic vector I and X j refers to the column vector with j-th characteristic (covariate).
Entropy balancing generalizes the propensity score weighting approach by estimating weights directly from a set of balance constraints exploring the researcher’s knowledge of the sample moments. Consider w i the entropy balance weight chosen for each control unit, which was found by the following weighting scheme that minimizes the metric entropy distance (Equation 1):
That minimization is subject to balance (Equation 2), normalization (Equation 3) and non-negativity (Equation 4) restrictions
Where:
H (ω) = |
the grouped function of the metric distance between the treatment and control groups; |
h (.) = |
a metric distance for each observation of these groups. |
These weights w
i
are weightings given to the units of observations found through this method, which makes the treatment and control groups similar in terms of mean, variance, and asymmetry. The weighting scheme consists of three characteristics. First, the h (.) function is a metric distance chosen from the general classes of minimal discrepancy empirical estimators defined by Read and Cressie (1988). The authors chose to use the Kullback method (1959) defined by
Initially, the covariate that will be included in the reweighting is chosen. For each covariate, a set of balancing restrictions (Equation 2) is specified to match the timing of the covariate distribution between the reweighted treatment and control groups. Moment constraints can be the mean (first moment), variance (second moment), and asymmetry (third moment). A typical balancing constraint is formulated in such a way that m
r
contains the moment of a specific covariate X
j
for the treatment group and the moment function for the control group is specified as:
Thus, entropy balancing seeks, for a set of students, w i weights which minimize Equation 1, entropy distance between W, subject to moment restrictions in Equation 2, normalization restriction in Equation 3, which states that the sum of the weights is equal to 1, and the non-negativity constraint Equation 4, which imposes the absence of negative weights.
MATCHING BY PROPENSITY SCORE WITH MULTIPLE TREATMENTS
Students are able to choose to enter via quotas in the selection process for entering HEI, among the options to which they fit. To find the effect of the heterogeneity of the quota type on the test score in ENADE, a new treatment variable was considered, which will assume multiple values.
The PEP methodology with multiple treatments was used, since the treatment variable is defined as categorical. The methodology, approached by Imbens (2000) for the PEP, indicates a situation in which the student (i) has multiple treatments due to the different types of quotas.
Let T i (t) be a treatment function, where t indicates the treatment level for each type of quota,t =1,2,…K ; thus, T i (0) would be the category in which student i did not enter through quotas.
For the identification of multiple treatments, Rosenbaum and Rubin (1983) established that the Weak Conditional Independence Assumption (WCIA) requires the interdependence of each treatment with each of the potential results Y(t), as well as the local independence between each result and the treatment of interest, this being independent of D(t), where D(t) is a binary indicator, while T indicates the level of treatment. When considering a student belonging to the treatment, T i (t), the other categories are disregarded, starting to evaluate T i (t) as a binary variable. Furthermore, in Equation 5, X corresponds to the vector of pretreatment variables. For example, in this study, there are 5 possibilities of quotas, t = 1,2,3,4,5, as described in Chart 1. Supposing a student i entered university by ethnic-racial criterion (t = 1), then, the other categories are disregarded, starting to evaluate T i (t) as a binary variable D(t), in which, in this example, D(t) = 1, if the student entered university through ethnic-racial criterion and D(t) = 0, if he/she did not enter through quotas.
In this way, WCIA is equivalent to:
Chart 1 - Variables in the sample.
| Variable | Description |
|---|---|
| Treatments | |
| Quota holder | 1 if entered through the quota policy; 0 otherwise |
| Quotas | 0 if the student did not enter through quotas ; 1 if entered through ethnic-racial criterion; 2 if entered according to income criterion; 3 if entered through public or private school (with a scholarship) criterion; 4 if entered through the combination of criteria; and 5 if entered through another criterion. |
| Result | |
| General Test Score | Total score in ENADE |
| Covariates | |
| Gender | 1 if male; 0 otherwise |
| Race | 1 if black; 0 otherwise |
| Marital status | 1 if single; 0 otherwise |
| High_School | 1 if all or most of them are from public schools; 0 otherwise |
| Type of high school | |
| Traditional | 1 if traditional; 0 otherwise |
| Vocational education | 1 if vocational education; 0 otherwise |
| Scholarship | 1 if scholarship holder; 0 otherwise |
| Employment | 1 if the student works 40 hours or more a week; 0 otherwise |
| Educ_mother1 | 1 if the mother has no schooling or until the 5th year; 0 otherwise |
| Educ_mother2 | 1 if the mother has a degree; 0 otherwise |
| Educ_father1 | 1 if the father has no education or until the 5th year; 0 otherwise |
| Educ_father2 | 1 if the father has a degree; 0 otherwise |
| Family income | 1 if the family’s monthly income is up to 1.5 minimum wages; 0 otherwise |
| Age | Age in years |
| Age1 | 1 if the student is aged between 16 and 25 |
| Age2 | 1 if the student is aged between 26 and 40 |
| Time | Years difference between the completion of ENADE and the year of entry into the undergraduate program |
| Prestige | 1 if the course that the student is taking is considered prestigious; 0 otherwise |
| Course region | |
| North | 1 if located in the North Region; 0 otherwise |
| Northeast | 1 if located in the Northeast Region; 0 otherwise |
| South | 1 if located in the South Region; 0 otherwise |
| Midwest | 1 if located in the Midwest Region; 0 otherwise |
ENADE: National Assessment of Student Achievement (Exame Nacional de Desempenho de Estudantes).
Source: based on National Institute of Educational Studies and Research Anísio Teixeira (Instituto Nacional de Estudos e Pesquisas Educacionais Anísio Teixeira - INEP) data, 2013-2015.
In which Equation 5 indicates that the treatment is orthogonal, that is, it is not correlated with the result variable, conditioned to the pretreatment variables X. As the objective is the estimation of the average of the potential result, E[Y(t)], it must be ensured that the average of the Y i (t) is represented in the subsample of the observations that receive the treatment D i (t) = 1, even when D i (t) = 0, the variable Y i (t) is always unknown.
Given the conditionality of the explanatory variables (X) and the absence of relevance of other potential results defined by the WCIA, the conditioned average result of the treatment is estimated from conditional averages (Equation 6):
Equation 6 shows that the average of the result variable Y (t) (General score of ENADE) will be calculated based on the averages conditioned to the pre-treatment variables.
Thus, one can define the Generalized Propensity Score (GPS) as the conditional probability of a particular level of treatment, considering the observable variables, which equals the conditional expectation of the binary treatment variable according to Imbens (2000), which can be represented by Equation 7:
Equation 7 shows the probability that the individual will receive treatment, given the pre-treatment variables. For example, given that the student has completed all or most of high school in a public school, what is the likelihood that he/she will be a quota holder in the university?
Considering the WCIA and the GPS, this assumption can be represented by Equation 8:
Equation 8 is a new assumption that the method makes. Initially, it considers that conditionality occurs in the pre-treatment variables (Equation 5). Then, it now considers that this conditionality occurs in the probability of receiving treatment, considering these variables (Equation 8). Given the GPS for multiple treatments, the overlapping assumption is expressed by Equation 9:
Equations 8 and 9 mean that treatment is independent of potential results and independent of pre-treatment variables.
Changes in the level of treatment imply changes in the conditioning argument. Thus, it is necessary to condition the entire set of K +1 scores, {e(t,x)} ∈ T. K represents the total of treatments observed, in this study, k = 5. K +1 means to consider all treatments plus the group that is not treated.
The multiple treatment methodology is similar to the binary case, in which the propensity score is initially estimated, e(t, x) (Equation 7), in a model with multiple treatments, which in this study means several types of quotas. Then, the effect of the treatment level t on the outcome variable (score in ENADE) is estimated. The effect is estimated through the Kernel pairing12 for each treatment level in relation to the others. Regarding the individual analysis of the treatment levels, it has D(t) = 1 for students belonging to treatment t, while it has D(t) = 0 for students belonging to another category.
VARIABLES AND DATABASES
In order to verify the performance of quota students at ENADE between 2013 and 2015, a sample was constructed with data referring to the fourth cycle of the exam. Each cycle of the test corresponds to an evaluation triennium13, so that, at the end of this, most courses are evaluated.
The data used were made available by the National Institute of Educational Studies and Research Anísio Teixeira (Instituto Nacional de Estudos e Pesquisas Educacionais Anísio Teixeira - INEP). In accordance with the Quota Law No. 12.711, state and private HEI were not considered in the sample.
The following explanatory variables were used: gender, race, age, high school (public or private), employment, parental education, and family income (Waltenberg and Carvalho, 2012; Melguizo and Wainer, 2016; Arabage and Souza, 2017; Valente and Berry, 2017). The binary variable indicates two groups: treated (quota students) and control (students with characteristics similar to quota students, but who are not quota students).
The prestige variable was created based on the courses that obtained an ENEM cut-off score above 700 points at the largest Brazilian universities. The time variable represents the difference between the year of ENADE and the year of entry into the undergraduate course, aiming to capture the impact of permanence on the student’s score. Geographic variables were also considered in the model. Chart 1 describes the variables used.
RESULTS
DESCRIPTIVE ANALYSIS
Table 1 presents the descriptive statistics of the result variable, considering the type of quota. It appears that the public school criterion has the highest average in the test score, 50.22, followed by Combination, 49.85, while others have the lowest average, 41.56.
Table 1 - Descriptive statistics of the result variable by types of quotas.
| Quota types | Test scores ENADE | |||||||
|---|---|---|---|---|---|---|---|---|
| 2013-2015 | 2013 | 2014 | 2015 | |||||
| Mean | SD | Mean | SD | Mean | SD | Mean | SD | |
| Ethnic-racial | 46..311 | 15.987 | 47.530 | 17.823 | 44.491 | 15.444 | 49.186 | 15.539 |
| Income | 45.212 | 15.534 | 48.156 | 16.709 | 43.629 | 15.320 | 47.901 | 15.067 |
| Public school | 50.222 | 14.875 | 51.841 | 15.029 | 48.816 | 15.027 | 52.456 | 14.093 |
| Combination | 49.849 | 15.327 | 50.028 | 15.670 | 48.434 | 15.210 | 52.389 | 15.084 |
| Others | 41.564 | 14.883 | 47.312 | 13.974 | 40.630 | 14.691 | 46.702 | 15.372 |
ENADE: National Assessment of Student Achievement (Exame Nacional de Desempenho de Estudantes); SD: standard deviation.
Source: based on National Institute of Educational Studies and Research Anísio Teixeira (Instituto Nacional de Estudos e Pesquisas Educacionais Anísio Teixeira - INEP) data, 2013-2015.
Table 2 shows the descriptive statistics of the outcome and control variable for quota and non-quota students in federal HEI from 2013 to 2015. Non-quota students have a higher average in the exam’s test score throughout this period of time, and the difference of their grades and the grade of quota students is 1.4 points in 2013, 2 points in 2014, and 1.7 points in 2015.
Table 2 - Descriptive statistics of the sample variables by types of quotas and by year.
| Variables | 2013-2015 | 2013 | 2014 | 2015 | ||||||||||||
|---|---|---|---|---|---|---|---|---|---|---|---|---|---|---|---|---|
| Quota holders | Non-quota holders | Quota holders | Non-quota holders | Quota holders | Non-quota holders | Quota holders | Non-quota holders | |||||||||
| Mean | SD | Mean | SD | Mean | SD | Mean | SD | Mean | SD | Mean | SD | Mean | SD | Mean | SD | |
| Test score ENADE | 48.078 | 15.431 | 50.111 | 15.597 | 50.568 | 15.602 | 52.061 | 15.005 | 46.280 | 15.407 | 48.254 | 15.678 | 51.410 | 14.667 | 53.153 | 15.178 |
| Gender | 0.37849 | 0.48502 | 0.45081 | 0.49757 | 0.29506 | 0.45613 | 0.34684 | 0.47597 | 0.38490 | 0.48658 | 0.48001 | 0.49960 | 0.40197 | 0.49032 | 0.45585 | 0.49805 |
| Race | 0.16282 | 0.36921 | 0.07751 | 0.26740 | 0.14763 | 0.35478 | 0.05775 | 0.23329 | 0.16451 | 0.37074 | 0.08848 | 0.28399 | 0.16575 | 0.37188 | 0.06521 | 0.24690 |
| Marital status | 0.75533 | 0.42989 | 0.79813 | 0.40139 | 0.86150 | 0.34546 | 0.89405 | 0.30777 | 0.71461 | 0.45160 | 0.76136 | 0.42625 | 0.80876 | 0.39329 | 0.81756 | 0.38620 |
| High School | 0.94400 | 0.22990 | 0.48087 | 0.499636 | 0.91927 | 0.27244 | 0.36377 | 0.48109 | 0.94823 | 0.22155 | 0.55657 | 0.46679 | 0.94500 | 0.22799 | 0.38181 | 0.48583 |
| Traditional type | 0.76083 | 0.42658 | 0.84560 | 0.36132 | 0.86523 | 0.34152 | 0.91133 | 0.28427 | 0.71546 | 0.45120 | 0.80854 | 0.39345 | 0.82714 | 0.37814 | 0.88793 | 0.31544 |
| Technical type | 0.09572 | 0.29422 | 0.07690 | 0.26644 | 0.08904 | 0.28485 | 0.06190 | 0.24099 | 0.08545 | 0.27955 | 0.08229 | 0.27481 | 0.12520 | 0.33097 | 0.07475 | 0.26299 |
| Scholarship | 0.48327 | 0.49972 | 0.46048 | 0.49843 | 0.64046 | 0.47992 | 0.61473 | 0.48666 | 0.50653 | 0.49996 | 0.48500 | 0.49977 | 0.34875 | 0.47660 | 0.28740 | 0.45255 |
| Employment | 0.24525 | 0.43024 | 0.23174 | 0.42195 | 0.07010 | 0.25535 | 0.05840 | 0.23450 | 0.25561 | 0.43621 | 0.24392 | 0.42944 | 0.30236 | 0.45931 | 0.32898 | 0.46985 |
| Educ_mother1 | 0.36090 | 0.48026 | 0.20639 | 0.40471 | 0.26551 | 0.44166 | 0.12582 | 0.33166 | 0.41417 | 0.49259 | 0.25739 | 0.43720 | 0.27018 | 0.44408 | 0.14091 | 0.34794 |
| Educ_mother2 | 0.10449 | 0.30590 | 0.22715 | 0.41899 | 0.13766 | 0.34459 | 0.26841 | 0.44314 | 0.09000 | 0.28620 | 0.19961 | 0.39971 | 0.12571 | 0.33154 | 0.26414 | 0.44088 |
| Educ_father1 | 0.45761 | 0.49820 | 0.27087 | 0.44441 | 0.37206 | 0.48342 | 0.18865 | 0.39124 | 0.51468 | 0.49979 | 0.32731 | 0.46923 | 0.35230 | 0.47771 | 0.19319 | 0.39481 |
| Educ_father2 | 0.08661 | 0.28127 | 0.20869 | 0.40637 | 0.10980 | 0.31269 | 0.24437 | 0.42972 | 0.07222 | 0.25886 | 0.18185 | 0.38523 | 0.11240 | 0.31588 | 0.24958 | 0.43277 |
| Family income | 0.24364 | 0.42928 | 0.13855 | 0.34548 | 0.24070 | 0.42756 | 0.12143 | 0.32663 | 0.27344 | 0.44573 | 0.16962 | 0.37530 | 0.16879 | 0.37459 | 0.07552 | 0.26376 |
| Age1 | 0.53984 | 0.49841 | 0.59897 | 0.49010 | 0.67391 | 0.46884 | 0.72272 | 0.44766 | 0.47887 | 0.49956 | 0.54303 | 0.49814 | 0.63173 | 0.48236 | 0.64470 | 0.47861 |
| Age2 | 0.37164 | 0.48325 | 0.34260 | 0.47458 | 0.29798 | 0.45743 | 0.26012 | 0.43871 | 0.40461 | 0.49082 | 0.38022 | 0.48544 | 0.32251 | 0.46747 | 0.31130 | 0.46303 |
| Time | 3.9055 | 1.2225 | 4.2997 | 1.5709 | 3.8748 | 1.0572 | 4.1951 | 1.2476 | 3.8838 | 1.2346 | 4.3501 | 1.6511 | 3.9759 | 1.2621 | 4.2536 | 1.5779 |
| Prestige | 0.00062 | 0.02505 | 0.00137 | 0.03703 | 0 | 0 | 0.00189 | 0.04349 | 0.00029 | 0.01723 | 0.006255 | 0.02500 | 0.00177 | 0.04208 | 0.00281 | 0.05300 |
| North | 0.18750 | 0.39032 | 0.13562 | 0.34239 | 0.09384 | 0.29165 | 0.08436 | 0.27794 | 0.24486 | 0.43001 | 0.16130 | 0.36781 | 0.08554 | 0.27970 | 0.11056 | 0.31360 |
| Notheast | 0.28213 | 0.45004 | 0.27837 | 0.44819 | 0.32343 | 0.46784 | 0.28975 | 0.45365 | 0.27250 | 0.44525 | 0.27549 | 0.44676 | 0.28703 | 0.45240 | 0.27704 | 0.44754 |
| South | 0.17164 | 0.37708 | 0.13906 | 0.34601 | 0.23144 | 0.42181 | 0.16332 | 0.36966 | 0.14524 | 0.35235 | 0.12902 | 0.33523 | 0.21061 | 0.40777 | 0.14577 | 0.35288 |
| Midwest | 0.06555 | 0.24751 | 0.09949 | 0.29932 | 0.07502 | 0.26346 | 0.11039 | 0.31338 | 0.06083 | 0.23902 | 0.09166 | 0.28855 | 0.07312 | 0.26035 | 0.11060 | 0.31364 |
SD: standard deviation.
As expected, quota holders have a greater representation of black students (16.2%), graduates from public high schools (94.4%), and families with income up to 1.5 minimum wages (24.3%). Only 7.7% of non-quota students are black, 48% attended high school in public schools and, on average, 13.8% of non-quota students’ families have an income of up to 1.5 minimum wages. It is noted that quota students have a greater female representation, have parents with lower education, and complete their degrees in less time than non-quota ones.
RESULTS OF THE MODELS
Results of the entropy balancing model
The moment conditions for the distribution of the control covariables are shown in Table 3. Significant differences are observed between the group of treatment (quota holders) and the control group (non-quota holders) in the 3 moments of the distribution. The variables that have a more similar distribution between treatment and control are Age1, since the two groups have observations in the age group between 16 and 25 years, the family income up to 1.5 minimum wages and the dummy indicative of a prestigious course. With the exception of these variables, mean, variance, and asymmetry of all the others are statistically different between groups before balancing by entropy.
Table 3 - Moment conditions of covariates before balancing by entropy.
| Covariates | Treatment | Control | Differences | p-value | ||||||
|---|---|---|---|---|---|---|---|---|---|---|
| Mean | Variance | Asymmetry | Mean | Variance | Asymmetry | Mean | Variance | Asymmetry | ||
| Gender | 0.3787 | 0.2353 | 0.5002 | 0.4512 | 0.2476 | 0.1962 | -0.0752 | -0.0123 | 0.304 | 0.000 |
| Race | 0.1627 | 0.1362 | 1.828 | 0.07748 | 0.07148 | 3.161 | 0.08522 | 0.06472 | -1.333 | 0.000 |
| Marital Status | 0.7552 | 0.1849 | -1.187 | 0.7979 | 0.1612 | -1.484 | -0.0427 | 0.0237 | 297 | 0.000 |
| High School | 0.944 | 0.055284 | -3.863 | 0.481 | 0.2496 | 0.07618 | 0.463 | -0.19431 | -3.863 | 0.000 |
| Traditional type | 0.7609 | 0.1819 | -1.223 | 0.8456 | 0.1306 | -1.912 | -0.0847 | 0.0513 | 689 | 0.000 |
| Technical type | 0.09558 | 0.08645 | 2.751 | 0.07689 | 0.07098 | 3.176 | 0.01869 | 0.01547 | 425 | 0.000 |
| Scholarship | 0.4831 | 0.2497 | 0.06775 | 0.4602 | 0.2484 | 0.1597 | 0.0229 | 0.0013 | -0.0919 | 0.000 |
| Employment | 0.2455 | 0.1852 | 1.183 | 0.232 | 0.1782 | 1.27 | 0.0135 | 0.007 | 1.181 | 0.000 |
| Educ_mother1 | 0.361 | 0.2307 | 0.579 | 0.2065 | 0.1639 | 1.45 | 0.1545 | 0.0668 | -0.871 | 0.048 |
| Educ_mother2 | 0.1045 | 0.09357 | 2.586 | 0.2271 | 0.1755 | 1.303 | -0.1226 | -0.08193 | 1.283 | 0.000 |
| Educ_father1 | 0.4577 | 0.2482 | 0.17 | 0.2709 | 0.1975 | 1.031 | 0.1868 | 0.0507 | -1.030 | 0.007 |
| Educ_father2 | 0.08658 | 0.07909 | 2.94 | 0.2087 | 0.1651 | 1.434 | -0.1221 | -0.08601 | -1.431 | 0.000 |
| Family income | 0.2436 | 0.1842 | 1.195 | 0.1385 | 0.1193 | 2.094 | 0.1051 | 0.0649 | -899 | 0.483 |
| Age1 | 0.5396 | 0.2484 | -0.1589 | 0.5987 | 0.2403 | -0.4027 | -0.0591 | 0.0081 | 0.2438 | 0.079 |
| Age2 | 0.372 | 0.2336 | 0.5297 | 0.3428 | 0.2253 | 0.6623 | 0.0292 | 0.0083 | -0.1326 | 0.000 |
| Time | 3.906 | 1.495 | 0.8005 | 4.3 | 2.469 | 1.482 | -0.394 | -0.974 | -1.481 | 0.000 |
| Prestige | 0.0006292 | 0.0006289 | 39.83 | 0.001377 | 0.001375 | 26.89 | 0.00075 | -0.00075 | 12.94 | 0.285 |
| North | 0.1876 | 0.1524 | 1.601 | 0.1357 | 0.1173 | 2.128 | 0.0519 | 0.0351 | -527 | 0.000 |
| Northeast | 0.2821 | 0.2025 | 0.9686 | 0.2785 | 0.2009 | 0.9884 | 0.0036 | 0.0016 | 0.7677 | 0.000 |
| South | 0.1714 | 0.1421 | 1.744 | 0.139 | 0.1197 | 2.804 | 0.0324 | 0.0224 | -1.060 | 0.000 |
| Midwest | 0.06554 | 0.06124 | 3.511 | 0.0995 | 0.0896 | 2.676 | -0.0339 | -0.02836 | 835 | 0.000 |
Following Hainmueller (2012), it is possible to combine Entropy Balancing with PEP, so that the estimation of propensity scores starts to consider the balancing weights. Thus, Graphics 1 and 2 show the difference in the linear distribution of these scores before and after using this algorithm. Observing the adjusted overlap of the two groups, it is proved that the scores were shown to be balanced. In Table 4, after the entropy balance, the differences between the variables associated with the performance in ENADE in the two groups become insignificant, showing themselves to be properly balanced (Graphics 1 and 2).
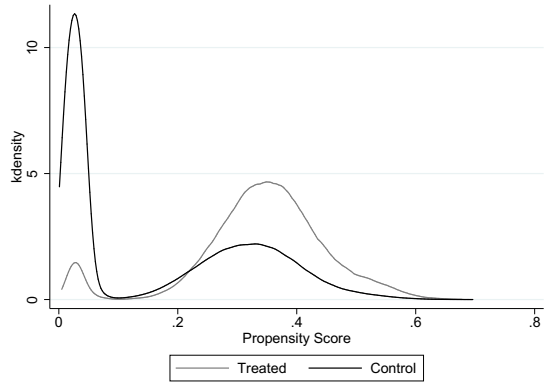
Source: authors based on ENADE 2013-2015.
Graphic 1 - Propensity Score Matching before entropy balancing.
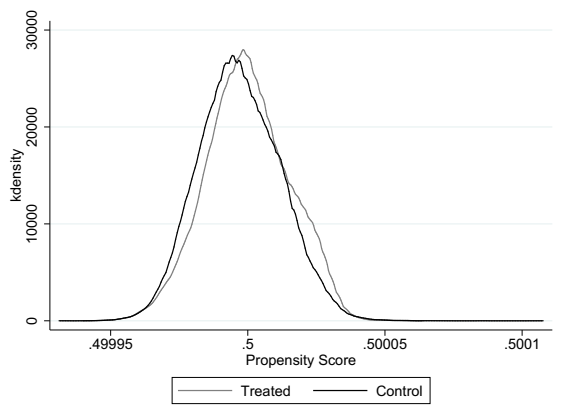
Table 4 - Momentary conditions of covariates after balancing by entropy.
| Covariates | Treatment | Control | Differences | p-value | ||||||
|---|---|---|---|---|---|---|---|---|---|---|
| Mean | Variance | Asymmetry | Mean | Variance | Asymmetry | Mean | Variance | Asymmetry | ||
| Gender | 0.3787 | 0.2353 | 0.5002 | 0.3787 | 0.2353 | 0.5002 | 0 | 0 | 0 | 0.982 |
| Race | 0.1627 | 0.1362 | 1.828 | 0.1627 | 0.1362 | 1.828 | 0 | 0 | 0 | 0.853 |
| Marital status | 0.7552 | 0.1849 | -1.187 | 0.7552 | 0.1849 | -1.187 | 0 | 0 | 0 | 0.804 |
| High school | 0.944 | 0.05284 | -3.863 | 0.944 | 0.05284 | -3.863 | 0 | 0 | 0 | 0.722 |
| Traditional type | 0.7609 | 0.1819 | -1.223 | 0.7609 | 0.1819 | -1.223 | 0 | 0 | 0 | 0.771 |
| Technical type | 0.09558 | 0.08645 | 2.751 | 0.09558 | 0.08645 | 2.751 | 0 | 0 | 0 | 0.813 |
| Scholarship | 0.4831 | 0.2497 | 0.06775 | 0.4831 | 0.2497 | 0.06775 | 0 | 0 | 0 | 0.971 |
| Employment | 0.2455 | 0.1852 | 1.183 | 0.2455 | 0.1852 | 1.183 | 0 | 0 | 0 | 0.960 |
| Educ_mother1 | 0.361 | 0.2307 | 0.579 | 0.361 | 0.2307 | .579 | 0 | 0 | 0 | 0.907 |
| Educ_mother2 | 0.1045 | 0.09357 | 2.586 | 0.1045 | 0.09357 | 2.586 | 0 | 0 | 0 | 0.654 |
| Educ_father1 | 0.4577 | 0.2482 | 0.17 | 0.4577 | 0.2482 | .17 | 0 | 0 | 0 | 0.810 |
| Educ_father2 | 0.08658 | 0.07909 | 2.94 | 0.08659 | 0.07909 | 2.94 | -0.00001 | 0 | 0 | 0.694 |
| Family Income | 0.2436 | 0.1842 | 1.195 | 0.2436 | 0.1842 | 1.195 | 0 | 0 | 0 | 0.831 |
| Age1 | 0.5396 | 0.2484 | -0.1589 | 0.5396 | 0.2484 | -0.1589 | 0 | 0 | 0 | 0.989 |
| Age2 | 0.372 | 0.2336 | 0.5297 | 0.372 | 0.2336 | 0.5297 | 0 | 0 | 0 | 0.871 |
| Time | 3.906 | 1.495 | 0.8005 | 3.906 | 1.495 | 0.8005 | 0 | 0 | 0 | 0.979 |
| Prestige | 0.0006292 | 0.0006289 | 39.83 | 0.0006293 | 0.0006289 | 39.83 | 0.0000001 | 0 | 0 | 0.762 |
| North | 0.1876 | 0.1524 | 1.601 | 0.1876 | 0.1524 | 1.601 | 0 | 0 | 0 | 0.952 |
| Northeast | 0.2821 | 0.2025 | 0.9686 | 0.2821 | 0.2025 | 0.9686 | 0 | 0 | 0 | 0.988 |
| South | 0.1714 | 0.1421 | 1.744 | 0.1714 | 0.1421 | 1.744 | 0 | 0 | 0 | 0.938 |
| Midwest | 0.06554 | 0.06124 | 3.511 | 0.06554 | 0.06124 | 3.511 | 0 | 0 | 0 | 0.667 |
The ATE was estimated considering the propensity scores calculated with the weighting by entropy for the result variable (Table 5). It is observed that the effect of quotas on the general test score was negative and significant, with a difference of approximately 4%. Effectively, quota students, taking into account the average of courses at ENADE, obtain a score below that obtained by non-quota students in approximately 2 points.
Table 5 - Impact of quotas on the ENADE score.
| Result Variable | Quota holders | Non-quota holders | ATE | (%) | SD | t-test |
|---|---|---|---|---|---|---|
| Test score ENADE | 48.079 | 50.117 | -2.038 | -4.06 | 0.10 | -20.37 |
ATE: average treatment effect on the treated; SD: Standard deviation; ENADE: National Assessment of Student Achievement (Exame Nacional de Desempenho de Estudantes).
This average difference in performance between the two groups represents 0.13 standard deviation, which means that a quota student is, on average, at the 44th percentile while the non-quota student is, on average, at the 49th percentile of the score distribution. However, it is necessary to take into account that this differential is impacted differently depending on the type of quota. These heterogeneities show that affirmative actions need to be analyzed by different aspects.
Results of model with multiple treatments
Through the PEP, an attempt is made to mitigate the selection bias caused by the variables observed through the pairing of the groups through the scores estimated in the model, in such a way that it simulates a random experiment. The propensity score was estimated as the probability that the student belongs to one of the categories of the variable quotas. The category of non-quota students was considered as the basis for estimating this model. The results of the multinomial logit model are shown in Table 6. The sign of the coefficients indicates that there are covariates associated, both positively and negatively, with the probability of the discrete variable (dimension types) assuming the defined values (D = 1).
Table 6 - Result of the multinomial logit model.
| Variables | Treatments | |||||||||
|---|---|---|---|---|---|---|---|---|---|---|
| Ethnic-racial | Income | Public school | Combination | Others | ||||||
| Coefficient | p-value | Coefficient | p-value | Coefficient | p-value | Coefficient | p-value | Coefficient | p-value | |
| Gender | 0.0822127 | 0.080 | -0.0391799 | 0.418 | -0.1892341 | 0.000 | -0.1541321 | 0.000 | -0.2690981 | 0.000 |
| Race | 2.42146 | 0.000 | 0.0338291 | 0.649 | -0.2010925 | 0.000 | 1.163633 | 0.000 | 0.3061779 | 0.000 |
| Marital status | 0.2761764 | 0.000 | 0.2583822 | 0.000 | 0.2453653 | 0.000 | 0.2101809 | 0.000 | -0.1574784 | 0.000 |
| High school | 1.735686 | 0.000 | 2.517273 | 0.000 | 4.288343 | 0.000 | 3.331698 | 0.000 | 0.6021486 | 0.000 |
| Traditional type | 0.3985074 | 0.000 | -0.0827084 | 0.284 | 0.3427349 | 0.000 | 0.142501 | 0.025 | -1.13519 | 0.000 |
| Technical type | 0.2281606 | 0.015 | -0.3149657 | 0.004 | 0.2892724 | 0.000 | -0.0648523 | 0.443 | -1.110021 | 0.000 |
| Scholarship | 0.018347 | 0.639 | 0.1825231 | 0.000 | 0.1907278 | 0.000 | 0.1859019 | 0.000 | -0.1652407 | 0.000 |
| Employment | -0.3368237 | 0.000 | -0.2168624 | 0.001 | -0.2528883 | 0.000 | -0.2364539 | 0.000 | 0.3402165 | 0.000 |
| Educ_mother1 | 0.0187951 | 0.690 | 0.1024509 | 0.077 | -0.0249382 | 0.263 | 0.0533111 | 0.237 | 0.19389 | 0.000 |
| Educ_mother2 | -0.2304234 | 0.000 | -0.433509 | 0.000 | -0.1659937 | 0.000 | -0.3681685 | 0.000 | -0.0539236 | 0.367 |
| Educ_father1 | 0.0135826 | 0.763 | -0.2572064 | 0.004 | -0.0358129 | 0.091 | 0.0484722 | 0.625 | 0.360556 | 0.000 |
| Educ_father2 | -0.0933321 | 0.139 | -0.2572064 | 0.006 | -0.1274693 | 0.000 | -0.2766585 | 0.000 | -0.1238162 | 0.069 |
| Family Income | 0.1562583 | 0.000 | 0.595882 | 0.000 | -0.0759462 | 0.001 | 0.0328715 | 0.460 | 0.0762599 | 0.052 |
| Age1 | 0.0689564 | 0.468 | 0.3335827 | 0.003 | 0.5391591 | 0.000 | 0.2952196 | 0.001 | -1.113874 | 0.000 |
| Age2 | 0.1750883 | 0.046 | 0.0568177 | 0.588 | 0.1743214 | 0.000 | 0.0099819 | 0.901 | -0.3514717 | 0.000 |
| Time | -0.0451715 | 0.000 | -0.1473223 | 0.000 | -0.0964815 | 0.000 | -0.1537905 | 0.000 | -0.2394884 | 0.000 |
| Prestige | -0.1345502 | 0.751 | -12.39588 | 0.000 | -0.5024968 | 0.198 | 0.8982139 | 0.058 | -0.8170621 | 0.274 |
| North | -0.1706847 | 0.013 | -0.3060784 | 0.000 | -0.4895727 | 0.000 | -0.376322 | 0.000 | 0.9092588 | 0.000 |
| Northeast | 0.6446868 | 0.000 | -0.1331396 | 0.030 | 0.0152833 | 0.511 | -0.2085642 | 0.000 | 0.3523564 | 0.000 |
| South | 0.8628803 | 0.000 | 0.0765335 | 0.282 | 0.3142073 | 0.000 | -0.6270097 | 0.000 | 0.0235961 | 0.699 |
| Midwest | 0.8434541 | 0.000 | -0.6612338 | 0.000 | -0.6670581 | 0.000 | -0.9724663 | 0.000 | -0.1493261 | 0.045 |
| Constant | -6.312464 | 0.000 | -5.820389 | 0.000 | -5.739137 | 0.000 | -5.925265 | 0.000 | -1.637878 | 0.000 |
It is observed that boys are associated with a greater probability of being quota holders through the ethnic-racial criterion. For black, single students who went to school at public high schools of the traditional type, the effect was positive and significant14. A high level of education by the mother and the fact that the student works are associated with a reduction in the probability of entering this quota. As for the age of the student, this indicates that the higher the age, the greater the probability of having entered by this criterion.
The variables indicating marital status, public high school, family income and first age range increase the probability that the student has entered through the income criterion. The students least likely to have entered university through this type of quota are those who studied in technical high schools, in all regions, with the exception of the South, those who work and those who entered a prestigious course. On the other hand, quota holder students with a family income of up to 1.5 minimum wages and aged between 16 and 25 years tend to increase the probability.
In relation to the quota per public school, it is verified that students from public or technical schools, who have scholarships and who are in the South region are more likely to having entered by this criterion. A negative effect, that is, in which the probability of entering through this quota is reduced, is observed for boys, students who work, those with low family income, and those whose parents have higher schooling.
In the combination criterion, the variables that indicate race, public high school and receiving a scholarship, for example, are associated with an increased probability that the student will have admission through this criterion.
Variables such as sex, marital status, traditional and technical high school, scholarship, age, time and the Midwest region, for example, reduce the probability of having entered university through criteria other than the four mentioned above. However, the effect is positive for race, high school, low parental education, and the Northeast region.
In this work, the Kernel matching algorithm, also applied by Heckman, LaLonde and Smith (1999), was used in the propensity score. This method pairs all the individuals in the sample, assigning lower weights to the observations of the control group that are less similar in the list of observed variables, seeking to make the two groups analogous. It is possible to verify the pairing through the analysis of the balance of the variables used in the estimation through histograms for the groups of treatment and control. The histograms for each type of quota, that is, ethnic-racial, income, public school, combination and others, were generated in Stata Statistical Software and are found in Graphics 3, 4, 5, 6 and 7, in which the distributions have similar propensity scores, indicating that such propensity scores can be paired.
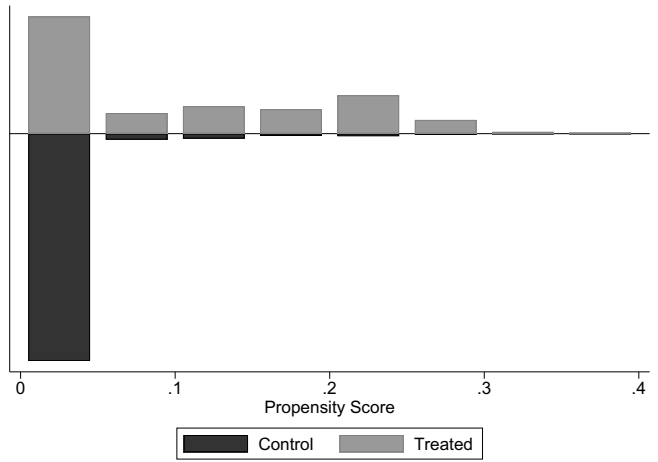
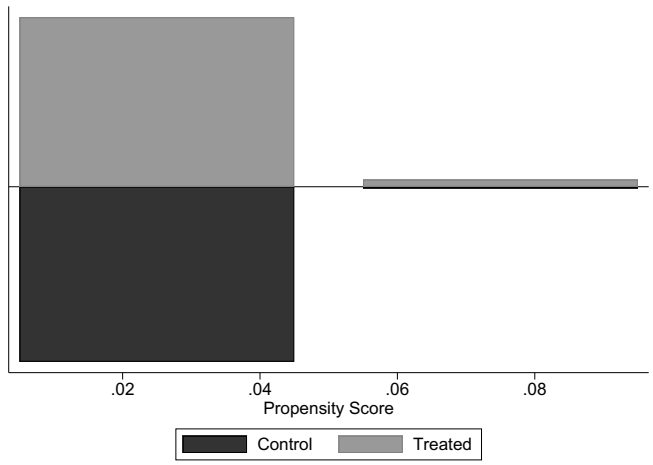
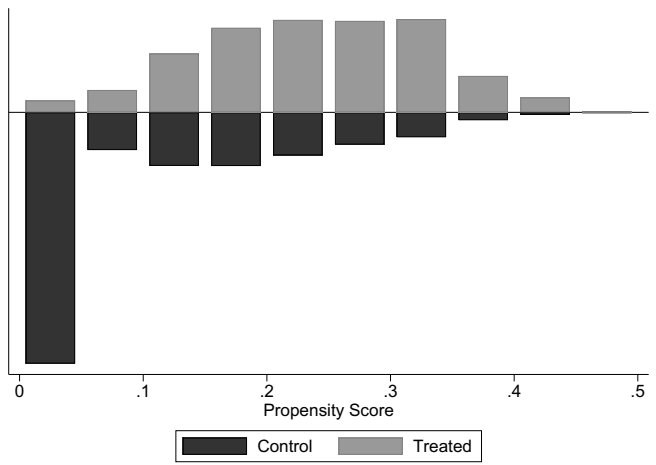
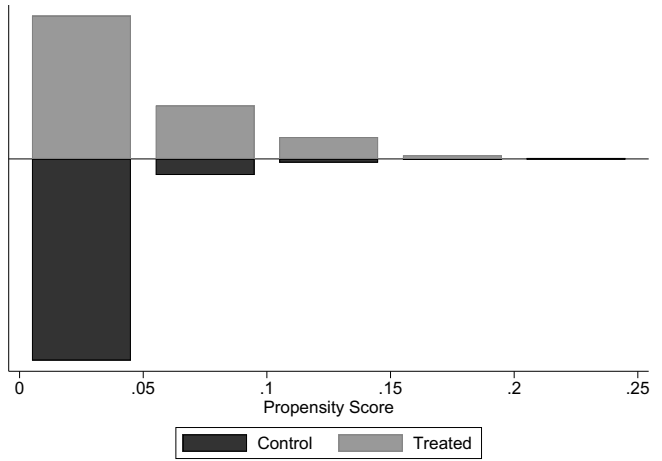
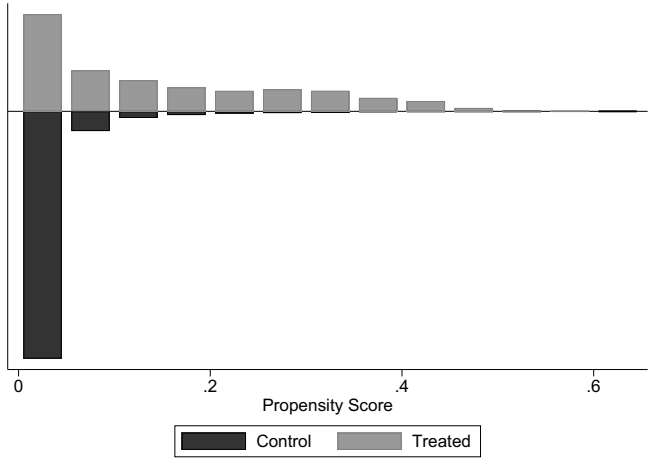
Table 7 shows the results of the ATE, i.e. the difference between average by groups. The estimated ATE suggested for the outcome variable among the types of quotas was performed after estimating the propensity score and removing a portion of the bias attributed by the observed variables.
Table 7 - Impact of multiple treatments on the result variable.
| Quotas | Test score ENADE | |
|---|---|---|
| Ethnic-racial | Treatment | 46.318 |
| Control | 47.759 | |
| ATE | -1.441 | |
| (-3.02%) | ||
| t-test | -4.81 | |
| Income | Treatment | 45.203 |
| Control | 49.574 | |
| ATE | -4.371 | |
| (-8.82%) | ||
| t-test | -11.97 | |
| Public school | Treatment | 50.230 |
| Control | 48.680 | |
| ATE | 1.550 | |
| (3.18%) | ||
| t-test | 11.70 | |
| Combination | Treatment | 49.825 |
| Control | 48.844 | |
| ATE | 0.98 | |
| (2%) | ||
| t-test | 3.55 | |
| Others | Treatment | 41.565 |
| Control | 44.601 | |
| ATE | -3.03 | |
| (-6.8%) | ||
| t-test | -12.92 | |
ENADE: National Assessment of Student Achievement (Exame Nacional de Desempenho de Estudantes); ATE: average treatment effect on the treated.
It appears that the types of ethnic-racial quotas, income and others showed negative and significant effects on the general test score, whose difference between quota and non-quota students is between 1.4 and 4.3 points to the disadvantage of quota students. That is, for these types of quota, non-quota students obtains higher and statistically significant test scores in ENADE in relation to quota students.
On the other hand, students who entered through public school quotas or a combination of quotas obtained a higher performance differential than non-quota students, with a statistically significant difference of approximately 1.5 and 1 point, respectively.
The results presented in Table 7 indicate that, considering individuals with similar characteristics in both groups, students attending federal HEI by racial and income quotas obtain performance below their non-quota peers at the end of the undergraduate course, with a greatest differential impact for the latter type of quota. The matter of income permeates all higher education, since poorer students probably need to work, in addition to studying, thus reducing the time dedicated only to study. In addition, it is possible to observe that quota students coming from the criterion of public schools manage to surpass the performance of their non-quota peers. This result may suggest that there are public schools of higher quality in high school and that they manage to place their best students in a university, although this result cannot be proven with the analysis performed, being, therefore, only a hypothesis.
FINAL CONSIDERATIONS
This paper aimed to contribute to literature discussion about the relationship between quotas and performance. For this, it was investigated if there is a performance differential between quota and non-quota students in the ENADE score, as well as if there is a performance differential between the types of quotas, thus seeking to bring new evidence about this theme.
It was observed that non-quota students, on average, had a higher test score in the exam in all the years analyzed, however, the difference of these to the score of quota students is approximately 1.4 points in 2013, 2 points in 2014, and 1.7 points in 2015. However, these results are heterogeneous according to the type of quota. Quota students from public school backgrounds and others presented, respectively, higher and lower performance, with a difference of 8.6 points between the two types.
The results of combining PEP with entropy indicate that the ATE was significant, but negative, on the test score. In the multiple treatment model, it appears that the types of ethnic-racial quotas, income and others showed negative and significant effects on the test score, whose effects were approximately 3, 8.8, and 6.8% at less, if compared with the other categories, respectively. However, public school quotas and the combination of quotas had positive and significant effects on the score, whose difference in performance was approximately 3.2 and 2%, respectively.
It is concluded that the findings suggest that students who entered federal universities through quotas present, on average, inferior performance to non-quota students, but, depending on the type of quota and given the heterogeneity of the results, quota students may even present a higher performance.
Looking beyond the analysis of performance in higher education, it is possible to point to another result of affirmative actions that can be explored in future research: the increase in intergenerational educational growth. Both the father and the mother of quota students have a proportion of low schooling that is statistically higher than the parents of non-quota students. Therefore, affirmative action can provide a reduction in educational inequalities over the generations, which can be translated into less intergenerational inequality in income from work.
REFERENCES
ARABAGE, A. C.; SOUZA, A. P. Quotas in Public Universities and Labor Outcomes: Evidence for Rio de Janeiro. 2017. Disponível em: Disponível em: https://www.anpec.org.br/encontro/2017/submissao/files_I/i12-b5f4ed270a38c87ebfd4108955315997.pdf . Acesso em: 13 nov. 2017. [ Links ]
BATISTA, N. C. Políticas públicas de ações afirmativas para a educação superior: o Conselho Universitário como arena de disputas. Ensaio: Avaliação e Políticas Públicas em Educação, v. 23, n. 86, p. 95-128, 2015. https://doi.org/10.1590/S0104-40362015000100004 [ Links ]
BITTAR, M.; ALMEIDA, C. E. M. Mitos e controvérsias sobre a política de cotas para negros na educação superior. Educar em Revista, n. 28, p. 141-159, 2006. https://doi.org/10.1590/S0104-40602006000200010 [ Links ]
BRASIL. Lei nº 12.711, de 29 de agosto de 2012. Dispõe sobre o ingresso nas universidades federais e nas instituições federais de ensino técnico de nível médio e dá outras providências. Brasília. Presidência da República, 2012. Disponível em: Disponível em: http://www.planalto.gov.br/ccivil_03/_ato2011-2014/2012/lei/l12711.htm/ . Acesso em: 2 mar. 2018. [ Links ]
CARDOSO, C. B. Efeitos da política de cotas na Universidade de Brasília: uma análise do rendimento e da evasão. 2008. Dissertação (Mestrado em Educação) - Universidade de Brasília, Brasília, 2008. [ Links ]
CHILDS, P.; STROMQUIST, N. P. Academic and diversity consequences of affirmative action in Brazil. Compare: A Journal of Comparative and International Education, v. 45, n. 5, p. 792-813, 2015. https://doi.org/10.1080/03057925.2014.907030 [ Links ]
CORTES, K. E. Do bans on affirmative action hurt minority students? Evidence from the Texas Top 10% Plan. Economics of Education Review, v. 29, n. 6, p. 1110-1124, 2010. https://doi.org/10.1016/j.econedurev.2010.06.004 [ Links ]
DAFLON, V. T.; FERES JUNIOR, J.; CAMPOS, L. A. Ações afirmativas raciais no ensino superior público brasileiro: um panorama analítico. Cadernos de Pesquisa, v. 43, n. 148, p. 302-327, 2013. https://doi.org/10.1590/S0100-15742013000100015 [ Links ]
DICKSON, L. M. Does ending affirmative action in college admissions lower the percent of minority students applying to college? Economics of Education Review, v. 25, n. 1, p. 109-119, 2006. https://doi.org/10.1016/j.econedurev.2004.11.005 [ Links ]
GUIMARÃES, A. S. A. et al. Social inclusion in Brazilian universities: The case of UFBA. São Paulo: Centro de Estudos da Metrópole, 2010. (Texto para Discussão, 8). [ Links ]
GUTTERRES, R. S. Alunos que ingressaram no ensino superior por ações afirmativas apresentam melhor desempenho? Uma análise empregando a decomposição de Oaxaca para o ENADE 2012. 2015. Dissertação (Mestrado em Economia do Desenvolvimento) - Pontifícia Universidade Católica do Rio Grande do Sul, Porto Alegre, 2015. [ Links ]
HAINMUELLER, J. Entropy balancing for causal effects: a multivariate reweighting method to produce balanced samples in observational studies. Political Analysis, v. 20, p. 25-46, 2012. http://doi.org/10.1093/pan/mpr025 [ Links ]
HAINMUELLER, J.; XU, Y. Ebalance: A Stata Package for entropy balancing. Journal of Statistical Software, v. 54, n. 7, p. 1-18, ago. 2013. http://doi.org/10.18637/jss.v054.i07 [ Links ]
HECKMAN, J. J.; LALONDE, R. J.; SMITH, J. A. The economics and econometrics of active labor market programs. In: ASHENFELTER, O.; CARD, D. (orgs.). Handbook of labor economics. Amsterdã: Elsevier, 1999. v. 3A. p. 1865-2097. [ Links ]
HINRICHS, P. The effects of affirmative action bans on college enrollment, educational attainment, and the demographic composition of universities. Review of Economics and Statistics, v. 94, n. 3, p. 712-722, 2012. [ Links ]
HOROWITZ, D. Ethnic groups in conflict. Berkeley: University of California Press, 1985. [ Links ]
IMBENS, G. The role of the propensity score in estimating dose-response functions. Biometrika, v. 87, n. 3, p. 706-710, 2000. [ Links ]
KULLBACK, S. Information Theory. Nova York: Wiley, 1959. [ Links ]
MAYORGA, C.; SOUZA, L. M. Ação afirmativa na universidade: a permanência em foco. Psicologia Política, v. 12, n. 24, p. 263-281, 2012. [ Links ]
MELGUIZO, T.; WAINER, J. Toward a set of measures of student learning outcomes in higher education: evidence from Brazil. Higher Education, v. 72, n. 3, p. 381-401, 2016. https://doi.org/10.1007/s10734-015-9963-x [ Links ]
MENDES JUNIOR, A.A.F. Uma análise de progressão dos alunos cotistas sob a primeira ação afirmativa brasileira no ensino superior: o caso da universidade do Estado do Rio de Janeiro. Ensaio: Avaliação e Políticas Públicas em Educação, v. 22, n. 82, p. 31-56, 2014. https://doi.org/10.1590/S0104-40362014000100003 [ Links ]
MOEHLECKE, S. Ação afirmativa: história e debates no Brasil. Cadernos de Pesquisa, n. 117, p. 197-217, 2002. https://doi.org/10.1590/S0100-15742002000300011 [ Links ]
MOEHLECKE, S. Ação afirmativa no ensino superior: entre a excelência e a justiça racial. Educação & Sociedade, v. 25, n. 88, p. 757-776, 2004. https://doi.org/10.1590/S0101-73302004000300006 [ Links ]
NEVES, P. S. C.; FARO, A.; SCHMITZ, H. As ações afirmativas na Universidade Federal de Sergipe e o reconhecimento social: a face oculta das avaliações. Ensaio: Avaliação e Políticas Públicas em Educação, v. 24, n. 90, p. 127-160, 2016. https://doi.org/10.1590/S0104-40362016000100006 [ Links ]
OLIVEN, A. C. Ações afirmativas, relações raciais e política de cotas nas universidades: Uma comparação entre os Estados Unidos e o Brasil. Educação, v. 30, n. 1, p. 29-51, 2007. [ Links ]
PEIXOTO, A. L. A. et al. Cotas e desempenho acadêmico na UFBA: um estudo a partir dos coeficientes de rendimento. Avaliação: Revista da Avaliação da Educação Superior, v. 21, n. 2, p. 569-592, 2016. https://doi.org/10.1590/S1414-40772016000200013 [ Links ]
QUEIROZ, D. M.; SANTOS, J. T. Sistema de cotas e desempenho de estudantes nos cursos da UFBA. In: BRANDÃO, A. A. (org.). Cotas raciais no Brasil: a primeira avaliação. Rio de Janeiro: DP&A, 2007. p. 115-135. [ Links ]
READ, T. R. C.; CRESSIE, N. A. C. Goodness-of-fit statistics for discrete multivariate data. Nova York: Springer, 1988. [ Links ]
RISTOFF, D. O novo perfil do campus brasileiro: uma análise do perfil socioeconômico do estudante de graduação. Avaliação, Campinas, v. 19, n. 3, p. 723-747, 2014. https://doi.org/10.1590/S1414-40772014000300010 [ Links ]
ROSENBAUM, P.; RUBIN, D. Assessing sensitivity to an unobserved binary covariate in an observational study with binary outcome. Journal of the Royal Statistical Society, Series B, v. 45, n. 2, p. 212-218, 1983. https://doi.org/10.1111/j.2517-6161.1983.tb01242.x [ Links ]
SANTOS, J. T. O impacto das cotas nas universidades brasileiras (2004-2012): Introdução. In: SANTOS, J. T. (org.). O impacto das cotas nas universidades brasileiras (2004-2012). Salvador: CEAO, 2013. p. 9-13. [ Links ]
SILVA, T. D. M. G. O impacto das ações afirmativas no ensino superior e o desempenho dos alunos. 2014. Dissertação (Mestrado em Economia) - Fundação Getúlio Vargas, Rio de Janeiro, 2014. [ Links ]
SOWELL, T. Ação afirmativa ao redor do mundo: um estudo empírico sobre cotas e grupos preferenciais. São Paulo: É Realizações, 2017. [ Links ]
VALENTE, R. R.; BERRY, B. J. L. Performance of students admitted through affirmative action in Brazil. Latin American Research Review, v. 52, n. 1, p. 18-34, 2017. http://doi.org/10.25222/larr.50 [ Links ]
VELLOSO, J. Vestibular com cotas para negros na UnB: candidatos e aprovados nos exames (Preliminar). Brasília: Núcleo de Estudos para o Ensino Superior & Faculdade de Educação, Universidade de Brasília, 2005. [ Links ]
WALTENBERG, F.; CARVALHO, M. Cotas aumentam a diversidade dos estudantes sem comprometer o desempenho? Sinais Sociais, v. 7, n. 20, p. 36-77, 2012. [ Links ]
WATSON, S. K.; ELLIOT, M. Entropy balancing: a maximum-entropy reweighting scheme to adjust for coverage error. Quality & Quantity, v. 50, n. 4, p. 1781-1797, 2016. https://doi.org/10.1007/s11135-015-0235-8 [ Links ]
1 According to Moehlecke (2002), these are actions that seek equal opportunity for all and that take different forms such as: voluntary actions; laws and guidelines from legal decisions. The quota system, for example, determines a percentage to be occupied in a specific area by defined group(s).
2 Law nº 12,711, of August 29, 2012, establishes that federal public universities must reserve 50% of the places for students who attended high school in public schools, with “sub-quotas” for students with a per capita income up to 1.5 minimum wage and the other half for black, brown and indigenous students whose proportion between ethnic groups is based on the last Census of the Brazilian Institute of Geography and Statistics (IBGE).
4 Expression used by the author to highlight that white men have historically benefited, to the detriment of blacks, and that there are social advantages of that group, considering that they did not compete with women and minorities.
5 It can be simplified as a Top 10% Plan, in which, in Texas schools, the top 10% senior students in high school who apply for a place at Texas universities will be automatically accepted.
6 Before racial quotas, Malaysians managed to occupy only 20% of the vacancies. The managers established preferences for the bumiputeras (the “sons of the land”), starting with the change in the language in which the subjects were taught (from English to Malay), and ensuring that the jobs reflected the proportions of each race in the population of the country, which meant reserving 50% of job vacancies for Malaysians in the various sectors of the economy.
7 The Coefficient of Performance is calculated for all students of the course from the scores obtained and the workload of the subjects taken.
8 Authors such as Queiroz and Santos (2007), Waltenberg and Carvalho (2012) and Peixoto et al. (2016) classify the courses as low, medium and high prestige, in which the term “prestige” is linked to the competition of the course. Therefore, highly prestigious courses are in high demand (very competitive). Likewise, low prestigious courses have low demand.
9 Based on the test score of students who took the entrance exam, a standardized score is created that is used to classify students according to the number of places available, which is calculated only for students who achieve, at least, the test score of 66 points.
10 Entropy is a measure of the distinction between two groups of individuals or objects. The greater the entropy between two groups, the less distinct the characteristics pertaining to those groups will be. The idea of using such a measure here is to choose two groups of individuals, whose difference between them is only whether they are quota holders or not, but which have the greatest possible entropy. That is, they are as similar as possible in terms of the variables that are observable. For more details, see Hainmueller (2012).
11 The use of the term “weight” refers to a measure, obtained by obtained by measuring entropy, which attributes to each individual how similar he is to another group. This similarity is measured based on the observed variables. Thus, individuals in the control group who have characteristics very similar to the treatment group will have a greater weight.
12 This method generates a weighting set for each unit in the control group, in order to make the treatment and control group similar.
13 As an obligatory curricular component, ENADE has been held annually since 2004 and every three years for each area of knowledge. Thus, in year I: courses in the areas of health, agrarian sciences and related areas and higher technology courses; year II: undergraduate courses in the areas of exact sciences, degrees and related areas and, higher technology courses and, finally, year III: undergraduate courses in the fields of applied social sciences, human sciences and related areas in addition to higher education courses in technology. The purpose of the exam is to assess the performance of students from the most diverse areas of knowledge. The score varies from 0 to 100, and the exam contains 40 questions ranging from multiple choice to discursive, with 25% of general training and 75% of specific training of the respective course.
Received: January 20, 2020; Accepted: June 12, 2020
 Este é um artigo publicado em acesso aberto sob uma licença Creative Commons
