


Serviços Personalizados
Journal

Artigo
 texto em
  Inglês (pdf)
 Artigo em XML
 Enviar este artigo por email
Compartilhar

 Permalink
Educação e Pesquisa
versão impressa ISSN 1517-9702versão On-line ISSN 1678-4634
Educ. Pesqui. vol.47 São Paulo 2021 Epub 19-Nov-2021
https://doi.org/10.1590/s1678-4634202147232273
ARTICLES
Social indicators on people with intellectual disabilities: intersectional essay with a view to education policies *

1 - Universidade de São Paulo, São Paulo, SP, Brazil . Contacts: ingrid.anelise@ifsp.edu.br; rosangel@usp.br
2 - Centro Universitário Senac, São Paulo, SP, Brazil . Contact: rkugon@yahoo.com.br
With the aim of analyzing intersections between social indicators related to people classified in the intellectual disability (ID) category in Brazil and their implications for educational policies, in this article we present the characterization of this population based on the extraction of data from the 2010 Demographic Census, applying the recommendations of the Washington Group for defining the number of people with disabilities in the country. From the analysis of an intersectional perspective, it is concluded that, compared to the other categories of disability, ID is the one that suffers the most disadvantages in the indicators of access to work (occupation), monthly nominal income and literacy. In addition, the results regarding the gender category show this as an axis of subordination, since the female has less access to social rights addressed in this study. Regarding the racial identification of people with ID in the country, this seems to influence the classification of individuals in this category of disability, since it is mostly composed of black men. However, the data did not allow us to articulate the race axis with the others, indicating the emerging need to produce and disseminate information that allows analysis and understanding of how different subordination axes affect the lives of people with ID in Brazil and what they indicate for implementation of educational policies, as a vector in the confrontation of inequalities that uniquely mark the situation of people with ID when compared to the general population and also to other categories of disability.
Key words: Intellectual disability; Social indicators; Intersectionality
Com o objetivo de analisar intersecções entre indicadores sociais relacionados às pessoas classificadas na categoria deficiência intelectual (DI) no Brasil e suas implicações para as políticas educacionais, neste artigo apresentamos a caracterização dessa população a partir da extração de dados do Censo Demográfico de 2010, aplicando as recomendações do Grupo de Washington para a definição do quantitativo de pessoas com deficiência no país. Da análise de perspectiva interseccional, conclui-se que, em comparação com as demais categorias de deficiência, DI é a que mais sofre desvantagens nos indicadores de acesso ao trabalho (ocupação), rendimento nominal mensal e alfabetização. Além disso, os resultados quanto à categoria sexo mostram este como um eixo de subordinação, uma vez que o feminino apresenta menos acesso aos direitos sociais abordados neste estudo. Em relação à identificação racial das pessoas com DI no país, esta parece influenciar a classificação de sujeitos nessa categoria de deficiência, uma vez que é composta majoritariamente por homens negros. Contudo os dados não nos permitiram articular o eixo raça com os demais, indicando a emergente necessidade de produzir e divulgar informações que permitam análise e apreensão de como diferentes eixos de subordinação afetam a vida das pessoas com DI no Brasil e o que indicam para a implementação das políticas educacionais, como um vetor no enfrentamento de desigualdades que marcam singularmente a situação das pessoas com DI quando comparadas à população geral e, também, a outras categorias de deficiência.
Palavras-Chave: Deficiência intelectual; Indicadores sociais; Interseccionalidade
Introduction
In this article, we aim to analyze intersections between social indicators related to people classified in the category of intellectual disability (ID) in Brazil and their implications regarding educational policies. We consider the most recent data from the Demographic Census of the Brazilian Institute of Geography and Statistics 3 (Instituto Brasileiro de Geografia e estatística - IBGE), 2010 edition, hereinafter 2010 Census, as the basis for the analysis. We take as a reference the contribution of intersectional studies (CRENSHAW, 2002; CARNEIRO, 2011; DAVIS, 2016) for a more accurate understanding of the articulations between some axes of subordination (CRENSHAW, 2002), commonly converted into inequalities, such as sex and race, attributes that also constitute the living conditions of people with disabilities (GOES, 2014).
Historically, the understanding about people with some type of disability has been marked by its differentiation in relation to those not classified in this category, disregarding that the constitution of every human being is intrinsic to their concrete living conditions. Thus, commonly, ideas about these people are supported by a homogenizing conception, that is, by the denial of diversity among individuals, configured “[…] in the historical categorical distinction of disabilities that understood them as a differentiated set of human beings as to its constitutive processes, but homogeneous within the disability category” (GOES, 2014, p. 13, our translation). This implies a predominance of productions in the field of public policies on the subject, pointing out the disability without considering other aspects of the human constitution (GONZALEZ, 2013).
Despite this gap, the study by Meyer and Patton (2001) points to the influence of the racial issue on the identification and referral of students to special education services in the United States of America (USA), since African-American students are more perceived as having a disability and little identified as having high abilities/giftedness in the country. Furthermore, most students classified with ID in the US are black, male, according to an extensive literature review carried out by Gonzalez (2013).
Brazilian researches (MENDES; LOURENÇO, 2009; GONZALEZ, 2013; PEREIRA, 2016) point in the same direction when understanding that, in Brazil, special education services are, in general, filled by 2/3 of boys and 1/3 of girls, which may be a reflection of the gender bias on the perception of school in the identification of this student.
For this reason, the challenges of the special education policy (BRASIL, 2008) do not lie only in the educational specifics of each student depending on the category of disability that fits them, but also in understanding how multiple aspects of their life can influence their schooling. Thus, we agree with Goes (2014) that the nomination disability may not have allowed the understanding that these individuals are not only people with disabilities,
[…] rather, they are men, women, poor, rich, black, white, etc. For this reason, the challenge of inclusive education does not lie only in the perspective of the generality of students, but also in the changes that this experience attributes to all individuals in the social space. (GOES, 2014, p. 13, our translation).
Considering this panorama, we rely on studies about intersectionality to analyze social indicators related to people classified in the ID category.
From Crenshaw (2002, p. 177, our translation), we understand that the intersectional approach is the one “[…] that seeks to capture the structural and dynamic consequences of the interaction between two or more axes of subordination”, such as sex and race, which are commonly vectors of inequalities for access to social rights, inscribed in our Federal Constitution, namely: “[…] education, health, food, work, housing, transportation, leisure, security, social welfare, maternity and childhood protection, assistance to helpless” (BRASIL, 1988, art. 6, our translation).
Analyzes of census data indicate that people with disabilities in Brazil, compared to the general population, have lower rates of access to these fundamental rights, especially the population with ID (OLIVEIRA, 2012). That said, the choice of the ID category as the object of analysis in this article is justified, as it is the public that is most vulnerable to the influence of subjective factors in its categorization, which has been manifested, for example, in its greater representation in the computation of special education enrollments in ordinary classes, representing more than 50 percent of total enrollments in recent years (MELETTI; BUENO, 2011; GOES, 2014; LOPES, 2018).
To highlight the concept of disability, it is important to remember that the Brazilian State is a signatory to the Convention on the Rights of Persons with Disabilities (ONU, 2006; BRASIL, 2009) and, therefore, understands that disability is constituted in the relationship of the person with socially imposed barriers, not limited to the individual sphere.
Angelucci (2009) helps us in this reading by discussing the idea of normality and abnormality, pointing out that they are patterns whose constitution is linked to the historical, social and cultural context, used to classify people. In the same perspective, Cotrin (2010, p. 178, our translation) reflects that the “[…] very concept of disability should be questioned, from the perspective that normality is not something naturally established, but corresponds to the expectations of a given group and social moment”.
From the definition of ID established by American Association on Intellectual and Developmental Disabilities (AAIDD), the Brazilian State has adopted the nomenclature and concept of this institution defined in the same way since 2002 (VELTRONE; MENDES, 2011), according to which:
Intellectual disability is a disability characterized by significant limitations in both intellectual functioning and adaptive behavior, which covers many everyday social and practical skills. This disability originates before the age of 18. (AAIDD, 2018, on-line).
Linking this definition of ID to the concept of disability as a relational condition between the individual and the environment (BRASIL, 2009), the idea of “normal” intelligence also needs to be seen through the perspective of social construction or, in other words, the socially established standard for a person to be considered “intelligent”. In addition,
[…] the way in which we have historically constructed the question about human diversity perseveres, since its effect, always obeying the same social function, is the creation of two groups, polarized, in which it is possible to distinguish who has the legitimacy to be seen as an individual of rights – the normal – and who occupies the place of, at most, the target of the granting of favors – the abnormal. (ANGELUCCI, 2009, p. 25, our translation).
The author’s reflections are reaffirmed, above all, when we adopt the premise that the access to social rights by a person with a disability is directly related to their concrete living conditions beyond the type of disability, being, therefore, also determined by gender and race, which, as we will explore, constitute axes that subordinate them to different living conditions.
From the theory of black feminism, Crenshaw (2002, p. 172, our translation) presents a discussion on the “[…] identification of situations in which gender discrimination is amplified by or combined with racial discrimination, or vice versa”, aiming to draw attention to the “[…] fact that a range of of human rights violations is obscured when the intersectional vulnerabilities of marginalized women and occasionally also marginalized men are not considered.” (CRENSHAW, 2002, p. 178, our translation).
According to Davis’ (2016) analysis, at first none of these axes is more dominant than the other. Thus, we will briefly address the definition of each of them following a sequence for the purpose of organizing ideas without intending to classify them as more or less preponderant, bringing the definition of gender and race to the core of our discussions.
In this article, gender and race are conceived as axes of subordination understood by their political dimension and their historical, social and cultural principles.
Gender is a socially and historically constructed concept that helps us understand the differences built between men and women, thus refuting its naturalization (SCOTT, 1995; NICHOLSON, 2000). This term began to be used by feminist academics from the 1970s onwards to affirm that the inequality and oppression to which women were subjected were not related only to gender differences, therefore, they were not merely biological, but rather resulting from sociocultural issues.
In this direction, for Scott (1995, p. 13, our translation):
Gender is the social organization of perceived sexual difference. This does not mean that gender reflects or implements fixed and natural physical differences between men and women, but that gender is the knowledge that establishes meanings for bodily differences. These meanings vary according to cultures, social groups and time, as nothing in the body […] uniquely determines how the social division will be established.
Thus, the way bodies will express the feminine and the masculine is constructed by society. This leads us to the understanding that gender is an element in the organization of power relations in several instances, such as family, school and work, which can be understood as a gender bias in the interpretation of the male and female social roles.
Also in order to understand the race axis, we adopt in this text the social, historical and cultural perspective. In Guimarães (1999, p. 153, our translation), we understand that race does not refer to attributes given by the biological apparatus, but to “[…] social constructs, forms of identity based on an erroneous biological idea, but socially effective, to build, maintain and reproduce fully existing differences and privileges in the social world”.
In this regard, Schwarcz (2012, p. 34, our translation) defines that:
Race is, therefore, a classificatory category that must be understood as a local, historical and cultural construction, which belongs as much to the order of social representations - as are fantasies, myths and ideologies - as it exerts real influence in the world, through the production and reproduction of collective identities and politically powerful social hierarchies.
We share with Munanga (2003) the understanding that the concept of race is loaded with ideology and, therefore, hides the relationship of power and domination that structures it and that has historically led the black population to deprivation of social rights (CARNEIRO, 2011), such as education, an effect that multiplies in the articulation with the sex attribute, and has unique effects on the schooling processes of this population.
We bring the idea of schooling to the set of our discussions because we understand that the right to school education - which includes admission, permanence and completion of basic education with learning - is essential to guarantee all other social rights (MONTEIRO, 2003). Considering the lack and precariousness of official data about learning in school education of the population with ID in Brazil, we used information from the 2010 Census (BRASIL, 2010), specifically on the literacy rate - which expresses the percentage of people aged 5 or older who can read and write at least one simple note in their language (IBGE, 2010).
With these data, we sought to understand the profile of the population with ID through an intersectional perspective.
Adopting an intersectional approach to understand aspects of the living conditions of people with ID as an important factor to support analysis, planning and evaluation of public policies is essential, because the juxtaposition of different subordination axes may be the reason for the deepening of the situation of exclusion of these individuals. As an illustration of this, when analyzing data from the World Bank and the United Nations (UN) for the year 2000, Goes (2014, p. 33, our translation) shows the close connection between poverty and disability, pointing out that “[…] one in twenty inhabitants of the planet have some disability, and, in the poorest countries, this proportion drops to one in five inhabitants”.
This shows that the way in which inequalities affect the lives of a population and different social groups is not unambiguous. Therefore, it is necessary to understand ID in relation to different axes of subordination and discuss how they overlap so that we can debate possible confrontations based on public policies of a social nature.
One of the ways to understand the living conditions of the population is to analyze social indicators, an important source of information for the formulation, implementation, monitoring and evaluation of public policies (JANNUZZI, 2005). Based on Miles (1985) and UN productions, the author explains that
[…] the indicators point, indicate, approximate, translate into operational terms the social dimensions of interest defined from theoretical or political choices made previously. They are able to support public planning activities and the formulation of social policies in different spheres of government, enable the monitoring of the living conditions and well-being of the population by the government and civil society and allow the deepening of academic research on social change and on the determinants of different social phenomena. (JANNUZZI, 2005, p. 138, our translation).
Also, according to the author, to monitor a public policy we can rely on administrative data and “[…] public statistics (produced by the IBGE and other institutions), which, reorganized in the form of rates, proportions, indexes or even in absolute values become social indicators” (JANNUZZI, 2005, p. 139, our translation).
In this sense, such indicators are translated into tangible and operational figures, relevant dimensions of social reality (JANNUZZI, 2005). To do so, whenever possible,
[…] an attempt should be made to use indicators of good territorial or population coverage that are representative of the empirical reality under analysis. This is one of the interesting characteristics of the social indicators produced from demographic censuses, which make them so important to public planning in the country. (JANNUZZI, 2005, p. 140, our translation).
Considering the scope of this research, we sought to understand who are the people classified with ID in Brazil, considering the following social indicators: occupation, monthly nominal income and literacy.
The main concern is to analyze how these data intersecting with race and gender can contribute to the planning of educational policies, given that they subject individuals to different living conditions and print marks that maintain and/or deepen inequality. Thus, the research is guided by the following question: what are the possible implications of the social indicators referring to the population with ID for the current national policy on special education?
This questioning is explored based on the information produced by IBGE within the scope of the Demographic Census 4 and published on its portal, which we take as a data source. However, before presenting the methodological path of this study, it is important to consider some aspects of social indicators formulation by IBGE on people with disabilities in Brazil.
IBGE’s social indicators on the population with disabilities in Brazil
Data on people with disabilities were produced by the IBGE already in the first Brazilian census, in 1872 (IBGE, 2018a). However, it was in 1989 that the “[…] inclusion of issues concerning people with disabilities in the 1991 Demographic Census and in subsequent years” was determined (IBGE, 2018a, p. 1, our translation). Thus, such issues were present in the 1991, 2000 and 2010 Censuses. In the last national census, the IBGE sought
[…] to capture the population’s perception of their difficulty in hearing, seeing and walking or climbing stairs, even with facilitators such as hearing aids, contact lenses and walking sticks. The questionnaire also sought to identify intellectual and mental disabilities through the informant’s understanding of the difficulty in performing their usual activities. (IBGE, 2018a, p. 2, our translation).
Thus, the Demographic Census identifies four categories of disability: hearing (HD), physical (PD) 5 , visual (VD) and mental or intellectual (ID) 6 . Due to the methodology used by IBGE to identify people with disabilities in the country, studies in the field of special education (SASSAKI, 2003; MELETTI; BUENO, 2011, 2013) have questioned the validity of this information, considering that the results may not effectively portray the reality due to the possibility of the questionnaire›s respondents misinterpreting the questions. In the reading of these authors, an expression of this is the high rate of people classified in the VD category that, in 2000 and 2010, had a higher percentage in relation to the other categories of disability investigated by the Demographic Census in the country. For the authors, these results express methodological limitations of the Census, so that people who do not fit the condition of VD may have declared or been declared as such. (SASSAKI, 2003; MELETTI; BUENO, 2011, 2013).
In order to improve the discussion on monitoring indicators for the Brazilian population and contribute to the identification of possible gaps in its research, in 2018, IBGE published the document National and international overview of the production of social indicators ( Panorama nacional e internacional da produção de indicadores sociais ) (IBGE, 2018b). Regarding the information on persons with disabilities in the 2010 Census, this publication draws on the recommendations of the Washington Group for statistics on persons with disabilities (WG) 7 to perform a re-reading of those data, classifying as persons with disabilities only those who answered, in one or more questions from the 2010 Census, Very difficult or Can’t do it at all. Thus, people, until then counted, who responded that they sad Some difficulty , were excluded. It is worth mentioning that this parameter does not apply to ID, as the question about this condition allows only yes or no as answer categories.
The main implication of this change lies in the following fact:
[…] the total population of persons with disabilities residing in Brazil captured by the 2010 Demographic Census sample is not represented by 45,606,048 people, or 23.9 percent of the 190,755,048 people censused in the last census, but by a quantity of 12,748,663 people, or 6.7 percent of the total population registered by the 2010 Demographic Census. (IBGE, 2018b, p. 5, our translation).
The adoption of the WG cut line had a significant impact, as shown by the decrease in the percentage of people by type of disability in relation to the population without disabilities in the country. Namely, respectively without and with the application of the WG cut line: VD, from 18.8 to 3.4 percent; HD, from 5.1 to 1.1 percent; PD, from 7.0 to 2.3 percent. (IBGE, 2018a). As previously announced, the WG criteria did not affect the percentage of people with ID, which remained at 1.4 percent.
Considering the total calculation of each type of disability, it is registered that all of them decreased, except for ID. However, an important difference is observed in the percentage of each category when we take as reference only the group of people with disabilities, as illustrated in the graph below.
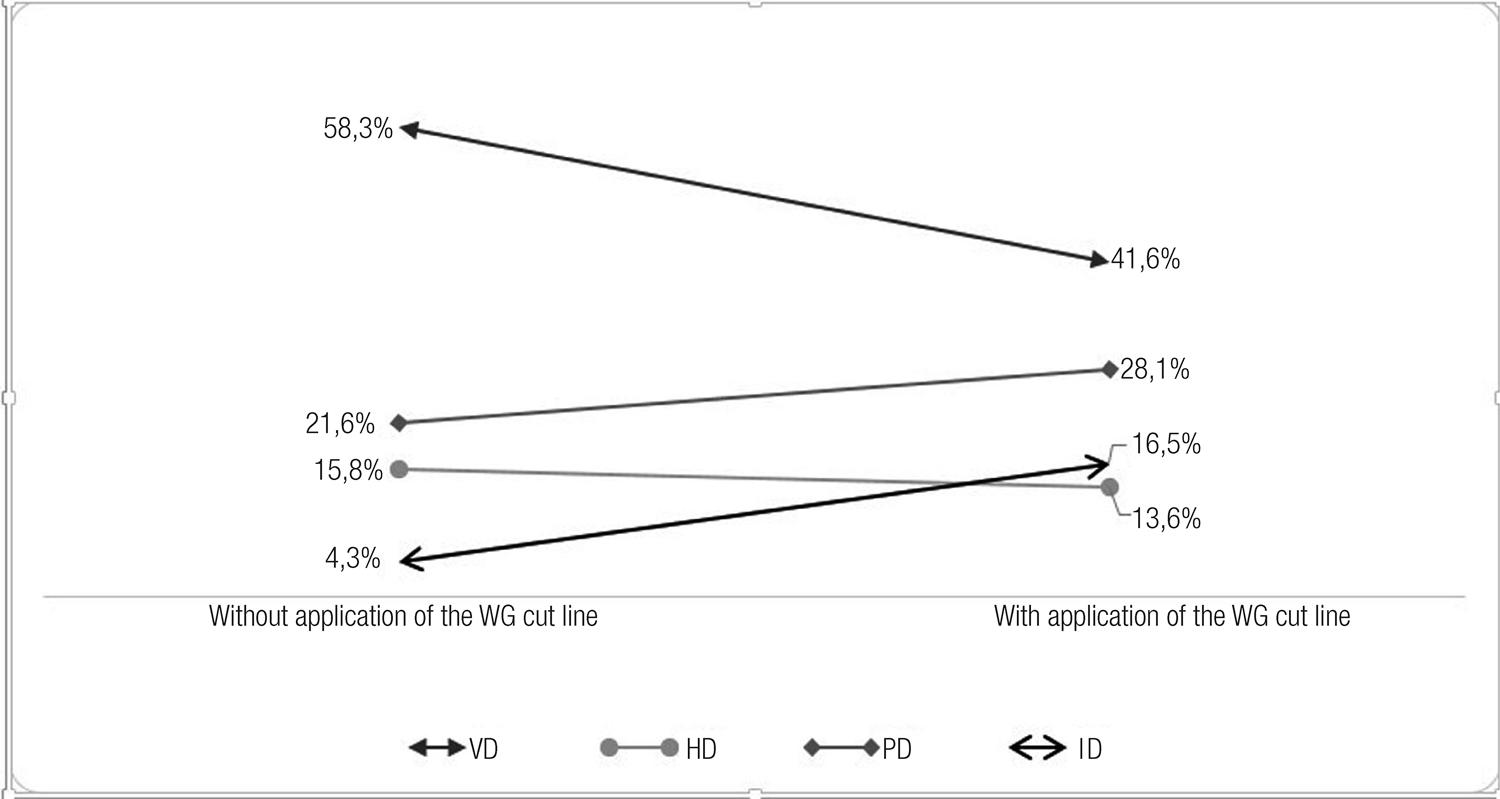
Source: Data extracted from the 2010 Census (IBGE, 2010) and organized by the authors.
Caption: WG – Washington Group.
Graph 1 – Percentage of each type of disability among people classified in one of these conditions - Brazil – 2010
The data in the graph above reveal that, in percentage terms, only the VD and HD categories decreased. VD remained in first position in the ranking, highlighting its marked difference (−16.7 percent), which suggests confirmation of the questions of Sassaki (2003) and Meletti and Bueno (2011, 2013) about the methodology used so far by IBGE. On the other hand, HD, although showing a decrease in the total and percentage calculation, moved from third to fourth position due to the significant percentage difference in the ID category, which now represents 16.5 percent of the population with disabilities, occupying the third position. Although it remained in second position, PD also showed an increase of 7.5 percent.
Despite these discrepancies, as highlighted by the Institute itself (IBGE, 2018b, p. 7, our translation), “[…] this is not a correction of the numbers that were released”. The re-reading focuses on the analysis of the results.
With these questions in mind, in this article we work with census data considering the WG cut line, which, although not focused on the population with ID in relation to the total population, significantly changed its percentage within the group of people with disabilities, such as has been demonstrated previously. That is to say, these considerations do not at all refute the questions of Sassaki (2003) and Meletti and Bueno (2011, 2013), since, even with the application of the WG cut line, there may be inaccuracies in the information produced by the IBGE, that requires more specific studies. However, it is worth remembering that the authors’ questions precede the IBGE’s re-reading of data on people with disabilities and, therefore, refer to a different universe from the one we deal with in this text.
Furthermore, currently, the data from the 2010 Census are the only data produced on a national scale on the characterization of people with disabilities in Brazil. Thus, even if limited, such data can reveal and contribute to the understanding of intersectional factors that mark the condition of life of these people, allowing us to identify different axes of subordination, which is fundamental for the discussion of public policies, among them, education, considering that information about the country’s population’s schooling are indications of possible confrontation of economic, social and cultural inequalities. In this sense, we agree that, despite “[…] limited, the available data [from IBGE] can reveal how educational care for this population is evolving” (MELETTI; BUENO, 2011, p. 375, our translation), to mention one of the aspects of the national policy on special education.
In the Demographic Census, we can find indicators that allow us to understand who are people with ID in Brazil in terms of occupation, income, gender, race or color and literacy rate, as explained below in the presentation of the study’s methodological path.
Methodology
Studies in the area of special education (BUENO; MELLETI, 2011; LOPES, 2018; PRIETO et al., 2018) have reported to the Demographic Census to contextualize who are people with disabilities in Brazil - which reinforces the idea that the data of IBGE are a reference, demonstrating their institutional and political legitimacy – despite the doubts they transmit about their technical and scientific legitimacy (SASSAKI, 2003; MELETTI; BUENO, 2011, 2013). Thus, we use the 2010 Census data as they are the most recent to date, since in Brazil this census is carried out every ten years and, above all, due to the lack of studies on the population with disabilities considering the current re-reading of the IBGE based on WG recommendations.
All data produced by IBGE are organized in tables and can be extracted from the IBGE Automatic Recovery System (Sidra in Portuguese), available on the institute’s electronic portal, which contains its Statistical Table Database (Banco de tabelas estatísticas ), which allows access by filters (indicators, population, economy and geosciences) corresponding to results of different types of research, such as the Demographic Census, present in the filter Population . The information in this filter is classified into the topics: General, Universe and Sample , organized in synopses and available in tables dealing with the themes: population, households and/or territory . In addition, the data can be disaggregated to the levels: Brazil, geographic region and federation unit.
The only one that contains information about the population with disabilities is the Sample topic, which corresponds to data from 6,192,332 Brazilian households, which means “[…] an effective sample fraction of around 10.7 percent for the country as a whole” (BRASIL, 2010, on-line). For the purposes of this research, we worked only with data from the Population with Disabilities sub-topic, from which, in a set of ten tables, only in six the information disaggregated by type of disability and, therefore, specific about the population with ID can be extracted. Of these, we chose those that contain information related to occupation, monthly nominal income, gender, race or color 8 and literacy.
It is also important to clarify that, when disaggregating the data by disability category, crossing with other 2010 Census indicators, it is only possible to identify the number of occurrences of each type of disability, and not the total number of people. This is because a person classified in more than one disability category is counted more than once in the disaggregated data 9 .
The data were reorganized into tables and graphs and discussed from the theoretical framework that considers the intersection between two or more axes of subordination, which can be found in the studies by Crenshaw (2002), Mendes and Lourenço (2009), Carneiro (2011), Davis (2016) and Pereira (2016).
Results and discussions: intersectional reading of social indicators and their implications for special education policy
We seek to understand the profile of the population with ID considering some aspects that are structurally axes of subordination, as they give people unequal conditions in terms of access to social rights.
Starting with the gender axis, in Graph 2 we can see that the majority of the population with ID is male (54 percent). Although without a significant difference, it does not follow the trend of the total Brazilian population (except people with one of the disabilities investigated by the IBGE), which is distributed between 49.4 percent male and 50.6 percent female. The grouping of people with ID by gender also does not follow the group of people with at least one of the investigated disabilities, which are distributed between 43.9 percent males and 56.1 percent females.
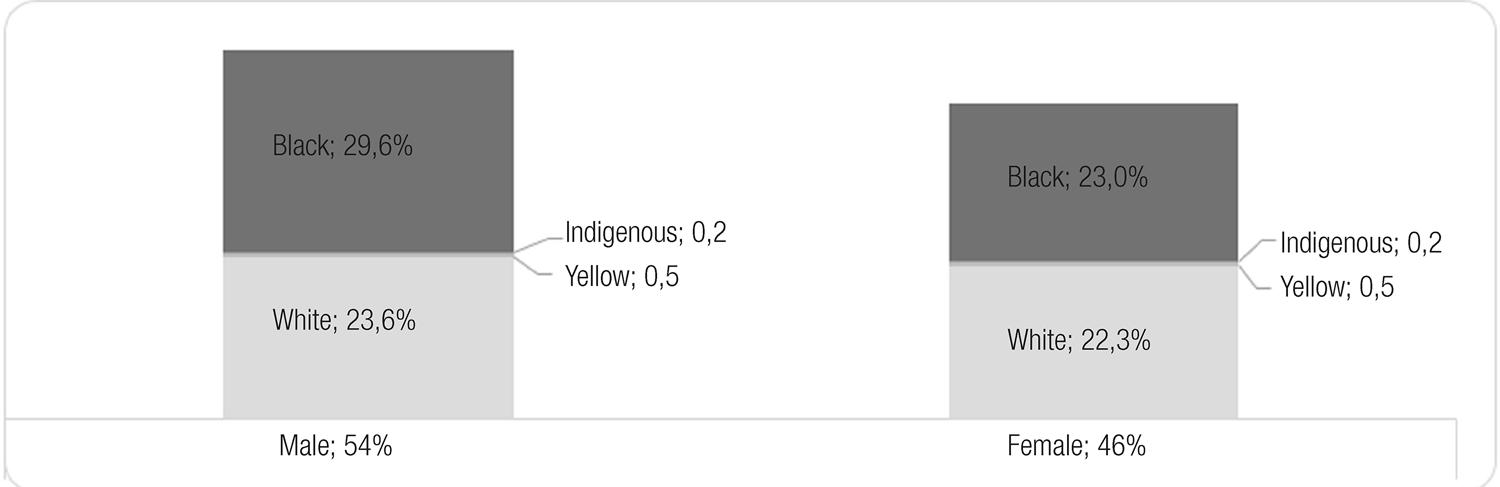
Source: Data extracted from the 2010 Census (IBGE, 2010) and organized by the authors.
Graph 2 – Percentage of the population with ID, according to gender and color or race
Although with a lower percentage difference between male and female, the characterization of the population with ID by gender in the country is more similar to what occurs in the school context, which has been composed of 66 percent male students with ID and 33 percent of the female (PRIETO; SOUSA, 2006; PEREIRA, 2016; LOPES, 2018), indicating possible relationships between the classification of students in the ID category influenced by gender bias, that is, the distinct “[…] expectations and stereotypes of gender roles that society attributes to individuals according to their gender, which result in an increase in expectations and demands on boys, and at the same time in a greater tolerance towards the low performance of girls” (MENDES; LOURENÇO, 2009, p. 418, our translation).
When considering the characterization by color or race ( Graph 2 ), data from IBGE (2010) show that the population with ID is composed of 45.9 percent of people declared white, 52.6 percent declared black 10 - with 8.5 percent black and 44.2 percent mixed race (“parda”) – 1.1 percent yellow, 0.4 percent indigenous and none without color or race declaration. These data follow the distribution of the general population where people declared to be black represent about 50 percent of the entire population of the country (IBGE, 2010).
This distribution also occurs among the other categories of disability, in which people declared to be black represent 53.5 percent of the group of people with VD, 50.1percent with PD and 47.8 percent with HD. When we look at the percentage of people with ID by crossing gender and color or race ( Graph 2 ), we find that the majority is made up of declared black men (29.6 percent), followed by white men (23.6 percent), black women (23 percent) and white women (22,3 percent). These data are different from the general population, which is mostly composed of black women (IBGE, 2010). Thus, along with gender bias, the racial issue marks the classification of people in the ID category.
It is known that the black population, for structural reasons, suffers disadvantages and inequalities in the access to social rights (CARNEIRO, 2011), which in itself requires the search to understand how these issues overlap as well as the possible actions of confrontation through public policies.
It is important to highlight, however, that the data used in this study allowed the articulation of the race axis only with the gender axis, so that the data from IBGE (2010) on the population with disabilities in the country do not allow an intersectional analysis that articulates disability and race with other aspects.
In an attempt to understand information about socioeconomic possibilities, we work with data on the employed population and classes of monthly nominal income (IBGE, 2010b). It is worth clarifying that the IBGE (2010, online) defines an employed population as “[…] people who, in a given reference period, worked or had a job, but did not work (for example, people on vacation)”. The monthly nominal income refers to the amount of minimum wages received by the employed person in each month worked (IBGE, 2010).
Regarding “classes of monthly nominal income” in the group of the employed population, with some type of disability and aged 10 or older (24,923,902 people), the data show that only 1.7 percent (ie, 419,769) of this total corresponded to the ID category, thus being the least covered by the occupation, followed by the HD categories, with 14.8 percent, PD, with 15.9 percent, and VD, with 67.7 percent (IBGE, 2010). Therefore, the population with ID seems to lack a specific look in the scope of insertion policies in the job market, an issue that certainly articulates with the scenario of these people’s schooling and, therefore, indicates the need for an intersectional approach for education policies in the country.
When considering people with ID who are employed and, consequently, covered by monthly nominal income, from Graph 3 , it is possible to observe that - in the percentage calculation of the four types of disability considered here and in all classes of monthly nominal income - the people with ID are at the lowest level of the scale in all income ranges, except for the “no income” index, which corresponds to people who only had benefits, such as the Continuous Cash Benefit Programme (BPC, which stands for Benefício de Prestação Continuada in Portuguese) 11 (IBGE, 2010), being the largest group in this category.
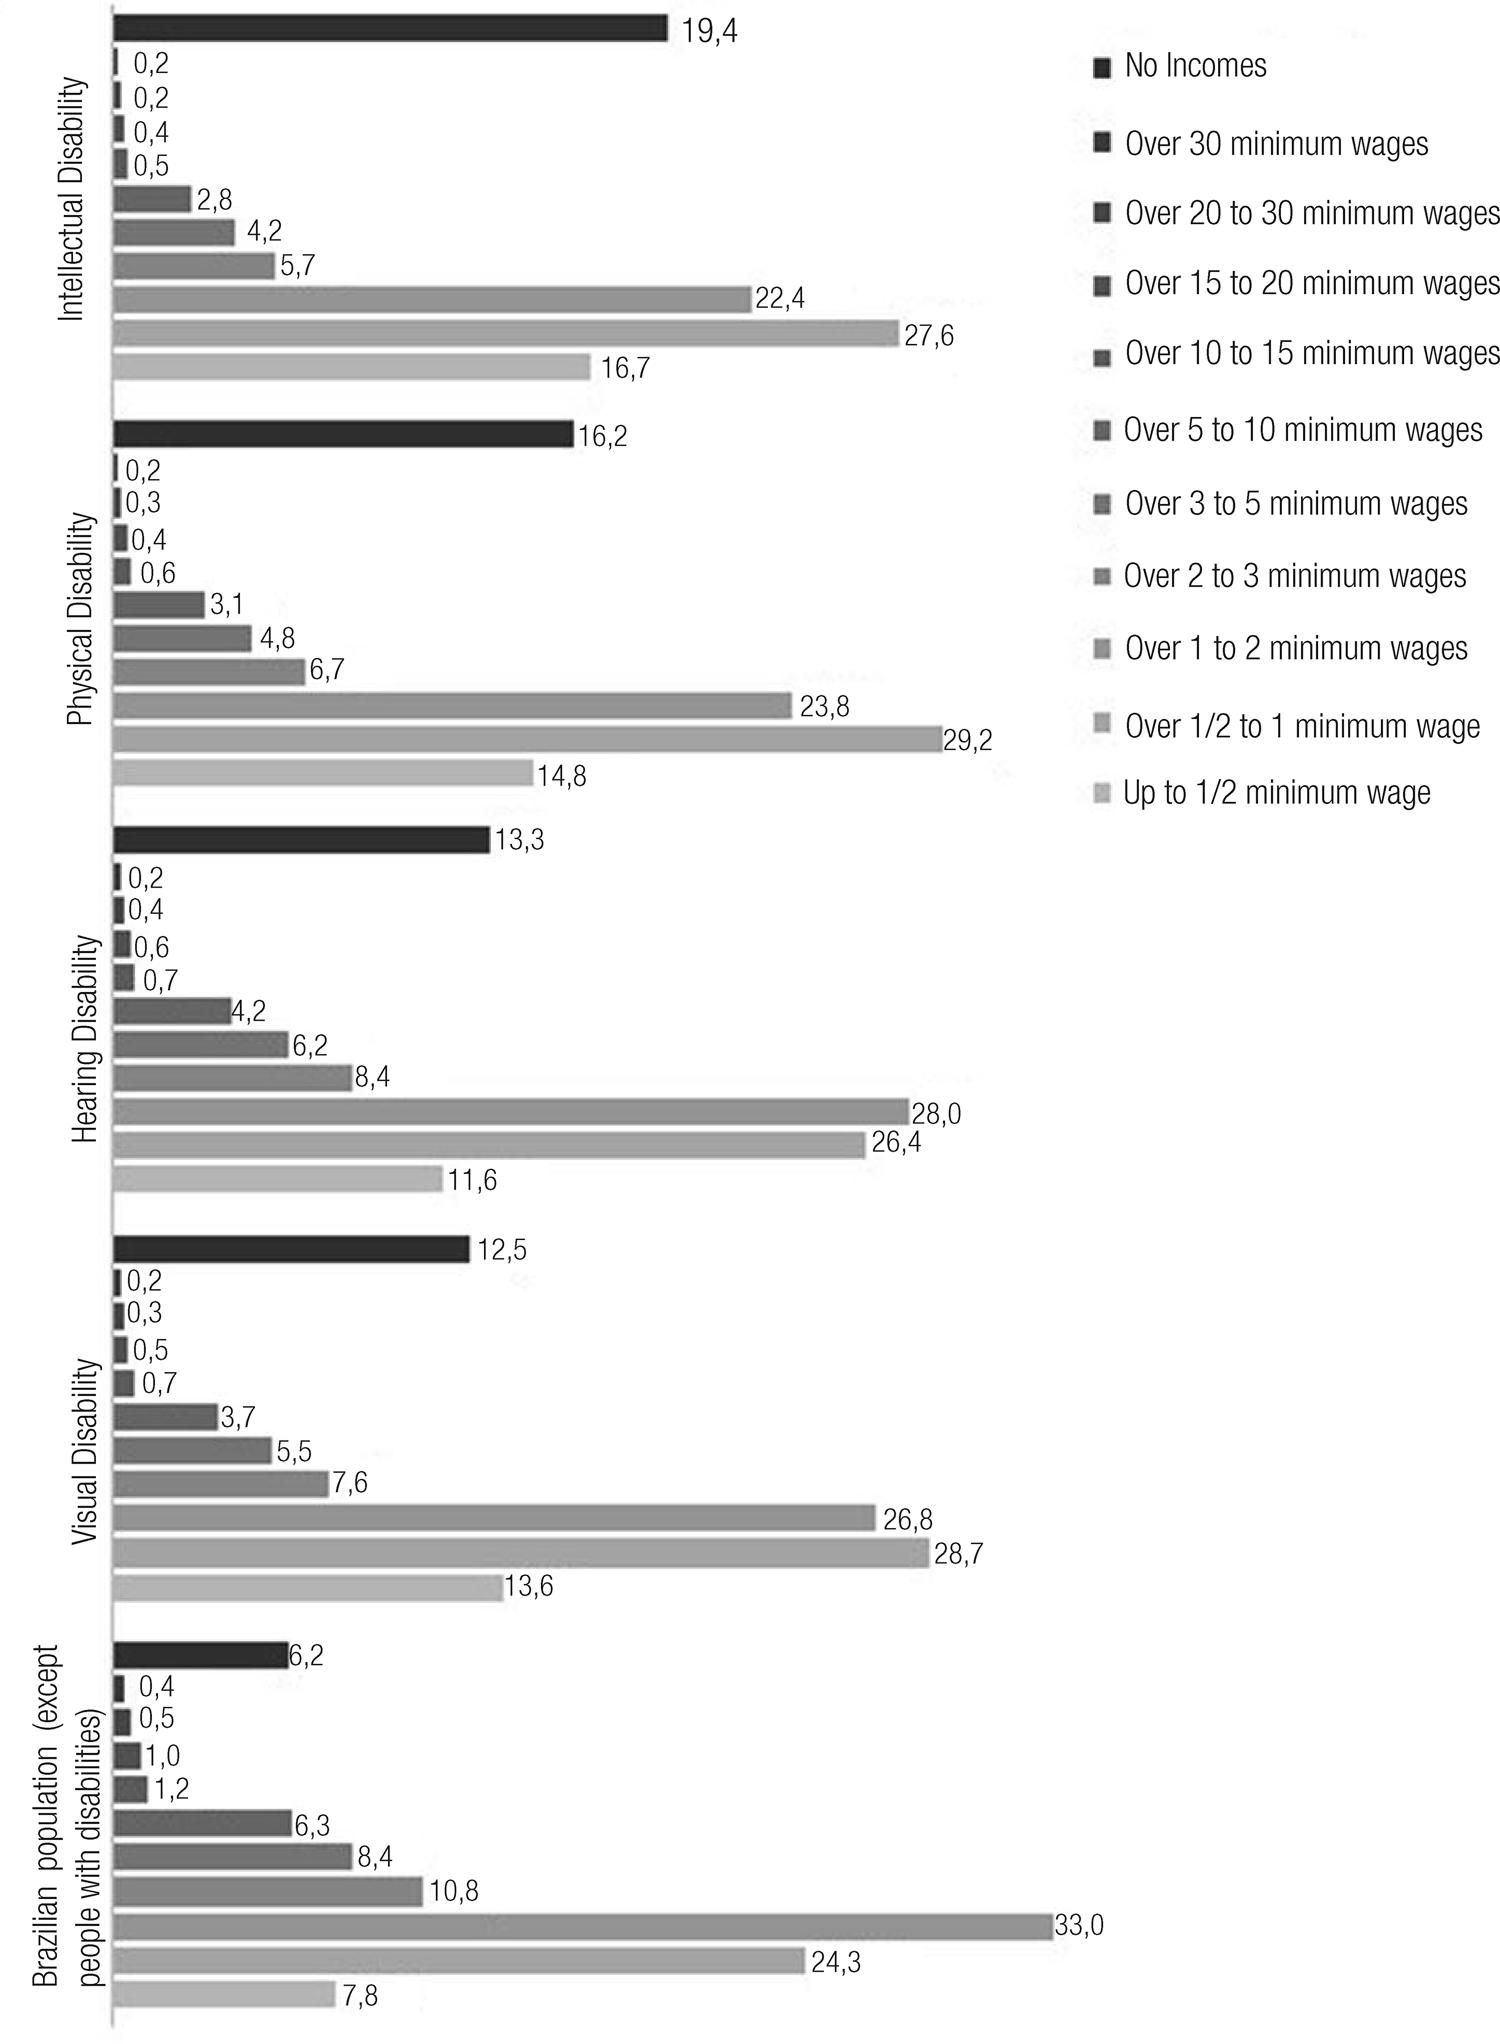
Source: 2010 Census (IBGE, 2010) and edited by the researchers.
Note: Minimum wage = 510 reais in 2010.
Graph 3 Percentage of persons aged 10 or older, employed, by type of disability and classes of nominal monthly income
This data suggests, once again, the need for specific considerations to this public that, within the group of people with disabilities, suffers greater disadvantage in relation to others, which may also be a consequence of the social value given to the intellectual attribute in the work activity. As pointed out by Goes (2014), the greater vulnerability of people with ID is notorious, both in relation to those without disabilities and among individuals classified in the other categories, given that, in our society, the intellectual condition is a highly valued attribute, which persists the idea that this, supposedly, “[…] enables people to face the most varied challenges imposed by a competitive society and with technological advances in large steps” (GOES, 2014, p. 21, our translation).
In an attempt to understand other specificities of the socioeconomic possibility of people with ID, we organized the data on monthly nominal income classes, disaggregating them by gender ( Graph 4 ).
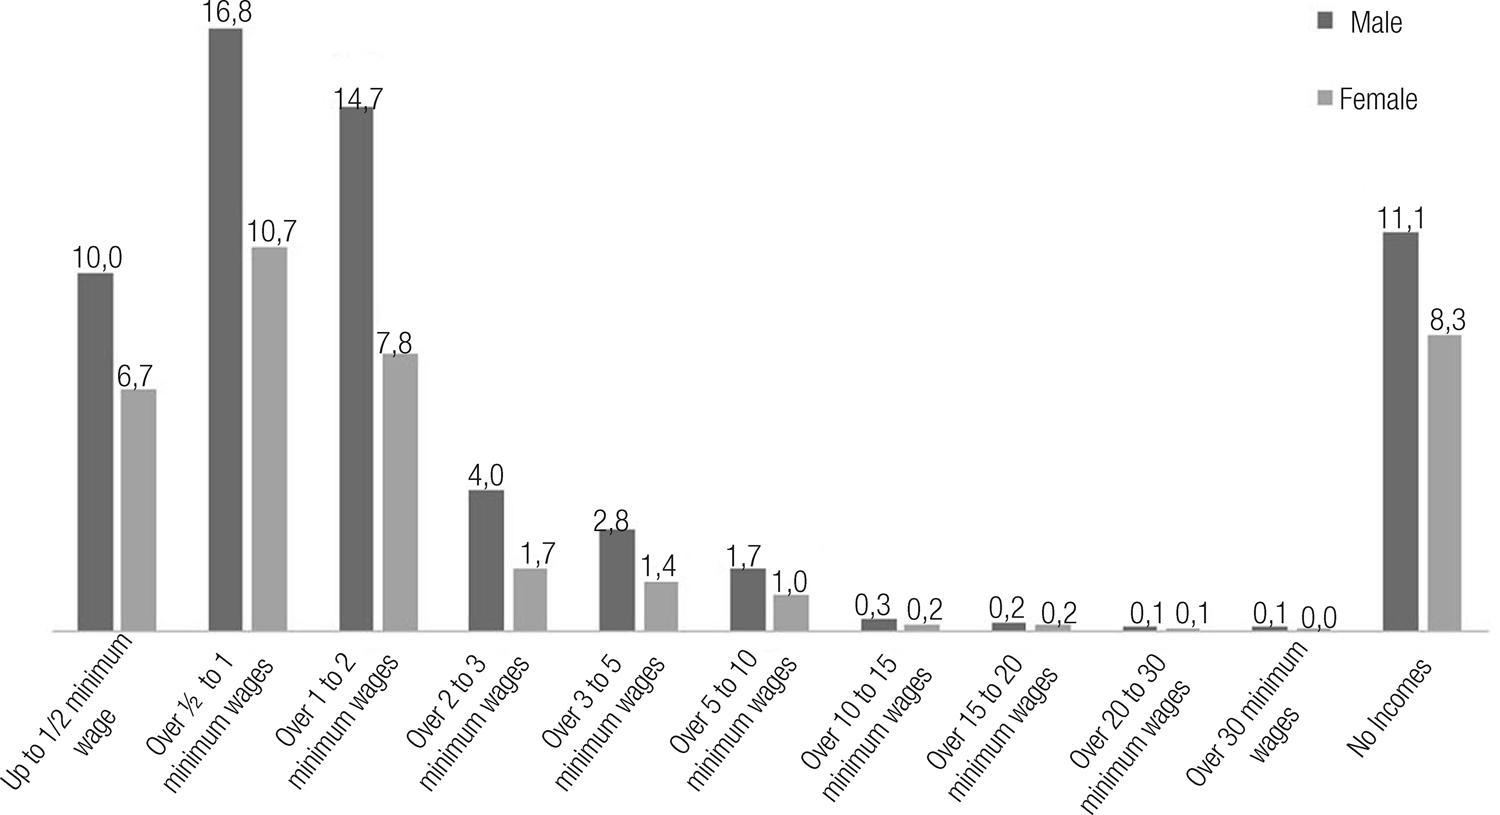
Source: 2010 Census (IBGE, 2010) and edited by the researchers.
Graph 4 – Percentage of people with ID aged 10 or older, employed in the reference week, by gender and nominal income classes
The data in Graph 4 indicate that the higher the income class, the fewer people with ID fill them, which stands out between the ranges “Over 10” and “Over 30 minimum wages”. The class with the highest percentage of people with ID is the one with over ½ to one minimum wage which, when comparing with data in Graph 3 , we can identify that this aspect is not repeated for the entire Brazilian population, not even for some of the other categories of disability, showing that people with ID occupy the most disadvantaged scale in the category monthly nominal income.
In addition to this disadvantage, another is evident when we compare the male and female groups, the former being present in a higher percentage in all classes, including in “no income”.
Considering that the BPC beneficiaries are in the “without incomes” class, we can ask: has the female sex suffered inequalities in access to this benefit motivated by gender issues, reproducing what happens in the entire Brazilian population?
It is also observed that the higher the income class, the smaller the distance between the sexes, since, from ten minimum wages, both fall to less than 1 percent and, in the category over thirty wages, the female percentage is null, once again indicating gender as a possible vector of inequalities between the group of people with ID, so that these data suggest a disadvantage of females in relation to males, reproducing what occurs among the population without disabilities and also among the other types of disabilities addressed by IBGE (2010). As we will see in the analysis on literacy presented below, these data do not establish links with information related to the schooling of women with ID.
In addition to information on income, we sought to understand information about the schooling of people with ID based on literacy indicators ( Graph 5 ).
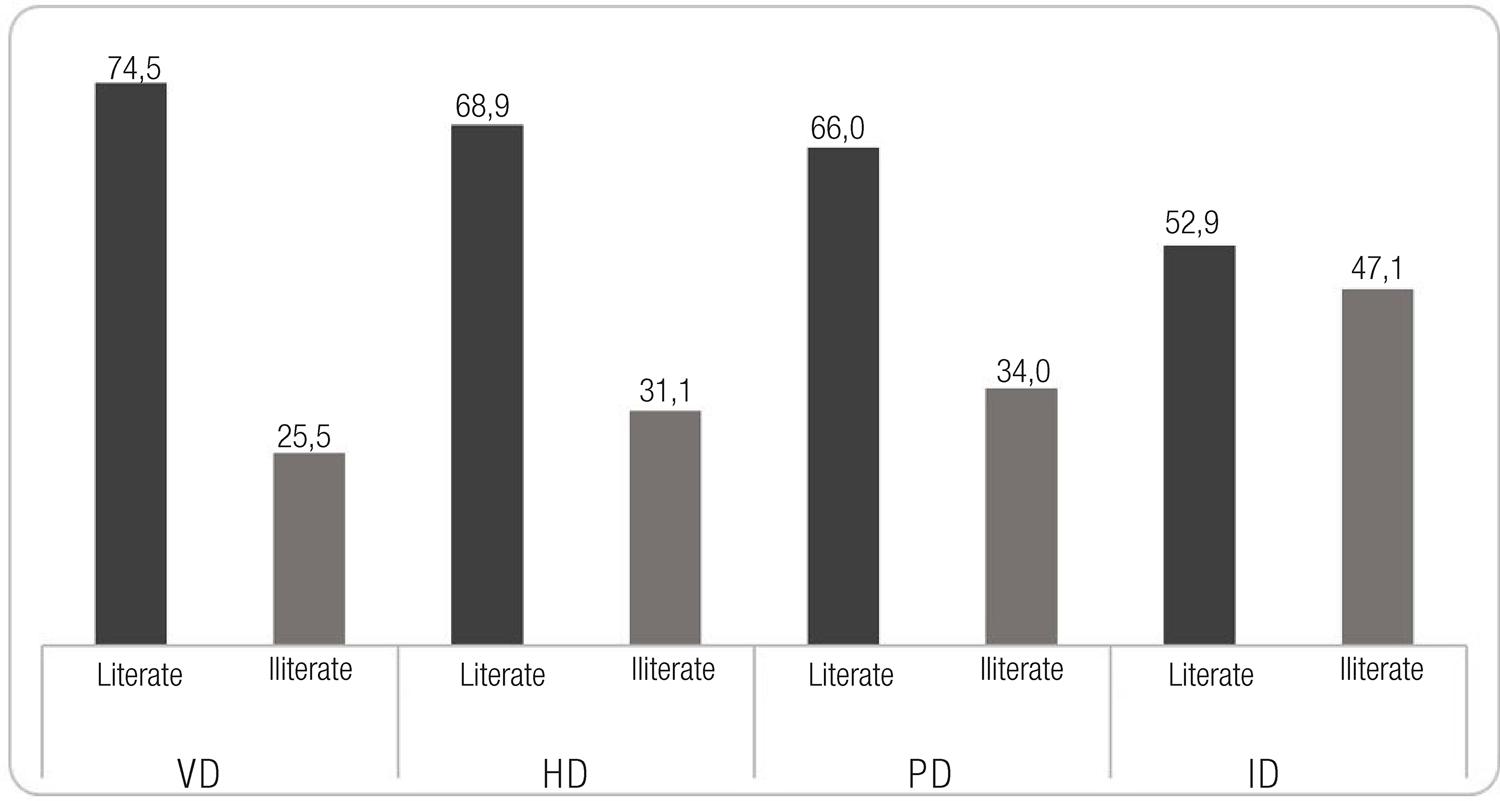
Source: 2010 Census (IBGE, 2010) and edited by the researchers.
Graph 5 Percentage of people aged 5 or older, by type of disability and literacy
Initially observing the ID category among the other types of disability, the first relevant aspect to consider is that the population with ID has a lower percentage of people considered literate (52.9 percent).
Considering the literacy of people with ID in relation to gender, it is observed, in the data on Graph 6 , that gender issues seem to have no influence on literacy opportunities, so that in both genders the majority (just over half of each group) was literate.
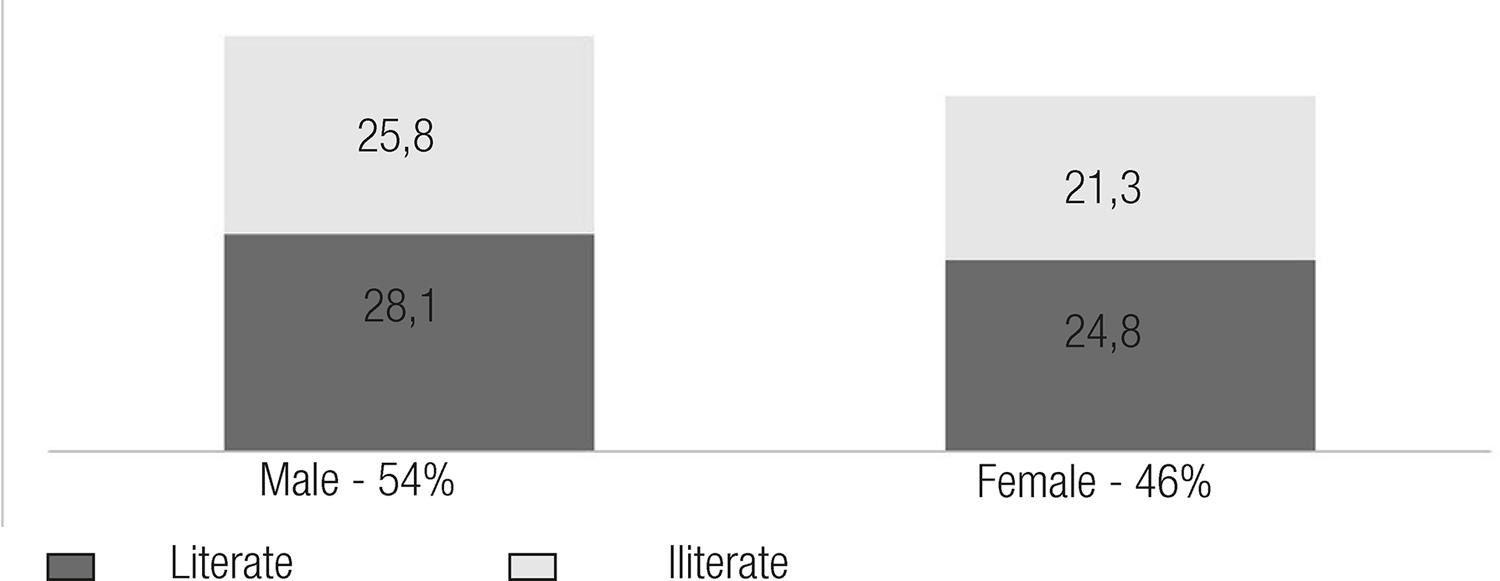
Source: 2010 Census (IBGE, 2010) and edited by the researchers.
Graph 6 – Percentage of people with ID aged 5 or older, by gender and literacy
Comparing these data with those of the general population, there is a large discrepancy, since, among them, the percentage of illiterate people is 8.5 percent, with 4.6 percent male and 3.9 percent female. Furthermore, here it is possible to observe a slight difference in opportunities between the genders, with a lower percentage of illiterate females.
Final considerations
The data indicate that, compared to the other categories of disability covered by the 2010 Census, ID is the one that suffers the most disadvantages in social indicators of access to work, income and literacy.
In addition, gender issues are shown to be influential as an axis of subordination, granting females less access to social rights addressed in this study, even though they represent the lowest percentage of the entire group of people with ID in the country.
Another important consideration refers to the racial identification of people with ID in the country, which seems to influence the classification of individuals in this category of disability. It is important to highlight that the data used in this study allowed us to articulate the race axis only with the gender axis, so that the analyzed data do not allow an intersectional reading that articulates color or race with other indicators, such as occupation, income and literacy.
Finally, the results indicate the need for a specific look and an intersectional perspective to this public, which, within the group of people with disabilities, demonstrates greater disadvantage compared to others in accessing the social rights provided for by the Federal Constitution of the country. According to the data presented, we can understand the emerging need for more data on these people to be produced, as well as for them to be disaggregated, allowing intersectional analyzes with a view to understanding how different axes of subordination affect the lives of people with ID in Brazil and indicating actions within the scope of educational policies specifically dedicated to confronting inequalities that uniquely mark the situation of people with ID when compared to the general population and, also, to other categories of disability. Furthermore, research that articulates social indicators to social representations of gender and race associated with disability are needed to deepen the understanding of the population targeted by the special education policy (BRASIL, 2008), in view of the precariousness of studies that understand these indiciduals beyond their disability, considering other attributes of their human constitution that impact their opportunities for accessing social rights, especially education.
REFERENCES
AAIDD. American Association on Intellectual and Developmental Disabilities. Intellectual Disability: Definition. Silver Spring: AAIDD, [2018]. Disponível em: https://bit.ly/2KJqWUf . Acesso em: 5 jul. 2018. [ Links ]
ANGELUCCI, Carla Biancha. O educador e o forasteiro: depoimentos sobre encontros com pessoas significativamente diferentes. 2009. Tese (Doutorado em Psicologia) – Universidade de São Paulo, São Paulo, 2009. [ Links ]
BRASIL. [Constituição (1988)]. Constituição da República Federativa do Brasil. Diário Oficial da União: seção 1, Brasília, DF, 5 out. 1988. [ Links ]
BRASIL. Decreto nº 6.949, de 25 de agosto de 2009. Promulga a convenção internacional sobre os direitos das pessoas com deficiência e seu protocolo facultativo, assinados em Nova York, em 30 de março de 2007. Diário Oficial da União , Brasília, DF, 25 ago. 2009. [ Links ]
BRASIL. Lei nº 8.742, de 7 de dezembro de 1993. Dispõe sobre a organização da Assistência Social e dá outras providências. Diário Oficial da União , Brasília, DF, 8 dez. 1993. [ Links ]
BRASIL. Secretaria de Educação Especial. Política nacional de educação especial na perspectiva da educação inclusiva . Brasília, DF: MEC, 2008. [ Links ]
CARNEIRO, Sueli. Racismo, sexismo e desigualdade no Brasil: consciência em debate. São Paulo: Selo Negro, 2011. [ Links ]
COTRIN, Jane Teresinha Domingues. Itinerários da psicologia na educação especial: uma leitura crítica em psicologia escolar. 2010. Tese (Doutorado em Psicologia Escolar e do Desenvolvimento Humano) – Instituto de Psicologia, Universidade de São Paulo, São Paulo, 2010. [ Links ]
CRENSHAW, Kimberlé. Documento para o encontro de especialistas em aspectos da discriminação racial relativos ao gênero. Estudos Feministas , Florianópolis, v. 10, n. 1, p. 171-188, 2002. [ Links ]
DAVIS, Angela. Mulheres, raça e classe . São Paulo: Boitempo, 2016. [ Links ]
GOES, Ricardo Schers de. Escolarização de alunos com deficiência intelectual: as estatísticas educacionais como expressão das políticas de educação especial no Brasil. 2014. Tese (Doutorado em Educação) – Pontifícia Universidade Católica de São Paulo, São Paulo, 2014. [ Links ]
GUIMARÃES, Antônio Sérgio Alfredo. Raça e os estudos de relações raciais no Brasil. Novos Estudos CEBRAP , São Paulo, n. 54, p. 147-156, 1999. [ Links ]
GONZALEZ, Roseli Kubo. Educação especial e processos de encaminhamento para salas de recursos: relações de gênero e cor/raça. 2013. Tese (Doutorado em Educação) – Faculdade de Educação, Universidade de São Paulo, São Paulo, 2013. [ Links ]
IBGE. Instituto Brasileiro de Geografia e Estatística. Censo Demográfico 2010: características gerais da população, religião e pessoas com deficiência. Rio de Janeiro: IBGE, 2010. Disponível em: https://biblioteca.ibge.gov.br/visualizacao/periodicos/94/cd_2010_religiao_deficiencia.pdf . Acesso em: 20 ago. 2018. [ Links ]
IBGE. Instituto Brasileiro de Geografia e Estatística. Censo Demográfico 2010: nota técnica 01/2018 – releitura dos dados de pessoas com deficiência no Censo Demográfico 2010 à luz das recomendações do Grupo de Washington. Rio de Janeiro: IBGE, 2018a. [ Links ]
IBGE. Instituto Brasileiro de Geografia e Estatística. Panorama nacional e internacional da produção de indicadores sociais: grupos populacionais específicos e uso do tempo. Rio de Janeiro: IBGE, 2018b. [ Links ]
INEP. Instituto Nacional de Estudos e Pesquisas Educacionais Anísio Teixeira. Sinopse estatística da Educação Básica 2010 . Brasília, DF: Inep, 2010. Disponível em: https://bit.ly/2HIS8wP . Acesso em: 2 mar. 2019. [ Links ]
JANNUZZI, Paulo de Martino. Indicadores para diagnóstico, monitoramento e avaliação de programas sociais no Brasil. Revista do Serviço Público , Brasília, DF, v. 56, n. 2, p. 137-160, 2005. [ Links ]
LOPES, Ingrid Anelise. Inclusão e direito à aprendizagem de alunos com deficiência intelectual em escola municipal paulistana . 2018. Tese (Doutorado em Educação) – Faculdade de Educação, Universidade de São Paulo, São Paulo, 2018. [ Links ]
MELETTI, Silvia Márcia Ferreira; BUENO, José Geraldo Silveira. O impacto das políticas públicas de escolarização de alunos com deficiência: uma análise dos indicadores educacionais no Brasil. Linhas Críticas , Brasília, DF, v. 17, n. 33, p. 367-383, 2011. [ Links ]
MELETTI, Silvia Márcia Ferreira; BUENO, José Geraldo Silveira. A escolarização de alunos com deficiência intelectual: análise dos indicadores educacionais brasileiros. In: MELETTI, Silvia Márcia Ferreira; BUENO, José Geraldo Silveira (org.). Políticas públicas, escolarização de alunos com deficiência e a pesquisa educacional . Araraquara: Junqueira & Marin, 2013. p. 75-86. [ Links ]
MENDES, Enicéia Gonçalves; LOURENÇO, Gerusa Ferreira. Viés de gênero na notificação de alunos com necessidades educacionais especiais. Revista Brasileira de Educação Especial , Marília, v. 15, n. 3, p. 417-430, 2009. [ Links ]
MEYER, Gwen; PATTON, James M. On the nexus of race, disability, and overrepresentation: What do we know? Where do we go? On point… Brief discussions of critical issues in urban education. Washington, DC: National Institute for Urban School Improvement, 2001. [ Links ]
MILES, Ian. Social indicators for human development. New York: St. Martin’s Press, 1985. [ Links ]
MONTEIRO, Agostinho dos Reis. O pão do direito à educação. Educação e Sociedade , Campinas, v. 24, n. 84, p. 763-789, 2003. [ Links ]
MUNANGA, Kabenguele. Uma abordagem conceitual das noções de raça, racismo, identidade e etnia. In: BRANDÃO, André Augusto (org.). Cadernos PENESB nº 5. Niterói: EdUFF, 2003. p. 1-17. [ Links ]
NICHOLSON, Linda. Interpretando o gênero. Estudos Feministas , Florianópolis, v. 8, n. 2, p. 9-41, 2000. [ Links ]
OLIVEIRA, Luiza Maria Borges. Cartilha do Censo 2010: pessoas com deficiência. Brasília: DF: SDH/PR: SNPD: Coordenação-Geral do Sistema de Informações sobre a Pessoa com Deficiência, 2012. [ Links ]
ONU. Organização das Unidas. Convenção sobre os direitos das pessoas com deficiência: aprovada pela Assembleia Geral da ONU. Genebra: ONU, 2006. [ Links ]
OSÓRIO, Rafael Guerreiro. O sistema classificatório de cor ou raça do IBGE . Brasília, DF: Ipea, 2003. [ Links ]
PEREIRA, Michelle Melina Gleica Del Pino Nicolau. Deficiência, raça e gênero: análise de indicadores educacionais brasileiros. 2016. Tese (Doutorado em Educação) – Pontifícia Universidade Católica de São Paulo, São Paulo, 2016. [ Links ]
PRIETO, Rosângela Gavioli; SOUSA, Sandra Zákia Lian. Educação especial no município de São Paulo: acompanhamento da trajetória escolar de alunos no ensino regular. Revista Brasileira de Educação Especial , Marília, v. 12, n. 2, p. 187-202, 2006. [ Links ]
PRIETO, Rosângela Gavioli et al . Inclusão escolar e políticas de educação especial: direito ao ingresso, permanência e aprendizagem em escolas municipais paulistanas. São Paulo: Fapesp, 2018. [ Links ]
SASSAKI, Romeu Kazumi. O censo de pessoas com deficiência na era da inclusão. Revista Nacional de Reabilitação , São Paulo, v. 1, n. 32, p. 4-7, 2003. [ Links ]
SCHWARCZ, Lilia Moritz. Nem preto nem branco, muito pelo contrário: cor e raça na sociabilidade brasileira. São Paulo: Claro enigma, 2012. [ Links ]
SCOTT, Joan. Gênero: uma categoria útil de análise histórica. Educação e Realidade , Porto Alegre, v. 20, n. 2, p. 71-99, 1995. [ Links ]
VELTRONE, Aline Aparecida; MENDES, Enicéia Gonçalves. Descrição das propostas do Ministério da Educação na avaliação da deficiência intelectual. Paidéia , Ribeirão Preto, v. 21, n. 50, p. 413-421, 2011. [ Links ]
3- “IBGE […] is the main provider of data and information in the country, which meet the needs of the most diverse segments of civil society, as well as the institutions of the federal, state and municipal governmental spheres”. Available at: https://bit.ly/2yYACCh . Accessed on: Nov. 19 2019.
4- “Demographic censuses are statistical researches whose survey consists of visiting all households in a country and are the only source of reference for understanding the living conditions of the population in all municipalities and their internal territorial sections - districts, neighborhoods and localities, rural or urban”. Available at: https://bit.ly/2gOe6G4 . Accessed on: 13 Oct. 2019.
6- In the 2010 Census, mental and intellectual disability are synonymous terms. Therefore, they refer to the same group of people.
7- “Having as its horizon the international comparability of statistics on persons with disabilities, it was founded within the scope of the UN Statistical Commission, the Washington Group on Disability Statistics (IBGE, 2018a, on-line). The group is “[…] composed of representatives of Official Statistical Institutes and organizations representing civil society. As the official representative of Brazil, IBGE has participated since the beginning of the formation of the group, in 2001, following the discussions and studies proposed” (IBGE, 2018a, on-line).
8- The IBGE (2010, online) investigated the person’s declared color or race, with the following response options: white; black; yellow (of oriental origin: Japanese, Chinese, Korean etc.); mixed race (“parda”); and indigenous.
9- For example: in a group of 30 people with disabilities, 25 with VD and 5 with ID associated with HD, the data disaggregated by disability category includes: 25 with VD, 5 with ID and 5 with HD, therefore, totaling 35.
10- Based on Osório (2003), we understand that the sum of the number of people declared to be black and mixed race (“pardas”) constitutes the total black population in Brazil.
11- The Continuous Cash Benefit Programme (BPC) is the guarantee of a monthly minimum wage to the disabled person and to the elderly aged 65 (sixty-five) or older who prove that they do not have the means to provide for their own maintenance or to have it provided for by their family. (BRASIL, 1993, art. 20, our translation)
Received: December 17, 2019; Accepted: July 21, 2020
 This is an Open Access article distributed under the terms of the Creative Commons Attribution Non-Commercial License, which permits unrestricted non-commercial use, distribution, and reproduction in any medium, provided the original work is properly cited.
