


 Inglês (pdf)
 Artigo em XML
 Enviar este artigo por email
 Permalink
Introduction
Over the last half century, and especially in the aftermath of the establishment of democracy (1974), significant positive transformations occurred in Portugal not only of a socioeconomic nature and in quality of life but, more specifically, and in this case, in the education and training of the Portuguese population (CORDEIRO; ALCOFORADO, 2018). Although sociodemographic indicators, in general, and educational indicators in particular, have considerably improved, this is not to say that problems do not persist. One of which is academic failure, which, even though reduced, is still high, compared to our European counterparts, as well as early school leaving2.
Conceptually, according to various authors (CANAVARRO, 2007; PEREIRA, 2014; TEODORO; ANÍBAL, 2007), academic failure and early school leaving are multidimensional phenomena, which various theories have sought to describe and explain the variables behind what keeps students at school and their academic success, based on the dynamic interaction between student, family, school, and socioeconomic and territorial context to which they belong. These theories make us realise the importance of understanding the central units of the problem, which eventually explain these phenomena better, from an ecological and diachronic perspective.
It will be important to underline, in particular, that the characteristics of school systems which are most related to equity and their respective expected and obtained contributions are of a very different nature, from issues related to the organisation of education systems, such as conditions of access and participation, the participation of resources and conditions of learning, up to broader political dimensions related to social and economic problems of education (HERBAUT, 2011), all of which have a significant impact on school success and contribute to making it an important indicator of equity and efficiency in education systems (BREAKSPEAR, 2012).
With specific regard to the surrounding environment, Canavarro (2007) suggests that we should consider “the pressure for an unqualified labour force; poor access and transportation to school; a social disadvantaged neighbourhood likely to generate adversity; and poor interaction between the local government, social, recreational and corporate structures and the school.”
Although the surrounding environment is a significant factor, it is not always (or is very rarely) the most studied. For this reason, it is essential to conduct studies, such as ours, to also address, describe and understand how territorial dynamics can interfere with good educational attainment, reflected, in this specific case, in students’ achievements in national assessment exams.
In the Portuguese case, similar to initiatives which took place in other European countries, as part of the plan to establish and expand compulsory schooling and transition to unified, less segmented and selective school systems, policies emerged which provided for the improvement of school conditions of groups of most disadvantaged students (LEMOS, 2013). As an example, there is the implementation of school educational projects, embodied in the Territórios de Intervenção Prioritária (TEIP - Priority Intervention Territories), enabling greater autonomy and the mobilisation of specific resources to solve academic failure and early school leaving in specific areas, and the pioneering approach developed by the Association of Entrepreneurs for Social Inclusion (EPIS), which also considers the surrounding environment and the territory as factors which contribute to students remaining in school and fostering their academic achievements3.
The problem of academic failure invariably results from a number of factors which work independently and in interaction, especially school dynamics and organisation and the specific features of its cultural and social milieu. These aspects were among many others which led to a study that aimed to reduce academic failure in the central region of Portugal by considering the three realities involved in school (under)performance: the student, the social milieu, and the educational institution (CORDEIRO, 2015).
In view of these three realities, it seems relevant to highlight some references which tie in with this phenomenon, among which the fact that academic failure in Portugal is related to students’ language facility and their literacy, both orally and in writing, with children from more disadvantaged social classes being more penalised in this respect (FERRÃO, 1992; REBELO, 1990). This association is hardly surprising in that many international studies have interrelated the problems of poverty and hardship with limited school attendance and academic success (BOURDIEU, 19864; DUNN; CHAMBERS; RABREN, 2004; HERBERS et al., 2012; UNICEF, 2007).
To examine this specific issue, Almeida et al. (2005) mobilised the concept of ‘cultural capital’, a structuring contribution towards an in-depth understanding of this problem which considers the complexity inherent to their action in the interaction of the distinctive attributes which form each community, in particular the characteristics of students’ families. The author’s critical analysis showed that academic success is positively related to the presence of perceptions, orientations, decisions, values and cultural habits valued by the school in students’ family group.
Our study considers the territory, everything within it and to what it contributes, including the ‘cultural capital’ of families and inter- and extra-school dynamics, reflecting different diagnostic tools used in the framework of a broader project developed to combat academic failure and early school leaving within the next six months in a territory which covers 19 municipalities of an Intermunicipal Community (CIM - Comunidade Intermunicipal) in the central region of Portugal, the Coimbra Region Intermunicipal Community. This is an innovative study since it considers the territory as an important factor in students’ school achievement and it bases its methodology on dynamic and powerful analyses of the influence of this very factor in the phenomenon it aims to explain.
Methodology
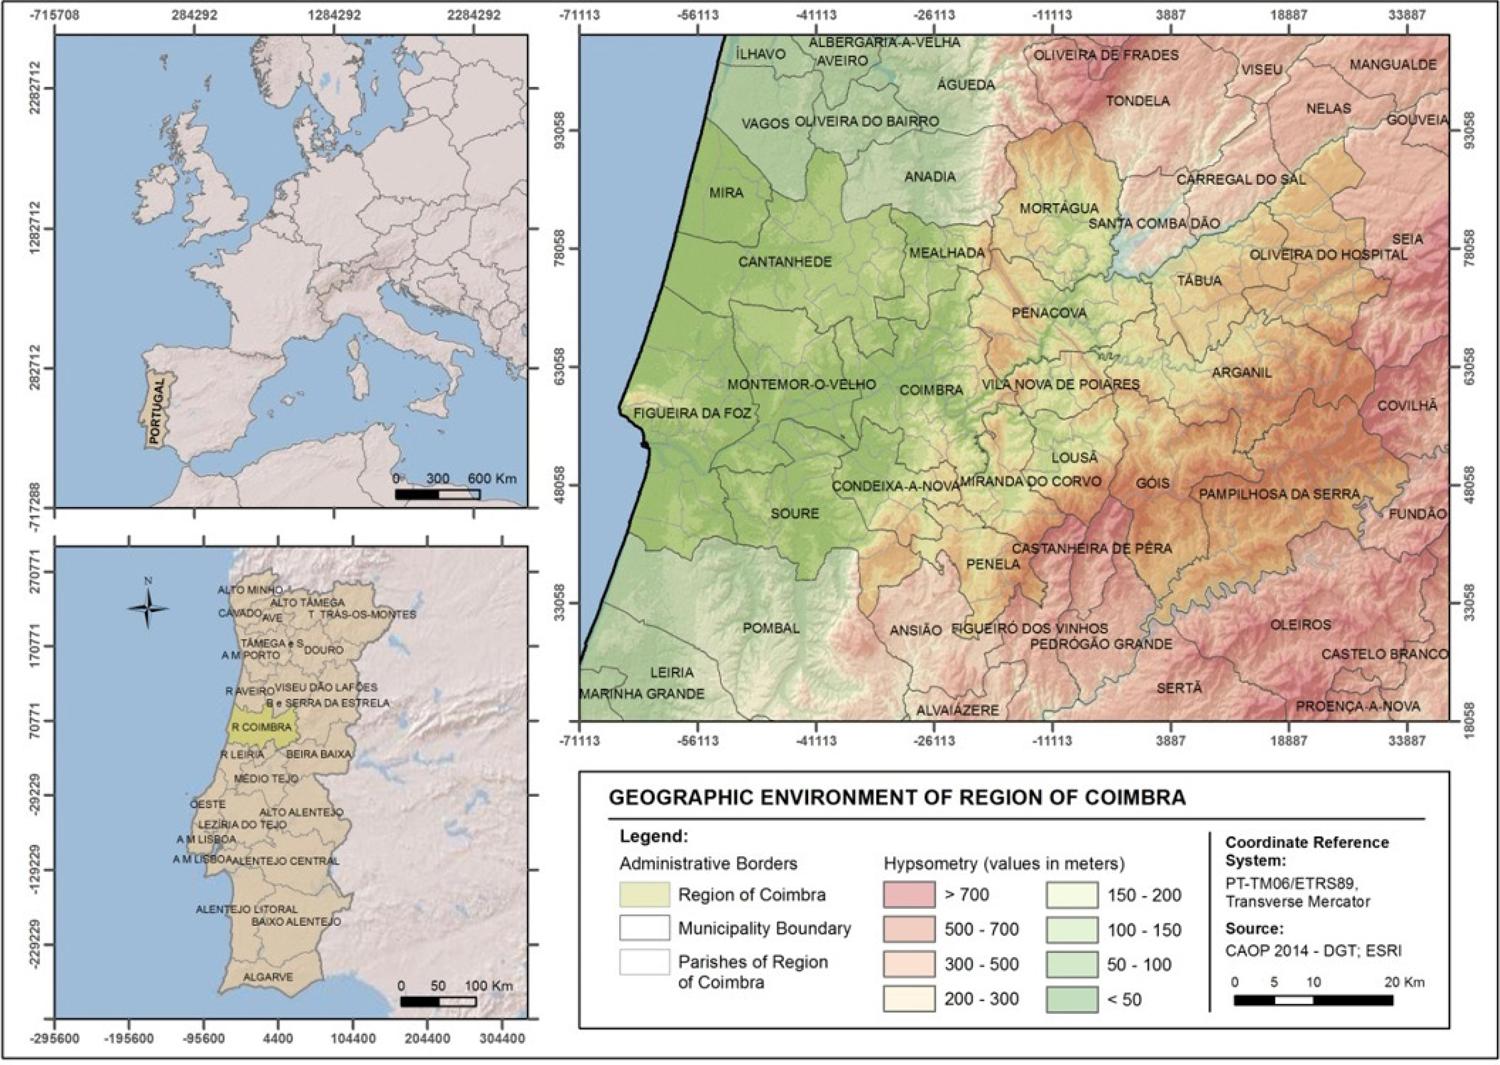
The geographical extent of the territory under study is characterised by a large morphological diversity, consisting of more flat land in its westernmost areas near the coast and mountainous areas further inland (cf. Figure 1). These morphological differences have long affected human geography, manifested in areas with variable population densities and distinct development trajectories. Over the last half century, the western sectors are marked by higher demographic densities, younger age structures and greater economic dynamism, whereas the entire eastern mountainous sector of the Coimbra Region CIM has typically low density territories, generally rural in nature, with structural demographic and socioeconomic problems.
The main aim of our study was to investigate the possibility of a relation between basic territorial characteristics and academic success (in this study, the weight of teachers and dynamics of the school community on academic failure was ignored). We, therefore, developed a comparative analysis of a set of variables divided into three methodological phases: the definition of territorial clusters in a multi-scale analysis (2.1); educational achievements or school results (2.2.), and interpolation, the cross-checking of the clusters and educational achievements (2.3).
Definition of territorial clusters
Based on the assumption that the characteristics of territories may influence learning, and in view of the diversity found in the region under analysis, we defined the territorial patterns which reflected areas of homogeneous demographic, social and economic behaviour. To that end, we developed a multivariate analysis using ‘Principal Component Analysis’ (PCA), followed by an ‘Ascending Hierarchical Classification’ (AHC).
The purpose of the PCA, which is accepted as a multivariate statistical method, was to identify new variables (factors), fewer than the initial ones, without a significant loss of the information of the whole. Factors are calculated using a measure of association (correlation coefficient) which transforms a set of correlated initial variables into unrelated variables (principal components), resulting from linear combinations of the initial set. The aim is not to explain the distribution of phenomena in a simplistic way but rather to find mathematical functions between the initial variables which will explain the original variance of data as accurately as possible (ACEVEDO, 2012; CLEFF, 2014; LEBART; MORINEAU; PIRON, 1995).
To apply this method, 34 variables were selected with the help of statistical tests, collected at parish scale for 2011 (Population Census), which reflected dynamics related to education and professional skill, demography, economic activities, employment and living conditions. These 34 variables were condensed into eight factors, which can explain about 70% of the original variance. The first four factors were used to explain 55.3% of the initial data variation.
The AHC methodology, in turn, building on the results of the previous method, enabled the aggregation of territorial units with similar characteristics. This aggregation was developed from the Euclidean distances between individuals and the Ward’s method (CLEFF, 2014; FERNANDES, 2002). Overall, five territorial clusters were defined from the built dendrogram, considering only the relative position of each factor considered in the PCA analysis, a process which used the SPSS software (version 23, IBM).
School results
The analysis of school results was developed based on 4th-year national exam grades (the year in which the 1st Basic Education Cycle – BEC - is completed – usually by 10 year-old students) and on corresponding internal assessment grades5 for 20146. This study included all schools which took national exams that year, totalling 224 educational establishments.
The value given to each school, both for exam and test grades, was based on the calculation of a simple mathematical mean. After creating a database with the results obtained by each student, we added the grades and then divided them by the total number of exams taken. The values of both the standard deviation (9.79) and the coefficient of variation (16.49) are small compared to the universe under analysis, so we consider that the values of the means can be used in this study.
Inverse distance weighted interpolation
A cartogram shows the cross-checking of 4th-year grades and clusters. The area represented in said cartogram was obtained by an arithmetic operation between both interpolation areas, one containing the values of exams and the other, the clusters. In a first phase, we defined the centroids of parishes in which schools with exam figures were located and assigned a cluster to the corresponding parish. Having determined the two point layers, the corresponding interpolation areas were then calculated using the ArcGIS (version 10.3, ESRI) software algorithm, Inverse Distance Weighted (IDW).
The ArcGIS software builds a raster layer in which the value of each cell is determined by the weight of the linear combination of a set of points. In other words, it is assumed that the value of the variable becomes less important as it moves away from a point. Via this method the interpolated values do not arise from a simple linear variation between two points with distinct values but rather from a variation which depends on the influence we give the points. In this study, an influence of 0.5 was assigned as lower values will give us more flexible areas.
One of the software features allows us to define the number of points used in the interpolation, that is, the number of points to be considered for finding the (interpolated) value of a cell. After the tests, and in view of the variations in the spatial distribution of points and their validation in the field, we chose to consider 15 points and then define a ‘variable’ search radius since a ‘fixed’ one would result in a zoning which would be atypical of the spatial distribution of variables.
The raster calculator of the software ArcGIS (version 10.3, ESRI) was used to cross-check the two variables, which gave us the arithmetic mean of the values present in the raster areas, resulting in a new area. Since the values were in different scales, 0 to 100 for exams and 1 to 5 for clusters, the following formula had to be used: ((Exam Value/20)+(5-Cluster Value))/27. Note that the cluster value is minus 5 because the lower values in the clusters represent more developed territories, which is contrary to exams, so both variables would tally.
Results
Socioeconomic contexts
As the territorial units under analysis are internally diverse, dividing the supra-municipal area into two large sectors with very distinct morphological features – the eastern and western sectors –, as is usually done, would be quite a narrow approach (cf.Figure 1).
In fact, the transformations seen in Portugal over the last quarter of the 20th century resulted in an urban, networked country, changing the customary two-pronged readings of traditional Portugal – north/south and coastland/inland. We are talking about a more spatially unbalanced and socially less heterogeneous country in which ‘landlockedness’ (as a socioeconomic process) can extend to the coast land and ‘coastalness’ can appear in inland territories (FERRÃO, 2003). It was within this frame of analysis that we sought to overcome the aforementioned dichotomies by a more detailed analysis – the parish scale (territorial clusters) –, to have a closer reading of the reality in question, especially in a territory as diverse as that of the Coimbra Region CIM, in which we find its main urban centre – Coimbra – and another medium-sized one – Figueira da Foz –, but in which territories near the coast are declining.
The defined variables concern four themes: a) education and professional skill; b) demography; c) economic activities and employment; and d) living conditions. The choice of variables was based on statistical tests, eliminating those which had little explanatory power for the model and fixing the analysis to a set of 34 variables (Table 1).
Table 1 Matrix of original statistical indicators
Source: Self-elaboration.
We turned these 34 variables into eight factors which explain about 70% of the original variance of the data. Since the variables which characterize factors five to eight point to very particular elements and have a very low percentage of variance and explanatory power, only the first four factors were used, which explain about 55.3% of the variation in the initial data.
The first factor explains 33.5% of the data, translating its main structure. The second factor explains 10.1%, and the remaining ones are responsible for explaining 6.4% and 5.3% of the data, respectively (Table 2).
Table 2 Eigenvalue matrix
| Factor | Own value | Variance (%) | Accumulated variance (%) |
|---|---|---|---|
| 1 | 11.4 | 33.5 | 33.5 |
| 2 | 3.4 | 10.1 | 43.6 |
| 3 | 2.2 | 6.4 | 49.9 |
| 4 | 1.8 | 5.3 | 55.3 |
Source: Self-elaboration.
Regarding the analysis of the saturation matrix, our results show the correlations between the 34 variables (Table 3).
Table 3 Component matrix
| Indicators | Factors / Components | |||
|---|---|---|---|---|
| 1 | 2 | 3 | 4 | |
| Illiteracy rate | -.770 | .037 | -.261 | -.119 |
| Population with the 1st Cycle of Basic Education | -.811 | -.120 | .087 | -.007 |
| Population with secondary education | .875 | .041 | -.138 | .095 |
| Population with higher education | .790 | .326 | -.199 | -.198 |
| Population aged between 6 and 15 years old who is not attending the education system | .170 | .195 | .091 | .301 |
| Population aged between 18 and 24 years of age with the 3rd Cycle of Basic Education who is not attending the education system | -.665 | .064 | .417 | -.050 |
| Population aged 15 years old and over with no complete education level | -.850 | .010 | -.134 | -.125 |
| Early school leaving rate | -.597 | .062 | .508 | .020 |
| Population variation rate | .682 | -.297 | .069 | .116 |
| Birth rate | .580 | -.105 | .191 | .012 |
| Population density | .423 | .747 | -.060 | -.102 |
| Aging index | -.716 | .217 | -.424 | -.147 |
| Foreign nationality population | -.097 | .312 | .423 | -.325 |
| Population aged 14 years or less | .730 | -.265 | .402 | .190 |
| Single-parent family | .446 | .545 | .123 | .015 |
| Public transport | -.573 | .120 | -.008 | .374 |
| Car Transport | .542 | -.502 | .056 | -.108 |
| Average commuting duration | -.196 | -.096 | -.524 | .270 |
| Companies | .134 | .747 | .122 | -.058 |
| Activity rate | .906 | -.151 | .136 | .157 |
| Total unemployment rate | -.234 | .543 | -.052 | .484 |
| Youth unemployment rate | .164 | .261 | -.180 | .358 |
| Socially more valued professionals | .759 | .378 | -.152 | -.286 |
| Population employed in the agricultural, fishing and forestry sectors | -.501 | -.056 | .295 | -.334 |
| Representatives of the legislative and executive, directors, officers and executive managers | .348 | .220 | .218 | -.289 |
| Unskilled workers | -.511 | -.018 | -.101 | .304 |
| Employed population in industry | -.560 | -.252 | .418 | .101 |
| Beneficiaries of unemployment benefit | .220 | -.007 | .253 | .619 |
| Beneficiaries of social insertion income | -.021 | .727 | .282 | .180 |
| Resident population with at least one difficulty | -.789 | .164 | -.171 | -.030 |
| Rundown buildings | -.240 | .173 | .010 | -.153 |
| Accommodations without at least one basic infrastructure | -.574 | .151 | .206 | .133 |
| Average monthly expenses for house purchase | .644 | -.036 | -.275 | .022 |
| Average monthly rent for classic family accommodation leased | .615 | -.041 | .127 | -.081 |
Source: Self-elaboration.
Thus, factor 1 shows greater correlations among the resident population, secondary and higher education, population variation rate, birth rate, the population under 14 years of age, the use of cars in commuting, activity rate, individuals with socially valued professions, expenses for own housing and the value of rented accommodations. These indicators are associated with areas with greater urbanity, with a population with higher professional skill and greater economic dynamism. In factor 2, the positive correlations with population density, single-parent families, foreign populations, the number of companies per 1000 inhabitants, unemployment rate, socially valued professionals and beneficiaries of social insertion income stand out. This factor finds greater expression in territories with some economic dynamism, though niches of social vulnerability remain. In factor 3, positive associations fall into variables such as: the population aged between 18 and 24 years old with the 3rd CEB who does not attend the education system, the rate of early school leaving, the population of foreign nationality, the population employed in agriculture, the population employed in the secondary sector, beneficiaries of unemployment benefits, beneficiaries of social insertion income and housing without at least one basic infrastructure. This factor reflects territories with socioeconomic weaknesses, material deprivation and early school leaving. Factor 4 indicates greater associations with the variables: population aged between 6 to 15 years old who does not attend the education system, use of public transport, duration of commuting, total and youth unemployment rates, unskilled workers and unemployment benefit recipients. This indicator reflects territories of low professional skill, early school leaving and unemployment.
We applied the hierarchical ascending classification methodology to these four factors. We chose a classification limited to five clusters whose behaviour would be similar.
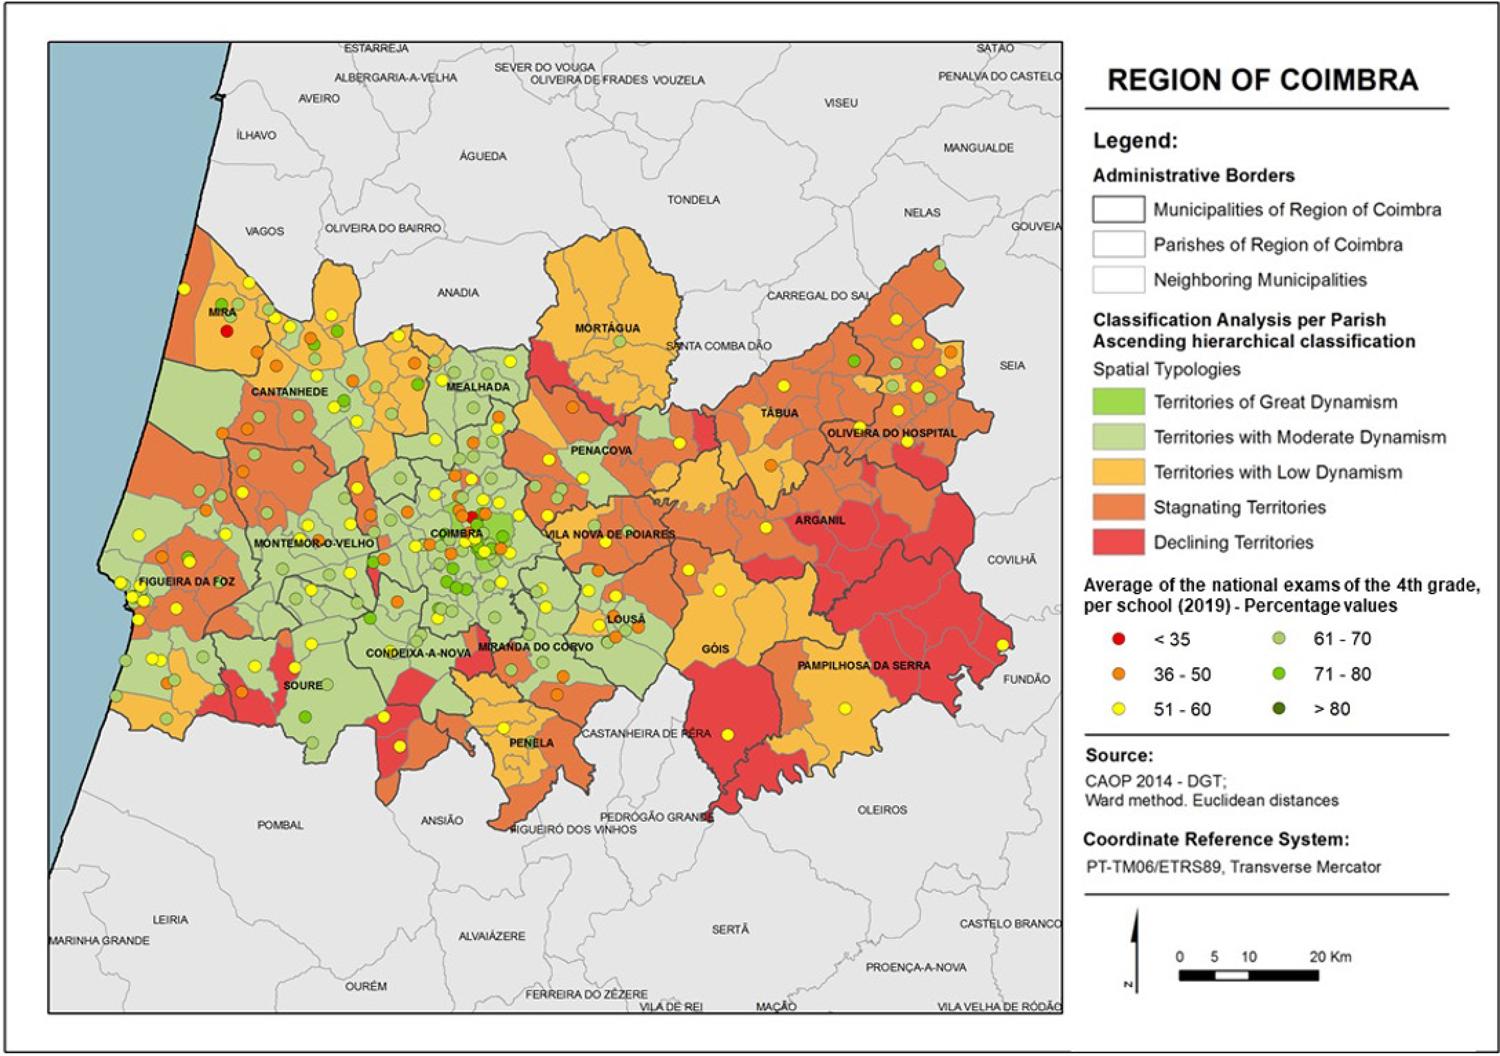
In this context, we find five clusters – Territories with great dynamism, Territories with moderate dynamism, Territories with low dynamism, Stagnating territories and Declining territories (cf. Table 4 and Figure 2).
Table 4 Main characteristics of territorial clusters
| Territories with great dynamism |
| Cluster formed by a small number of parishes, mostly in the urban centres of the more urbanised municipalities of CIM (Coimbra and Figueira da Foz). This urban nature is reflected in high population densities. The cluster has a significant share of foreign population, and the weight of one-parent families is important. In terms of educational indicators, we highlight its low illiteracy rates and medium to high levels of schooling. In relation to economic dynamism, activity rates are higher than the average of the 19 municipalities; there is a high density of businesses and a large number of individuals with socially valued jobs. |
| Territories with moderate dynamism |
| Sectors which have shown an increase in population over the last decade, with lower aging rates than most of the other parishes under study. These territories occupy a positive position due to the weight of individuals with higher education and early school leaving rates below the supra-municipality rates. Regarding economic dynamics, they are also well placed in terms of activity rates and of individuals working in socially valued jobs. Even so, unemployment rates are fairly high, especially in the youth bracket, as these territories show the greatest activity and economic dynamism, which ultimately reflect, to a greater extent, the effects triggered by the economic crisis. |
| Territories with low dynamism |
| This cluster includes some markedly rural territories characterised by the loss of the resident population, low population densities and the gradual aging of the population. In terms of schooling, a significant number of individuals have completed only the 1st cycle of basic education and the weight of individuals in the 18-24 age bracket with the 3rd cycle of basic education who are not attending school is high, associated to high early school leaving rates. Secondary sector workers and non-qualified workers are also quite significant. |
| Stagnating territories |
| This cluster consists of parishes which are mostly located in the eastern sector of the CIM and are part of the municipalities of Tábua, Arganil and Oliveira do Hospital and some parishes of the municipalities of Vila Nova de Poiares, Montemor-o-Velho and Figueira da Foz. This latter group is characterised by low population densities and an aging demographic structure. In general, we note the low levels of schooling of the resident population, with a significant share of the population having completed only the 1st cycle of basic education, i.e., the rate of the population with high schooling levels is not quite expressive. Early school leaving rates are quite relevant, especially in the eastern sector parishes. As regards to economic activity, we highlight the population employed in industry but also, in some cases, in agriculture. |
| Declining territories |
| Group of parishes showing unfavourable values in a number of socioeconomic variables. These are low population density territories showing a decreasing trend, i.e., low birth rates and a very old population structure. The schooling dimension is associated to high illiteracy rates and most of the resident population has completed only the 1st basic education cycle. The professional skill profile of this population is not quite positive due to the large number of individuals aged 15 years old or above lacking any educational attainment and those aged between 18 and 24 years old which have completed the 3rd basic education cycle but are not attending school. Moreover, early school leaving rates are very high, and activity rates are very low, accompanied by high unemployment rates, especially among the youth. |
Source: Self-elaboration.
Academic failure: some comments about school results and their spatial distribution
The analysis of 4th-year national grades shows a scattered pattern of averages, although some sectors of the territory suggest strong academic failure indicators8 given their lower common values, reflecting, in many cases, the escalation observed in the 1st basic education cycle in the period after the onset of the 2009 economic crisis (ALVÁRES; CALADO, 2014).
The analysis of the number of exams with negative grades, side-by-side with the study of the averages, shows some typologies in the distribution of results. One the one hand, negative grades seem to be concentrated in some rural areas of low population density shown in geographical continuity, in which socioeconomic and cultural characteristics may somewhat influence the definition of the students’ school paths (e.g., in the eastern sector of the Coimbra Region CIM). Rurality also appears in small pockets close to the cities, associated to isolated cases of students with negative grades (e.g., in the municipality of Soure) but the weight of ‘cultural capital’ in academic success is more difficult to understand.
The least expectable sector, very much due to the fact that it is located on the coastline, concerns the northeast rural sector of the Coimbra Region CIM (Mira, west of Cantanhede and north of Figueira da Foz - Gândara), corresponding to low-dynamism or even stagnating territories, in which schools show negative average grades; in one case even below 35% (cf. Figure 2).
On the other hand, the northern sector of the municipality of Coimbra (18 schools) reflects a problematic environment resulting from, among others, the fact that it is part of a former industrial area, covering a number of parishes to the western part of the sector, whose exam results are, in general, below 50% (Table 5), despite its moderate socioeconomic dynamics.
Table 5 Results of 4th year national exams (2014) in the municipalities of the Coimbra Region CIM: exams with grades equal to or less than 35%, equal to or less than 50% and equal to or less than 80%
| Municipalities of the Coimbra Region CIM | Exams with grades | Exams | |||||
|---|---|---|---|---|---|---|---|
| = or < 35% | = or < 50% | = or > 80% | |||||
| no. | % | no. | % | no. | % | no. | |
| Mortágua | 5 | 4.5 | 14 | 12.7 | 22 | 20.0 | 110 |
| Penela | 2 | 3.3 | 9 | 15.0 | 8 | 13.3 | 60 |
| Coimbra | 227 | 8.9 | 521 | 20.5 | 694 | 27.4 | 2537 |
| Vila Nova de Poiares | 10 | 8.0 | 30 | 24.0 | 15 | 12.0 | 125 |
| Condeixa-a-Nova | 21 | 7.7 | 67 | 24.6 | 71 | 26.1 | 272 |
| Mealhada | 20 | 6.8 | 83 | 28.0 | 46 | 15.5 | 296 |
| Figueira da Foz | 116 | 11.4 | 292 | 28.6 | 159 | 15.6 | 1021 |
| Soure | 24 | 9.0 | 80 | 30.1 | 27 | 10.2 | 266 |
| Oliveira do Hospital | 50 | 14.5 | 104 | 30.1 | 38 | 11.0 | 345 |
| Tábua | 30 | 15.1 | 60 | 30.2 | 34 | 17.1 | 199 |
| Cantanhede | 85 | 13.2 | 204 | 31.6 | 109 | 16.9 | 646 |
| Arganil | 30 | 18.5 | 52 | 32.1 | 18 | 11.1 | 162 |
| Miranda do Corvo | 19 | 11.5 | 54 | 32.7 | 19 | 11.5 | 165 |
| Montemor-o-Velho | 62 | 16.9 | 128 | 35.0 | 50 | 13.7 | 366 |
| Lousã | 45 | 14.9 | 111 | 36.6 | 36 | 11.9 | 303 |
| Pampilhosa da Serra | 7 | 17.5 | 15 | 37.5 | 2 | 5.0 | 40 |
| Góis | 13 | 24.5 | 20 | 37.7 | 8 | 15.1 | 53 |
| Mira | 34 | 19.5 | 67 | 38.5 | 25 | 14.4 | 174 |
| Penacova | 25 | 14.0 | 70 | 39.1 | 15 | 8.4 | 179 |
| Coimbra Region | 825 | 11.3 | 1981 | 27.1 | 1396 | 19.1 | 7319 |
Source: Self-elaboration.
The more positive grades (more than 80%) are more scattered across the 19 municipalities, more concentrated in the central and southern areas of the municipality of Coimbra and spreading to the neighbouring municipalities, in particular towards the western sector of the Community.
To analyse the relation between territorial clusters and students’ grades, a boxplot was created with some schools located in each of the clusters (Figure 3).
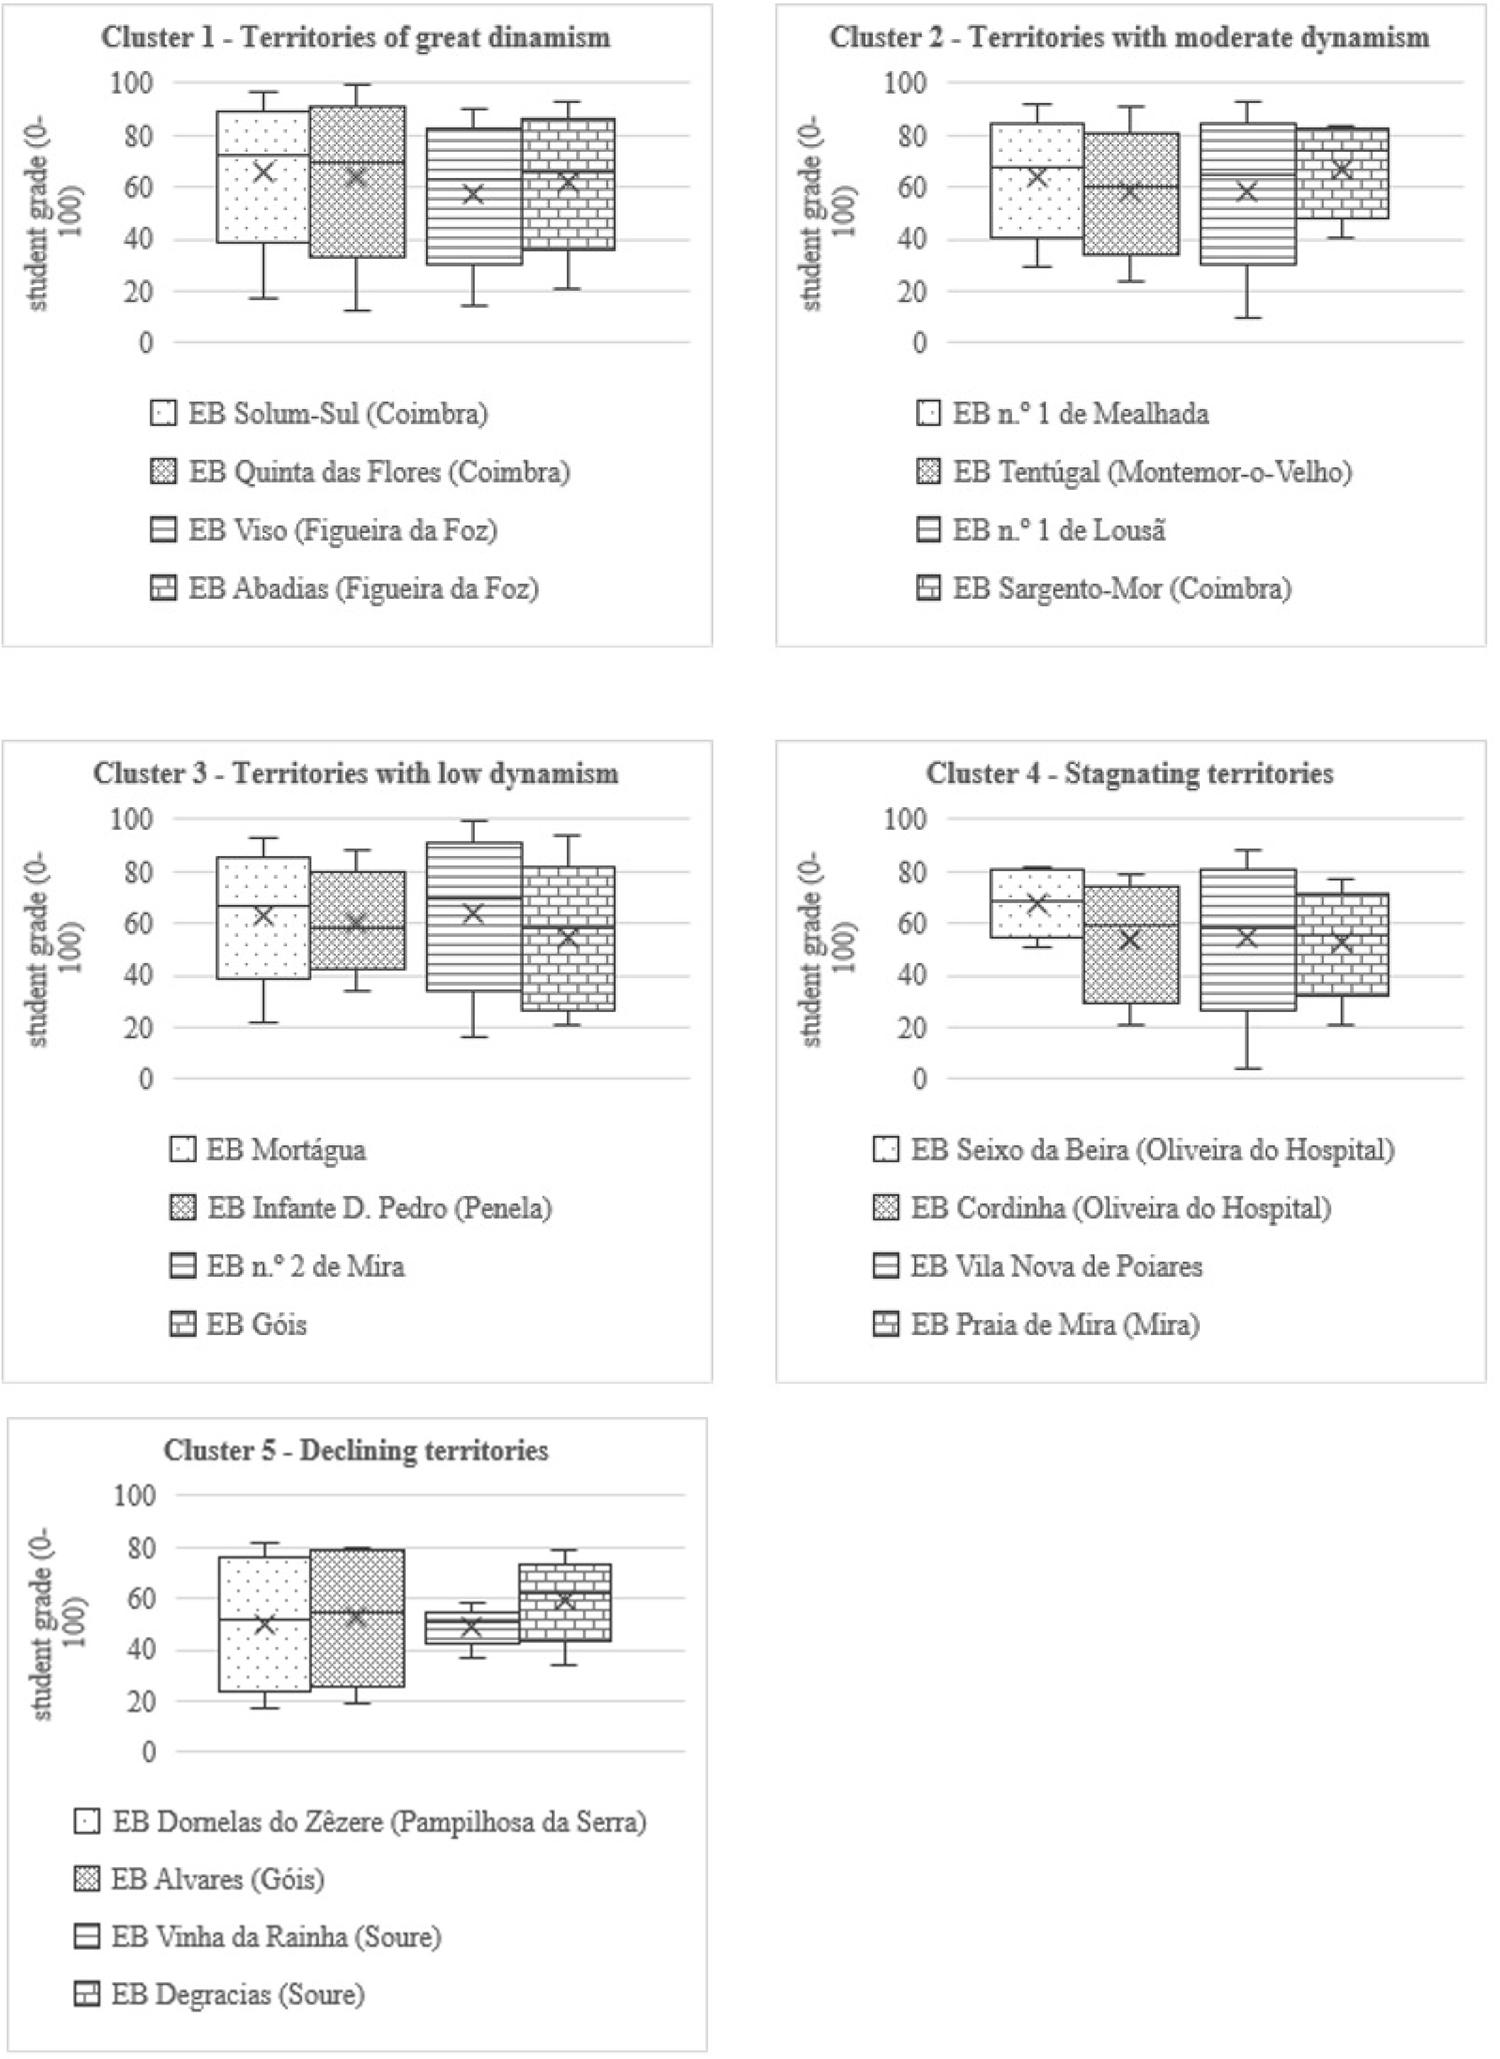
It becomes evident that schools located in clusters 1 and 2 show higher averages (above 60%) than those schools in less dynamic clusters (clusters 3, 4 and 5), with values generally below 60%.
We note that medians, as well as maximum values, are higher in the case of schools located in the most dynamic territories. There are no significant differences in the case of minimum values.
The overall results show a clear association between the most dynamic urban territories and the best school results. Moreover, we observed that less dense and dynamic territories have schools with worse performances, although there may be, in these territories, schools which stand out positively.
Moreover, the analysis of internal assessment grades shows which values are distributed more similarly, with averages higher than those of exams. On the scale used – 0 to 5 –, the average of about 30% of schools was equal to or higher than a score of 4 and that of 81% was equal to or higher than 3.5. The reason for this is that the internal assessment grade consists of a number of broader and sometimes different criteria between schools and is not limited to a concrete, one-off test moment in time. We found that the average of exams was equal to that of the internal assessment average in only four schools and that the internal assessment grades were higher than those of exams in more than 95% schools (cf. Table 6).
Table 6 Relations between the average of exams and the average of internal assessment in schools
Source: Self-elaboration.
The analysis between results and territories limited to the schools with negative exam averages is likely to result in us underestimating exam results compared to internal assessment grades, seeing that, with respect to the latter, only one school showed the same average for the two types of results. The averages of the remaining schools were lower in exams compared to the test grades (38 schools), with a great number of cases showing differences between 0.6 and 2.
Territories as possible predictors
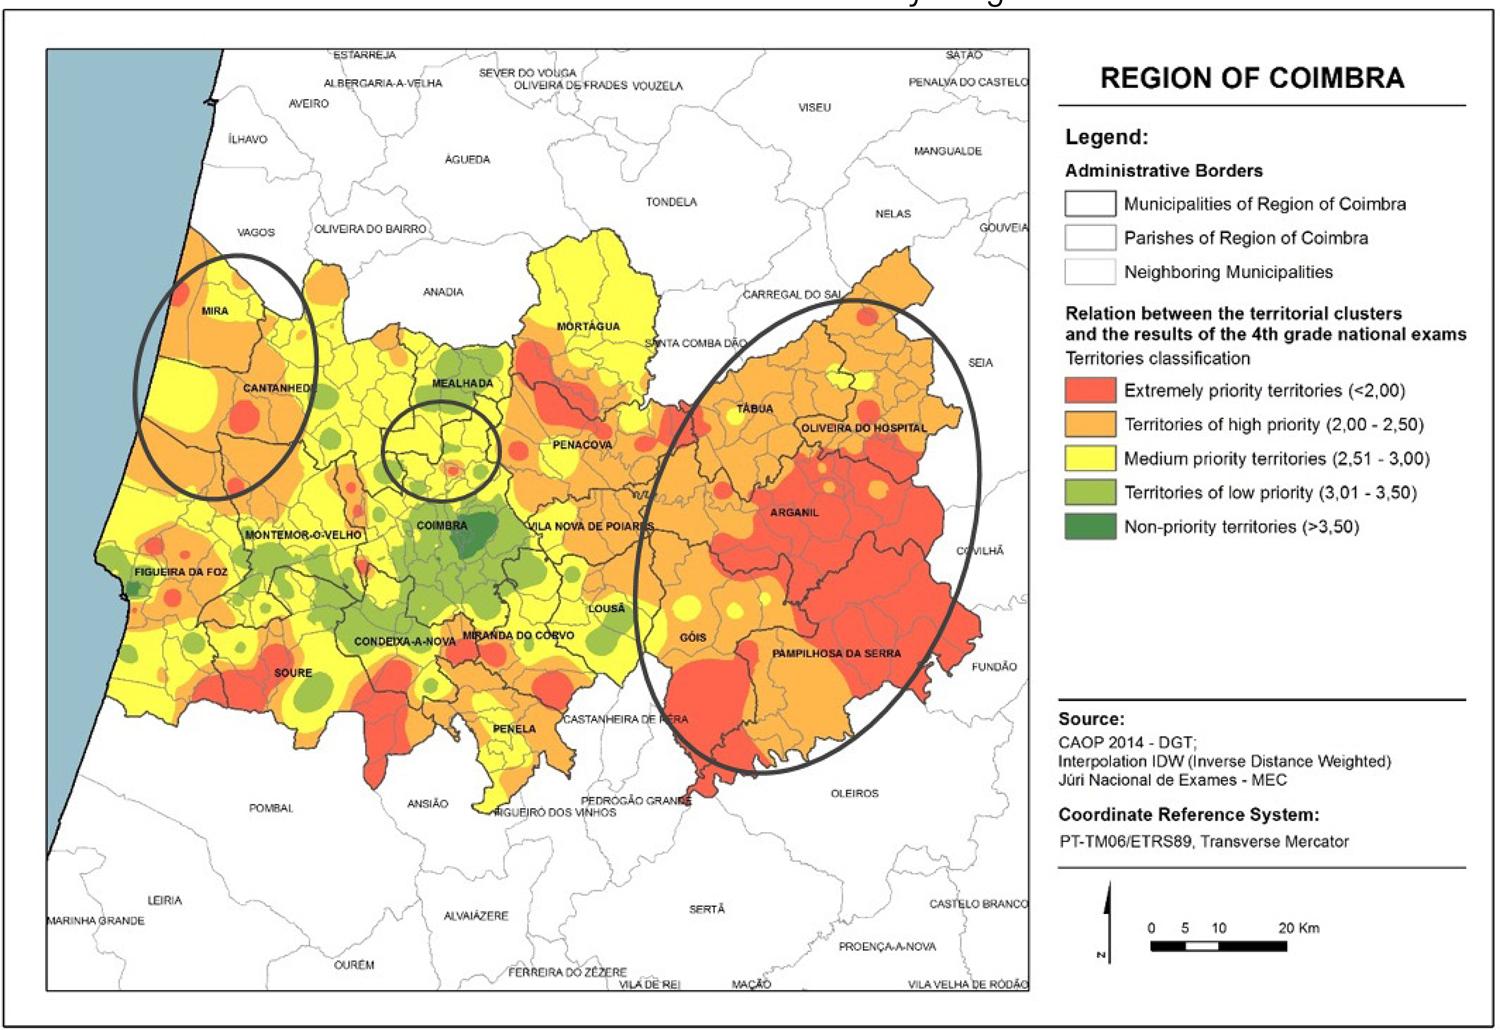
One of the aims of this study was to find relations in the cross-check of the two previous analyses in which we could detect any area in which territorial dynamism was associated to good school attainment or (and in line with the purpose of the study) basically the opposite – declining territories with high academic failure rates, aiming to prepare an action plan to mitigate the problem. Territories with great and moderate dynamism are usually associated to schools with top national exam averages (some of which are even the best in the nation), whereas, in some cases, this is precisely the opposite – declining or stagnating territories with negative school grades –, in particular the north and northwest sectors of Coimbra, the northwest of the Coimbra Region CIM and the territory in its eastern sector (cf. Figure 4).
Source: Self-elaboration.
Figure 4 Relation between the territorial clusters and the 4th year grades in national exams
The analysis of the territories with low dynamism shows some cases in which this relation tallies. For example, the schools within the northwest coastal sector of the Coimbra Region CIM, situated in territories with a strong agricultural component, poorly qualified population and some aging indicators (inter alia), reflected in a large number of schools with negative grades in the national exams9.
In another context, the peri-urban sectors with great social diversity reflect intense mobility flows, showing that not all students attending schools in those areas actually live there and that not all local development actors are permanently or totally affiliated to the places. In these cases, school results in territories with moderate dynamism (influenced by economic factors) are mostly negative (reflecting the social environment of resident families). A telling example of this disparity is the parishes to the north and northwest of the municipality of Coimbra, in which the business dimension does not tally with students’ academic paths. This is mostly due to the presence of more disadvantaged social groups (e.g., the Roma population) who are partly or totally detached from other residents.
Finally, we should note the eastern sector of the Coimbra Region CIM, mostly defined by stagnating or declining territories with some relatively positive results in the 4thyear national exam averages but with a significant number of negative exam grades (cf. Table 2). This could be explained by its smaller number of students, allowing teachers to focus more on each student, and, most of all, by the concentration of students in municipal schools (one or two in every territory), in which, even with a high percentage of negative exam grades, the average per school is above 50%.
More objectively, IDW interpolation allows us to identify not only these top priority areas (with which some occasional sectors in the territories are associated) but also those with positive values, showing, in these cases, successful territories in which the same school curricula must cater for different strategies. As mentioned, this method can promote the relations between the aforementioned variables, providing the criteria for the implementation of support to the programme to fight against academic failure in this vast territory.
Discussion
In view of this robust and conceptually and methodologically diverse set of data, we conclude that children and young people are not destined to be good or bad students, that is, the environment cannot predispose them thus ‘by itself’. However, in reality, the impact of the environment, especially the academic environment, is reflected in the academic success of students, which is why teaching and learning dynamics within the school (and not only within the classroom) are essential to mitigate these shortcomings in a concerted and successful manner. In the case of the Coimbra Region CIM, the analysis of academic success and failure is, therefore, particularly relevant and innovative when it includes the territorial component. Seeing how the socioeconomic structure underlying the educational system and the daily spaces of students can contribute to establish relations between school paths and ‘cultural capital’.
Although our research was limited to academic results (exam and internal assessment grades), it does give us some leads on effective relations. It would, therefore, be important to understand how the school results variable behaved in territories with similar characteristics. The fact that there is no clear relation between the two dimensions makes it essential to bring in new indicators to achieve a more real reading of students, schools and of the environment in which they are located and to devise strategies to overcome academic failure. In fact, while in some territories with low dynamism or in stagnating territories school grades are low (as expected), in others with identical characteristics the grades are slightly more positive, which seems to show that we must consider other important factors.
We must emphasise the issues related to student mobility, as these children may not attend schools in their area of residence. In some cases, students do not reflect the contexts of the territories in which they live and internalise the spaces in which they spend their days. The same situation can be seen in the case of ‘cluster-schools’, which, by bringing together in one single school children from different territorial realities (e.g., the eastern sector of the Coimbra Region CIM), makes it difficult to distinguish the relation between the two variables.
Conclusion and future research
The study of the relations between academic success and territories is very complex, which is why we sought to find new ways of studying them, one of which is statistically based spacialisation and its application on maps, an extremely valid and innovative method.
In addition to requiring the analysis of a diverse set of variables, results very much depend on the psychosocial characteristics of students, the stimuli which teachers can trigger and the organisational and pedagogical dynamics of the schools themselves.
On the other hand, even though we confirmed that territories with greater infrastructure, denser knowledge and social, cultural and organizational networks are more conducive to school success, we also found that some more circumscribed territorial spaces without very developed local organizations show positive student performance results.
Regarding the factors external to the functioning of the educational system, especially economic, social and political dimensions, as has been underlined in studies on this theme (BREAKSPEAR, 2012; CARNEIRO, 2008; HERBAUT, 2011), this study shows, one the one hand, the strong relation of success with the socioeconomic environment in which the school is located, but on the other hand, it also shows that, in some specific and defined areas, the political options, in particular the TEIP initiative [Priority Intervention Territories] can promote the success of a school.
In any case, even though the complexity of the study of this theme and of the relations it presents and calls for, when analyzed from local realities, is reinforced, it fails to devalue the territory as an important variable to analyse academic success and failure. It also calls for further in-depth analyses which associate territory to other variables, which will lead to new investigations which will surely contribute towards further and better clarification and, consequently, better interventions.

