


Serviços Personalizados
Journal

Artigo
 texto em
  Inglês (pdf)
 Artigo em XML
 Enviar este artigo por email
Compartilhar

 Permalink
Educação e Pesquisa
versão impressa ISSN 1517-9702versão On-line ISSN 1678-4634
Educ. Pesqui. vol.48 São Paulo 2022 Epub 21-Set-2022
https://doi.org/10.1590/s1678-4634202248241713por
ARTICLES
Does the structure of the test affect the performance of students? Evidences from the Enem (2016)* 1

2- Instituto Federal de Educação, Ciência e Tecnologia de São Paulo, Jundiaí, SP, Brazil. Contact: leonardo.barichello@ifsp.edu.br
3- Universidade Estadual de Campinas, Campinas, SP, Brazil. Contact: guimaraes.rita@gmail.com
4- Universidade Federal de Pernambuco, Recife, PE, Brazil. Contact: dalson.figueiredofo@ufpe.br
This paper analyzes the impact of the position of questions on students’ performance on the National Secondary Education Examination (Enem) in 2016. From a sample of 4,427,790 cases, we calculated the hit rate per question for the different workbooks in the Mathematics and its Technologies test. The results indicate presence of the fatigue effect on the 2016 Enem, that is, the order in which the questions are presented affects the proportion of correct answers, which is diminished as an item is presented closer to the end of the test. The exploratory evidence also suggests that the fatigue effect is manifested in students of both low and high performance. For example, the position of an item reduced the hit rate up to 18%, controlling for performance level. This paper conducts the first empirical evaluation of the fatigue effect during the Enem. The results contribute to the literature on the non-cognitive influences in evaluation, being useful to substantiate more systematic studies on the fatigue effect’s impact on large-scale standardized tests, beyond the case analyzed. At the end, we suggest measures that can mitigate this effect during the Enem.
Key words: Fatigue effect; Standardized tests; Enem; Microdata; Educational performance
Este artigo analisa o impacto da posição em que as questões são apresentadas sobre o desempenho dos estudantes no Exame Nacional do Ensino Médio (Enem) no Brasil em 2016. A partir de uma amostra de 4.427.790 casos, calculamos o índice de acerto por questão para os diferentes cadernos de prova da área de Matemática e suas Tecnologias. Os resultados indicam a presença do efeito fadiga na prova do Enem 2016, ou seja, a ordem de apresentação das questões afeta a proporção de respostas corretas, que diminui à medida que o item é apresentado mais próximo do final da prova. As evidências exploratórias também sugerem que o efeito fadiga se manifesta tanto em estudantes de baixo quanto de alto desempenho. Por exemplo, a posição do item reduziu o índice de acerto em até 18 pontos percentuais, controlando pelo nível de desempenho. Este artigo faz a primeira avaliação empírica do efeito fadiga no Enem e os resultados representam uma contribuição para a literatura sobre influências não cognitivas em avaliação e são úteis para fundamentar estudos mais sistemáticos sobre o impacto do efeito fadiga em testes padronizados de larga escala, inclusive para além do caso específico analisado. Ao final, sugerimos medidas que podem mitigar esse efeito no Enem.
Palavras-Chave: Efeito fadiga; Testes padronizados; Enem; Microdados; Desempenho educacional
Introduction
Adequate time management is frequently highlighted as an important factor to explain performance in large-scale standardized tests (RODRIGUES, 2007; WOYCIEKOSKI; HUTZ, 2009). Specifically, both anxiety and the absence of specific strategies for solving questions are elements that can negatively affect the candidate’s overall performance (GONZAGA; ENUMO, 2018). In Brazil, for example, over the days prior to the National Secondary Education Examination (Enem), effective time management is a recurring theme for news sites, blogs, and even in the questions and answers section of the National Institute for Educational Studies and Research (Inep)5.
On the Enem’s first day, candidates must answer, in four hours and thirty minutes, 90 multiple choice questions, half on Humanities and its Technologies and half on Natural Sciences and its Technologies. This means that, on average, each question must be solved in three minutes. On the second day, in addition to the 90 questions, this time on Languages, Codes, and its Technologies and Mathematics and its Technologies, there is an essay and an added thirty minutes to the maximum amount of test time. Strategies to not invest too much time on questions that might be beyond the candidate’s ability and to not spend too much time at the beginning of the test, losing the chance to get right some easy question that might be at the end of it, are important and can be improved with guidance and practice.
Sassaki et al. (2018) analyzed the influence of non-cognitive factors (such as tiredness and question placement) on the performance of students on the Programme for International Student Assessment (Pisa)6. The authors examined the difference in performance on the same question that, for reasons of test randomization, was presented to students at different points. Specifically, the students solve four question sections (each with an estimated duration of 30 minutes), composed of the same set of questions, although with an order defined at random. Thus, a student may begin the test with a question, but another may receive that same question at the end of the section. The results indicate that a question’s hit rate falls as an item is presented later. And, comparatively, Brazilian students are more susceptible to that effect.
The first result obtained by Sassaki et al. (2018) is reported in the international psychometric literature as fatigue effect or test fatigue, and has been identified in different evaluations that randomize (at least partially) the order of questions presented to candidates (ALBANO, 2013; BORGHANS; SCHILS, 2012; DAVIS; FERDOUS, 2005; MEYERS; MILLER; WAY 2008)7. This paper aims to contribute to this debate with an exploratory analysis of the fatigue effect on the main large-scale standardized test in Brazil. With a sample of 4.427.790 cases, we examined the percentage variation of correct answers per question and per type of test, focusing on Mathematics and its Technologies in the 2016 Enem. The choice of this exam is especially relevant, since Brazilian students were the most susceptible to the fatigue effect among all the participants of the 2015 edition of Pisa, as reported by Sassaki et al. (2018).
Schematically, the remainder of the paper is organized in four parts. The next section discusses studies that investigated if and how fatigue may affect the performance of students in standardized tests. Subsequently, we present the main characteristics of the research design, aiming to increase transparency and ensure replicability of results. In particular, we explain the data collection process and treatment and describe how the questions on the Enem are ordered. Then we present the exploratory analysis and, in the final section, the conclusions.
Fatigue effect and performance in standardized tests
Since the 1980s there has been an increase in the use of large-scale evaluations in Brazil (ALAVARSE, 2013). Overall, these evaluations are of an exclusively additive nature, that is, they are used to select and certify students or for the accountability of educational systems (NEVO, 2011). Examples of these evaluations in the Brazilian context are the Enem, Prova Brasil, the Saeb (National Basic Education Assessment System), and the Enade (National Assessment of Student Achievement – it evaluates the performance of students graduating from their bachelor’s degrees).
The number of participants in these evaluations excludes several methodologies that could be used in those processes and imposes other characteristics due to the difficult logistics in their implementation, including elaboration, administration, and correction (BAUER; ALAVARSE; OLIVEIRA, 2015). Thus, it is common that large-scale evaluations are composed of close-ended questions, guided by a well-defined list of abilities or contents, and administered in highly-controlled contexts.
Even with these restrictions, these evaluations aim to verify students’ knowledge, that is, it is expected that each student’s result is a reflection of their cognitive abilities. However, even advocates of the methods employed in large-scale evaluations recognize that non-cognitive factors interfere in the measurement obtained by this type of instrument. For example, Borghans, Meijers and Ter Weel (2008) show that personality traits, such as intrinsic motivation and low aversion to risk, influence performance when variables such as time restriction and reward are modified.
David and Ferdous (2005) tested if there was a difference in the performance of American students aged between 10 and 12 on questions as they appeared in different places in an evaluation. According to the authors, the hypothesis implicitly adopted by designers of this type of evaluation is the position of a question does not influence the test’s overall difficulty. However, when determining the difficulty of the questions using Item-Response Theory (IRT) on different workbooks of an evaluation (composed of the same questions, but in different orders), the authors found significant differences, in that the closer to the beginning, the easier the question is.
Meyers, Miller and Way (2008) and Albano (2013) identified the same effect in other contexts. However, the authors went beyond measuring impact and proposed models that incorporate that effect to the performance calculation, following the IRT approach. That is, they proposed models that consider the position in which a question was presented to the participants as one of its parameters.
In the Pisa technical report conducted in 2000, Adams and Wu (2002) identified a difference in the difficulty level registered for a question when it is presented at different times in the evaluation. The difference is significant to the point that a correction factor was applied to obtain the final grade for each country. Although the authors did not explicitly relate that difference to the fatigue effect, the phenomenon seems to be related to it. More recently, Borghans and Schils (2012), when analyzing data from subsequent editions of the Pisa, reported the same effect highlighted by Davis and Ferdous (2005): students’ performance falls as the same question is presented later in an evaluation, regardless of the item’s difficulty level.
In a similar work, Marchioni (2017) investigated the fatigue effect in the Pisa and the results indicate that fatigue affects South American students more so than students from other countries. It is relevant to complement this observation with information already present in the Pisa technical report (2000). Comparatively, the authors conclude that the variation in a question’s difficulty is “very stable” (ADAMS; WU, 2002, p. 157) when the countries participating are considered. Nevertheless, Brazil appears in first place in average number questions that the students did not even try to answer.
Sassaki et al. (2018) examined data from the 2015 Pisa edition, focusing on the fatigue effect. The research design benefitted from detailed information thanks to the digital administration of the evaluation to a subset of students. The conclusion was that indeed, Brazilians are more affected by the fatigue effect than students from other countries, both from high performing and from countries with performance similar to our own.
The interference of this type of variable raises important questions, especially at a time when large-scale evaluations have been used at several levels and with purposes of great social relevance, such as the selection of students for university as is the case of the Enem, focus of this paper.
Research on the Enem
The Enem was created in 1998 with the goal of assessing the quality of learning at the secondary level. In 1999, it began being used as criterion for tertiary level entry, and in 2008 was reformulated substantially, being then founded on principles of Item-Response Theory, to serve as main access mechanism to several universities, including the majority of the country’s federal institutions (TRAVITZKI, 2017). The Enem is conducted yearly, and the content of the test is divided over two days. Currently, the results can also be used to gain entry to some international universities, scholarships to private universities, and as a criterion for a secondary level graduation diploma8.
Since 1998, the data generated from the test, containing not only the responses, but also detailed participant information such as socioeconomic and geographical indicators, school trajectory, among others, are publicly available as microdata on the Inep’s website.
Analytically, the disaggregated nature of the information offers a unique opportunity to investigate large-scale phenomena related to the end-stage of Basic Education in Brazil. Travitzki (2017), for example, used the microdata from the 2009 and 2011 editions to construct a reliability assessment goal for the tests, employing the same techniques that base the Enem’s elaboration. The author concluded that the 2009 Mathematics test presented insufficient reliability and several questions demonstrated unexpected empirical behavior in both editions.
Nonetheless, the effective use of microdata in applied research, whether that is for an assessment goal of the test or for an investigation of other phenomena, is still reduced. A search conducted in January 2020 in the Scielo portal using the terms “enem” and “microdata” returns only four papers, and none discuss similar topics to the ones we have proposed to explore in this work.
Lima et al. (2019) present a systematic literature review of papers that use the data provided by the Inep regarding the Enem and the ENADE. With the aid of Google Scholar (https://scholar.google.com), having a wider scope than Scielo, Lima et al. (2019) reached a set of 54 works, published between 2005 and 2016, with 17 of these referring to the Enem. They were grouped into four categories according to the nature of their goals: content/knowledge, administrative, performance/achievement, and test/develop tools.
The papers in the first group investigated aspects related to the content in the Enem’s questions. The ones in the second group focused on aspects connected to management and access. Papers in the third group investigated the performance of specific groups or the relationship between performance with other variables. Lastly, papers in the fourth group emphasized the development of tools or methodologies that facilitate the interpretation and use of available information in the microdata.
Despite the papers in the third group having examined aspects related to students’ performance, the focus was to analyze and compare the performance of students according to some geographical or socioeconomic variable. Therefore, none of the articles analyzed by Lima et al. (2019) discuss similar themes to the one in this paper.
The paper presented by Toffoli (2019), published after Lima et al.’s review (2019), comes closer to ours regarding the potential to contribute to the Enem’s improvement as a selection exam. According to the author,
Studies on large-scale evaluations are important to identify stages in the process that are not working as expected as well as to validate the steps with adequate results. In both cases, the aim of studies must be the improvement of the process at each edition of the exam. (TOFFOLI, 2019, p. 4. Our translation).
Toffoli (2019) analyzes the psychometric qualities of each question and of the test as a whole. Her conclusions are extremely concerning, given that the Enem’s results are more than just simple measurements and have very relevant social consequences (TOFFOLI et al., 2016). Their results may be synthesized in the following statement:
In the 2015 Enem Mathematics test, the easiest item obtained the difficulty parameter at b = -1,98, and approximately 23,4% of participants have abilities lower than that level, indicating that these individuals could not answer any among the 45 items, only getting items correct by chance. (TOFFOLI, 2019, p. 21. Our translation.).
In her study, Toffoli (2019) considered only the answers from one of the Enem’s workbooks, that is, it would be impossible to notice the fatigue effect when analyzing her data.
Travitzki (2017) comes closer to our object of study when discussing his results. The author points out the presence of several questions in the 2009 and 2011 editions of the Enem that would have been considered inadequate according to criteria from Classical Test Theory and observes that a good portion of them were concentrated at the end of the test. The author offers two tentative explanations for this phenomenon:
One possible explanation is that previous items demanded too much work, leading candidates to greater mental exhaustion (or less available time) at the end of the test. Another possible explanation, not-exclusive, is that a good portion of the students may have not done the questions because they considered them too difficult, being thus more productive to invest the time for the test on other items. (TRAVITZKI, 2017, p. 281. Our translation).
Note that the author does not discuss fatigue effect itself, but suggests that tiredness may affect participants’ performance in questions presented at the end of the test, to the point that they may be considered of dubious quality in psychometric terms.
The caveats expressed by Toffoli (2019) regarding the Enem, in conjunction with its great social relevance (TOFFOLI et al., 2016), reveal the importance that the exam is place under scrutiny. Although it was not the main focus of his analysis, the explanations suggested by Travitzki (2017) already single out the relevance of considering the position of questions on the Enem when analyzing the test’s psychometric quality. In addition, the conclusion by Sassaki et al. (2018), that Brazilian students are more susceptible to the variation of the position of questions than students from other countries, although observed in the new Pisa test, further reinforce the relevance of analyzing the fatigue effect on a test such as the Enem. Lastly, the dearth of studies identified in this review accentuate the unprecedented nature of this paper’s focus.
Methodology
Our exclusive source of information was the microdata from the 2016 Enem; more specifically, the data regarding the Mathematics and its Technologies test9. The choice to restrict the year and content is justified by two motives: computational difficulties in manipulating massive datasets and the exploratory nature of the work.
When it comes to computational difficulties, the initial extraction returned a spreadsheet with 8.627.368 lines, which not only makes the use of popular software such as Microsoft Excel10, unfeasible, also presents challenges in software for statistical analysis for research in computers with market configurations (8 GB of RAM).
Regarding the exploratory aspect of the study, the option for Mathematics and its Technologies is justified by the first two authors’ affinity with the field, both in relation to pedagogical practice and in their specific research agenda on the field of education in Mathematics. The year of 2016 was chosen due to it being the most current available dataset when the first ideas for this paper were discussed by the authors.
Question order in the Enem’s workbooks
The Enem is composed of four workbooks (visually differentiated by color) with the same questions but presented in different order. Figure 1 shows the first page of the Mathematics and its Technologies test for each of the four workbooks in the main application in 2016.
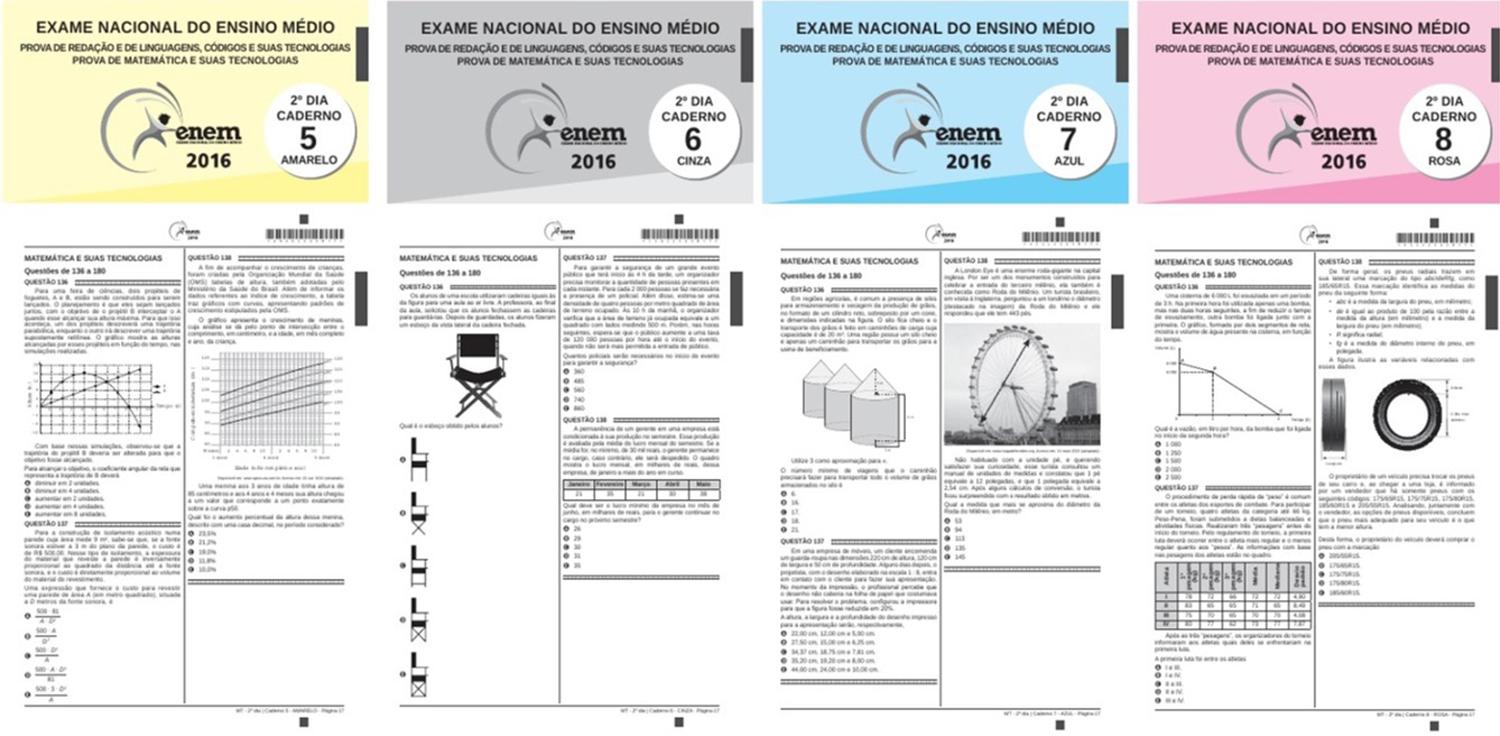
Source: Inep, 2016. Available at: https://www.gov.br/inep/pt-br/areas-de-atuacao/avaliacaoe-exames-educacionais/enem/provas-e-gabaritos. Accessed on: 14 April 2022.
Figure 1 Workbooks by color
Operationally, the main objective of color diversification is to hinder copies or exchange of response cards since students sitting close to each other must receive different color workbooks. However, we did not find in the official documents justifications as to how the workbooks are put together. We also detected that the content of each page is fixed, but the order of the pages within a given knowledge field is altered from workbook to another. This means that some questions are always close to each other, regardless of workbook color, but a page may be placed in different positions. This is a similar configuration Pisa’s and was used by Sassaki et al. (2018) to identify the fatigue effect.
As discussed previously, this variation can affect the chances of correctly answering a question, which would indicate the interference of a non-cognitive factor in the performance of students. This is the phenomenon we will investigate, in an exploratory way, in this study.
Microdata from the 2016 Enem
The microdata format used by the Inep is analytically versatile, but it presents two relevant limitations regarding what we have proposed to investigate. The first, already mentioned, is the size of the files. The second is the format of the answers for each participant, given that they are not given as independent fields, but as a character sequence indicating which was the choice selected by the student, followed by a character chain with the respective answers for the questions. Technically, this format requires data pre-processing before it is actually possible to check any information regarding the answers given by the participants to the questions that made up the tests of each knowledge field contemplated by the Enem.
Thus, before importing the dataset to a statistical analysis software, we pre-processed it with a script in C language. The first step was to select only the students that were of interest to the research. Our selection included participants with regular attendance on both days, who were not taking the test to practice, with regular status in secondary education, and who worked on one of the workbooks used in the first application of the test11. With these criteria, we ended up with a sample of 4.427.790 participants.
Afterwards, we altered the format in which the answers are stored in the microdata. The character chains with the answers for each question in the field of Mathematics and its Technologies were converted into 45 binary variables, one for each question, indicating whether the student got it right (1) or wrong (0). In addition, we separated participants per workbook (color), also including socioeconomic and demographic information. The decision to include these fields arose from the possibility to include them in subsequent analyses and, since our dataset will be publicly available, other researchers will be able to benefit from a wider set of information. After treatment, the data were analyzed using R, version 3.4.412.
Analysis
Fatigue Effect
The exploration of the data started with identifying the position of each question (labeled by the numeric identification code adopted in the Inep’s microdata) in the four workbooks of the main application of the 2016 Enem. Then, the hit rate of each question was calculated separately per workbook.
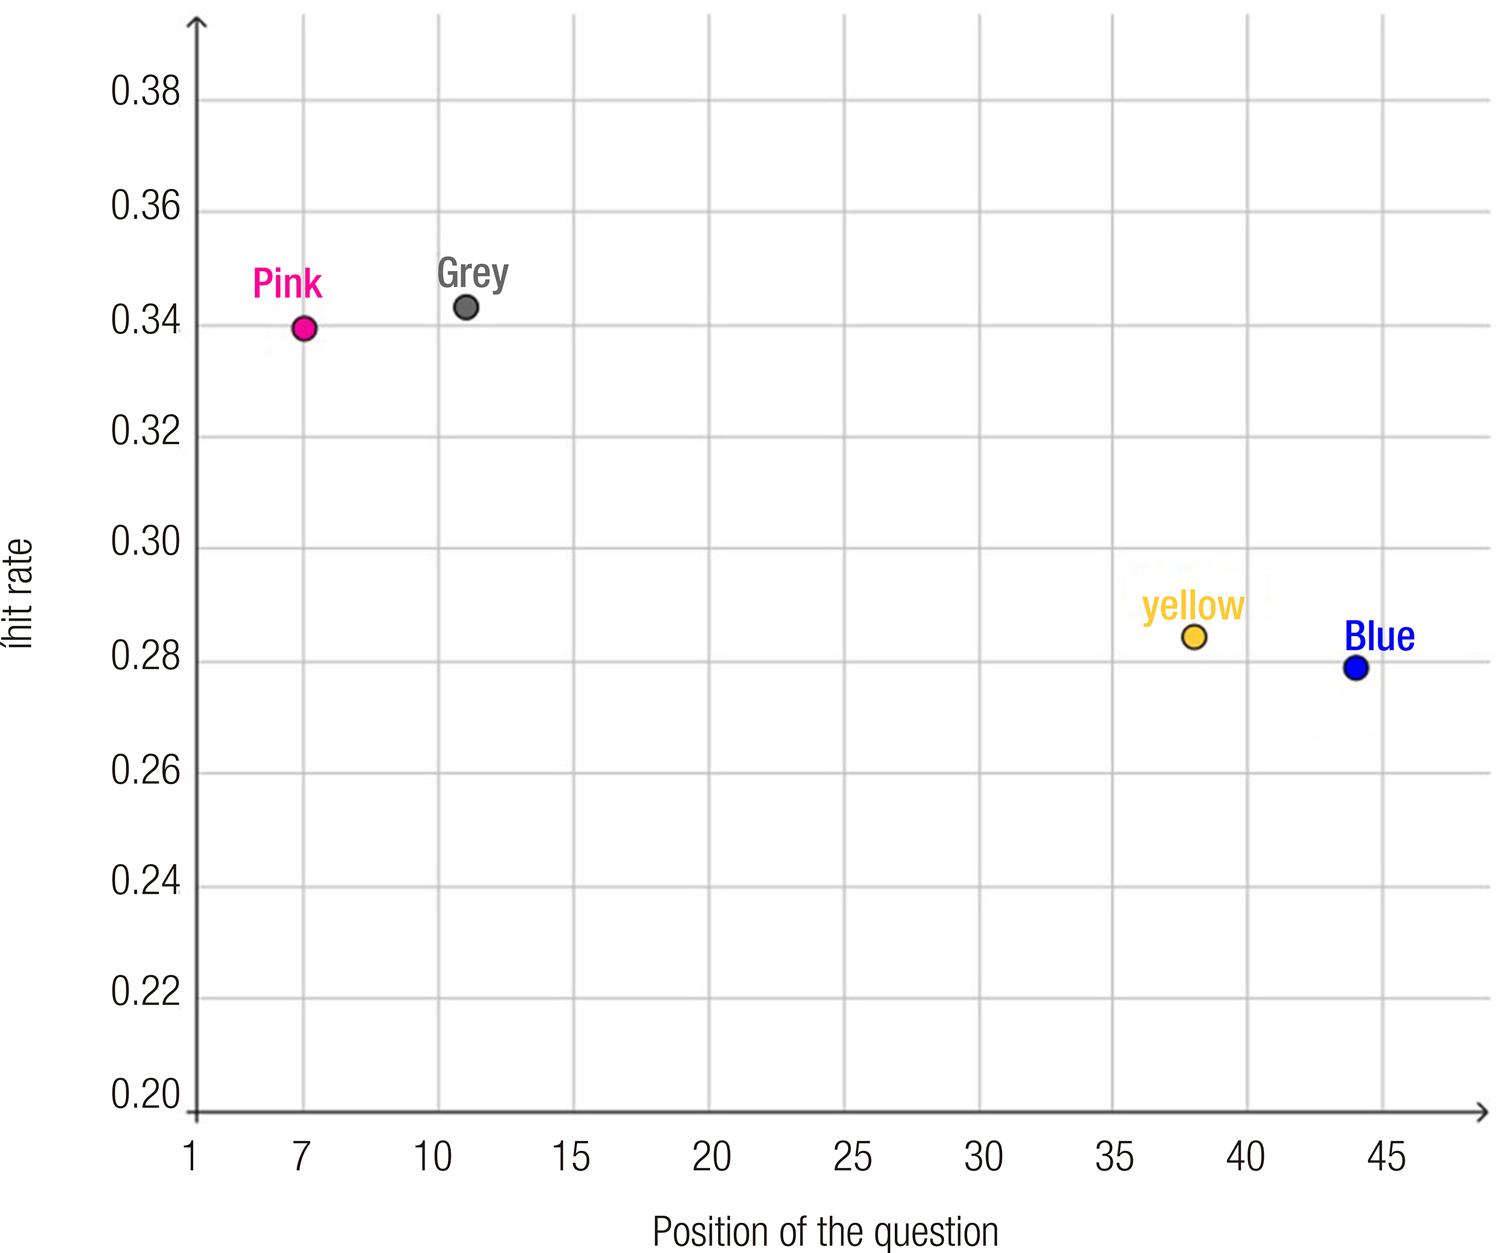
Graph 1 shows the hit rate variation for the question with code 88786 in each workbook, identified by their colors.
Source: the authors, 2020.
Graph 1 Percentage of correct answers for question 88786 as a function of the position in which it was presented
The value we are interested in is the percentage of correct answers per question. Theoretically, if there is no fatigue effect, the frequency of correct answers must be equal, regardless of the question’s position. However, as it can be observed, question 88786 appeared at the end of the Blue and Yellow workbooks with a mean hit rate of approximately 28%. When the same question was presented at the beginning of the test (Pink and Grey workbooks), the mean percentage of correct answers rises to about 34%. The difference in six percentage points equals a variation of 21,4% and it is sufficiently large to raise doubts about the validity and reliability of the test as an instrument for evaluating cognitive knowledge and abilities.
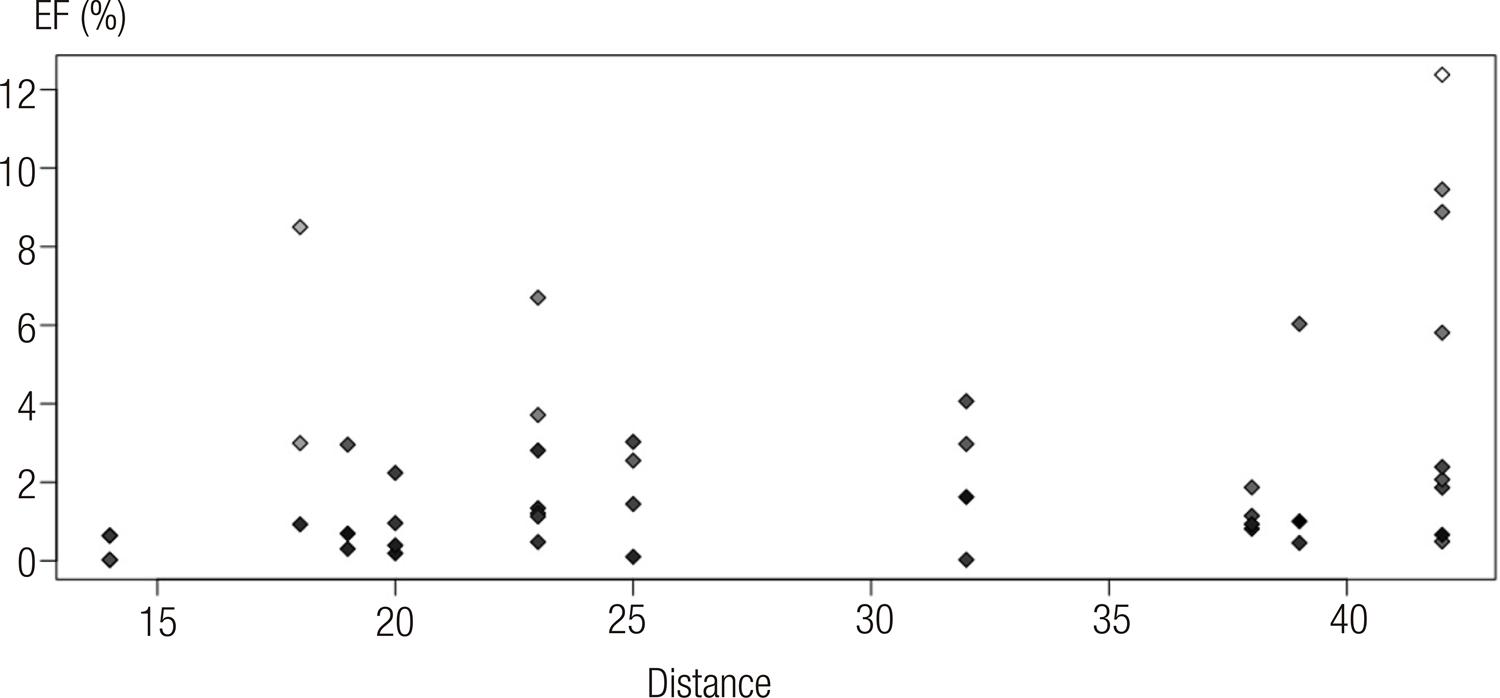
To estimate the degree in which this phenomenon affects other questions, we created an indicator especially designed to capture this trend, which we will call FE. A question’s FE is calculated from the difference between the hit rates when we maximize the distance of this question’s position. In the example presented in Graph 1, the largest distance is 39, which is the absolute difference between 44 (Blue workbook) and 5 (Pink workbook). Then, it is only a matter of calculating the absolute difference between 33,9% (hit rate in the Pink workbook) and 27,9% (hit rate in the Blue workbook) to find an FE of 6,0%. Table 1 shows the overall frequency of correct answers, the furthest distance, and the FE for all the questions. The information in Table 1 can also be visualized in Graph 2.
Table 1 Overall frequency of correct answers, largest distance, and FE of the Mathematics and its Technologies in the 2016 Enem
| ID | Overall correct answers (%) | Furthest distance | FE (%) | ID | Overall correct answers (%) | Furthest distance | FE (%) | |
|---|---|---|---|---|---|---|---|---|
| 38786 | 16,99 | 14 | 0,02 | 25285 | 31,04 | 25 | 2,55 | |
| 87262 | 26,86 | 14 | 0,03 | 16644 | 25,15 | 25 | 3,03 | |
| 42692 | 23,11 | 14 | 0,64 | 48223 | 23,47 | 32 | 0,02 | |
| 8476 | 16,26 | 14 | 0,64 | 44243 | 15,51 | 32 | 1,62 | |
| 60291 | 20,51 | 18 | 0,93 | 17264 | 30,35 | 32 | 2,97 | |
| 42955 | 42,93 | 18 | 3,00 | 96833 | 27,32 | 32 | 4,06 | |
| 45081 | 46,36 | 18 | 8,50 | 53278 | 16,05 | 38 | 0,82 | |
| 95265 | 19,14 | 19 | 0,30 | 85018 | 17,34 | 38 | 0,93 | |
| 39762 | 15,11 | 19 | 0,69 | 32686 | 25,73 | 38 | 1,14 | |
| 25723 | 28,93 | 19 | 2,96 | 27005 | 31,81 | 38 | 1,87 | |
| 30029 | 16,68 | 20 | 0,19 | 60315 | 21,36 | 39 | 0,45 | |
| 53721 | 17,95 | 20 | 0,39 | 39198 | 11,57 | 39 | 1,00 | |
| 83906 | 22,42 | 20 | 0,96 | 88786 | 31,05 | 39 | 6,03 | |
| 85050 | 24,17 | 20 | 2,24 | 11472 | 30,03 | 42 | 0,49 | |
| 10052 | 22,33 | 23 | 0,48 | 59795 | 14,71 | 42 | 0,66 | |
| 83234 | 22,35 | 23 | 1,13 | 24747 | 25,17 | 42 | 1,86 | |
| 32969 | 25,64 | 23 | 1,21 | 42706 | 29,03 | 42 | 2,07 | |
| 29844 | 19,30 | 23 | 1,34 | 96774 | 25,75 | 42 | 2,39 | |
| 83152 | 20,61 | 23 | 2,81 | 37515 | 35,16 | 42 | 5,81 | |
| 53219 | 37,12 | 23 | 3,71 | 18364 | 36,01 | 42 | 8,88 | |
| 32808 | 37,42 | 23 | 6,70 | 30865 | 37,87 | 42 | 9,46 | |
| 40660 | 19,31 | 25 | 0,10 | 32221 | 62,53 | 42 | 12,38 | |
| 83608 | 24,87 | 25 | 1,45 | |||||
Source: the authors, 2020.
Source: the authors, 2020.
Graph 2 FE and distance for each question (n=45) in the Mathematics and its Technologies test for the 2016 Enem
Each point represents one of the 45 questions; the X axis represents the furthest distance, the Y axis represents the FE, and the color represents that question’s hit rate (the lighter it is, the higher the hit rate). First, it is worth noting that the FE reaches 12% and this occurs in a question where the distance was 42 (point on the superior right corner of Graph 2). In addition, we have seven questions with an FE higher than 5%.
To explore how the two variables, furthest distance and FE relate, we used a linear regression on the dataset. The standardized coefficient of the line obtained is 0,326 (p-value=0,029; n=45), that is, if the distance of the same question increases in 10 positions, we should observe a mean variation in correct answers of 3,26%13. The coefficient of determination (r2), which is commonly interpreted as the total variance of the dependent variable explained by the set of explanatory variables, was 0,106, meaning that the distance between the items in the workbook is responsible for about 10% of the FE’s variation.
To ensure more robust results, we inverted the reasoning, to identify the FE from the shortest distance in which a question occurred among the different workbooks14. The expectation is that the FE calculated in this way will be very low, since we are comparing questions practically in the same position in different workbooks. Indeed, the minimum distances varied between 1 and 13 and we did not obtain an FE higher than 3%. The majority of questions (34) presented an FE below 1%.
Despite not being a homogenous effect, there are questions that have a considerably lower hit rate when presented at the end of the workbook than when they appear at the beginning. One possible explanation for that phenomenon, aligned with what Davis and Ferdous (2005) suggest, is that the participant tires throughout the exam and, when faced with a question that would require more cognitive effort, ends up with a worse performance than if that question were at the beginning of the test.
The fatigue effect we found with the aid of the FE indicator in the 2016 Enem, seems to us to be equivalent to the phenomenon identified by Sassaki et al. (2018) in the 2015 Pisa. The approach adopted in this paper, which innovated by incorporating the position of the questions in the different workbooks, complements the results found by Travitzki (2017) regarding the appropriateness of questions in the 2009 and 2011 editions of the Enem. The author identified, after analyzing only one workbook, that there was a higher concentration of questions with anomalous behavior at the end of the test and suggested as explanation for the phenomenon the tiredness of participants and the length of the test. The behavior of the FE that we have observed here offers new elements that may even help to understand the psychometric qualities of the Enem’s questions within the IRT’s approach.
Different groups suffer from fatigue on different questions
In Graph 2, it is also noted that questions with an overall low frequency hit rate have an overwhelming low FE, which suggests some interaction between these variables.
Of the 34 questions with up to 31% correct answers, 26 have a lower FE than 2% and the remaining 8 have an FE of, at most, 4%. That is, harder questions (with a lower hit rate) seem to cause a lower FE.
These observations, along with the fact that the Enem has a very heterogenous public, made us consider what the FE would be for participants with different performances.
To do so, we divided participants in groups based on the number of correct answers in the Mathematics and its Technologies test, not their final grade after using the IRT parameters employed by the Enem. Since the Enem’s questions are multiple choice with five alternatives, it is expected that a participant gets right, on average, nine questions, even if they answer them randomly. Thus, we divided our sample into five groups from the total number of correct answers, as presented on Table 2.
Table 2 Distribution of participants per group
| Group | Total number of correct answers | Participants, n (%) |
|---|---|---|
| 1 | 0 – 9 | 1.612.119 (36,41) |
| 2 | 10 – 18 | 2.426.686 (54,80) |
| 3 | 19 – 27 | 305.620 (6,90) |
| 4 | 28 – 36 | 75.075 (1,70) |
| 5 | 37 – 45 | 8.290 (0,19) |
Source: the authors, 2020.
We investigated how the FE affects participants from different groups. For example, is it possible that a participant with a lot of correct answers (belonging to group 5), who likely has a higher level of knowledge and better preparation to take the test, is not affected as much by the fatigue effect? Similarly, is it possible that a participant who selects a lot of answers randomly (belonging to group 1), who likely has a lower level of knowledge and weaker preparation to take the test, is more affected by the fatigue effect?
After the groups were separated, we selected the five questions with higher FE for each, as seen on Table 3. This table does not contain 25 questions because some of them occurred for more than one group, such as 30865, which is among the five questions with higher FE for groups 1, 2, and 3. Highlighted in grey are the five questions that caused the highest fatigue effect for the group.
Table 3 The five questions with highest FE per performance group
| Question ID | Furthest distance | FE Group 1 (%) | FE Group 2 (%) | FE Group 3 (%) | FE Group 4 (%) | FE Group 5 (%) |
|---|---|---|---|---|---|---|
| 32808 | 23 | 3,57 | 7,40 | 9,60 | 4,88 | 2,49 |
| 30865 | 42 | 4,63 | 11,12 | 16,05 | 6,03 | 1,51 |
| 45081 | 18 | 6,00 | 8,43 | 4,67 | 1,87 | 0,72 |
| 18364 | 42 | 6,68 | 8,43 | 20,85 | 10,22 | 1,80 |
| 32221 | 42 | 11,98 | 11,36 | 5,18 | 1,57 | 0,01 |
| 88786 | 39 | 1,12 | 8,62 | 18,39 | 8,17 | 2,44 |
| 59795 | 42 | 1,95 | 1,05 | 17,02 | 14,84 | 3,50 |
| 96833 | 32 | 0,00 | 5,74 | 17,94 | 8,03 | 1,07 |
| 17264 | 32 | 1,38 | 2,79 | 15,18 | 10,33 | 2,68 |
| 96774 | 42 | 0,37 | 3,16 | 15,66 | 11,87 | 2,81 |
| 53278 | 38 | 0,20 | 0,63 | 12,39 | 12,36 | 4,38 |
| 85018 | 38 | 0,30 | 0,01 | 11,28 | 17,02 | 8,27 |
| 10052 | 23 | 0,34 | 0,08 | 01,28 | 1,69 | 5,10 |
| 95265 | 19 | 0,60 | 0,36 | 01,44 | 2,40 | 6,18 |
| 53721 | 20 | 0,76 | 0,57 | 3,70 | 8,04 | 6,87 |
| 60315 | 39 | 0,59 | 0,63 | 3,58 | 4,17 | 9,08 |
Source: the authors, 2020.
This table must be read by lines. For example, question 96833 was included because it had the highest FE for group 3 (17,94%). However, it caused a nearly null FE for groups 1 and 5, even though it appeared with a distance of 32.
The questions that had the highest FE for groups 2 and 4 are close in values but are not the same. The question with the highest FE for group 2 (32221) has a rate of 11,36% for that group and only 1,57% for the participants in group 4. On the other hand, question 85018 has the highest FE for group 4 (17,02%) and 0,01% for group 2. Comparatively, group 3 is the most affected, with a peak of 20,85% for question 18364. That was the second question in the Blue workbook and the penultimate question in the Pink workbook, with respective hit rates of 75,5% and 54,7%, among the participants of group 3. A very significant hit rate considering that it is the same question, just presented in a different order.
Considering the three middle groups, where 63,4% of participants are concentrated, with the exception of one question (45081), all present distance of 32 or more and the FE is high in the majority of cases. In turn, groups 1 and 5 show an overall lower FE.
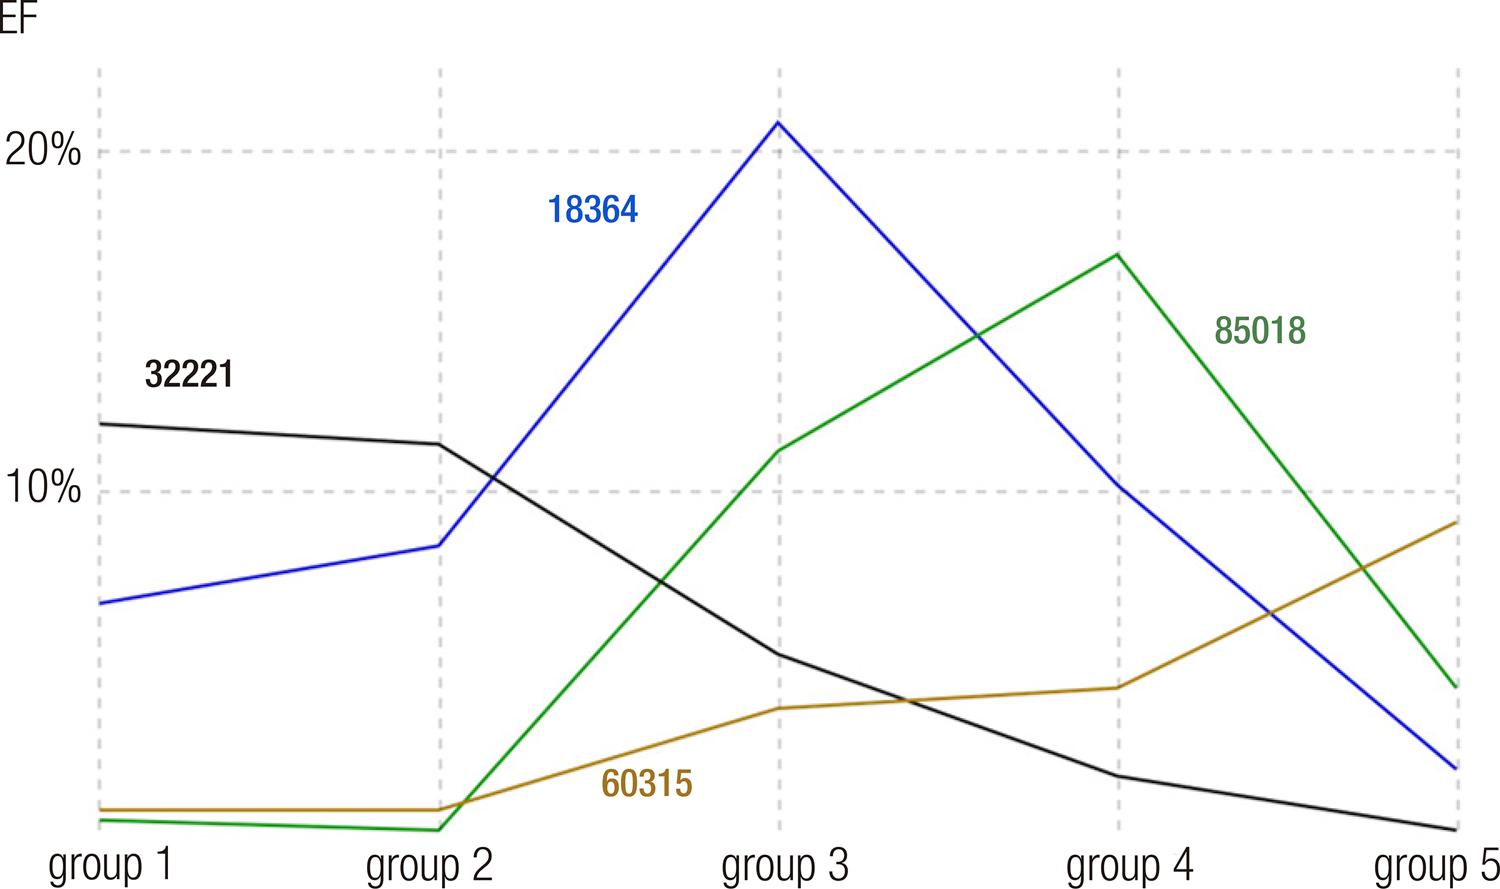
All groups are affected, but different groups are affected on different questions. Despite there being some intersection among the questions in neighboring groups, its value varies considerably as the groups spread apart. Graph 3 illustrates the variation in the FE for the four questions that were chosen for having presented the highest FE in each group.
Source: the authors, 2020.
Graph 3 FE variation for four questions for the different performance groups
Groups 1 and 2 had a maximum FE in the same question (32221) and it is observed that this value diminishes as the participants’ performance increased, being a question that practically does not affect the participants in group 5. Question 18364 is among the highest FEs for groups 1 and 2 and hits its peak in group 3. However, it is no longer among the five highest for group 4 and it has a very low FE for group 5. The peak for group 4’s FE was on question 85018, which did not hinder participants in groups 1, 2, and 5 too much. Lastly, the question that caused the highest FE in group 5, 60315, showed residual impact in all other groups.
Remembering the questions posited at the beginning of this section, we observed that students in groups 1 and 5 suffered less influence from the fatigue effect. Comparatively, group 3 was the most sensitive to this effect. It escapes our knowledge any papers that have analyzed data from the Enem considering different performance groups. The differences we have identified among the groups suggest that this approach is relevant to studies that seek to understand the performance of participants and/or assess the quality of the exam, such as the ones conducted by Toffoli (2019) and Travitzki (2017).
FE and the questions’ difficulty
A possible explanation for the difference among FEs of different groups for the same question, observed in the previous section, is that questions that had a very low FE in a given group have a very high or very low frequency of correct answers in that group. That is, on one hand, participants get a question right, regardless of its position in the workbook, if it is easy for that group (high correct answer frequency). On the other hand, if the question is difficult for that group, the fact that it appears at the beginning or the end of the workbook does not alter the frequency of correct answers, given that, very likely, the participants in that group were not able to cognitively engage in solving the item. Consequently, we expect that questions with a high FE have an intermediary frequency of correct answers within that group.
To explore that relationship, we created Table 4, which presents the frequency of correct answers for the same questions as the ones in Table 3 (the highlights in grey indicate the questions that had the highest FE for the group).
Table 4 Frequency of correct answers within each group
| Frequency of correct answers among students of the group (%) | |||||
|---|---|---|---|---|---|
| ID | Group 1 | Group 2 | Group 3 | Group 4 | Group 5 |
| 32808 | 21,52 | 41,86 | 73,27 | 83,34 | 92,63 |
| 30865 | 20,81 | 41,99 | 79,93 | 93,23 | 98,13 |
| 45081 | 28,33 | 51,69 | 86,51 | 92,61 | 96,07 |
| 18364 | 26,82 | 36,39 | 66,37 | 90,69 | 98,12 |
| 32221 | 44,50 | 69,59 | 92,31 | 96,55 | 98,91 |
| 88786 | 14,91 | 34,15 | 75,41 | 89,56 | 96,00 |
| 59795 | 9,30 | 13,09 | 39,47 | 73,76 | 90,83 |
| 96833 | 12,33 | 29,60 | 71,09 | 89,84 | 97,52 |
| 17264 | 20,44 | 31,87 | 55,83 | 82,98 | 95,17 |
| 96774 | 16,37 | 26,63 | 52,90 | 80,80 | 95,33 |
| 53278 | 9,97 | 15,90 | 34,80 | 66,81 | 88,97 |
| 85018 | 12,87 | 17,90 | 26,30 | 52,04 | 76,91 |
| 10052 | 15,65 | 25,46 | 28,18 | 36,55 | 61,33 |
| 95265 | 14,50 | 21,70 | 22,09 | 22,60 | 30,31 |
| 53721 | 12,77 | 19,37 | 26,38 | 42,77 | 71,47 |
| 60315 | 15,17 | 24,12 | 26,38 | 38,71 | 74,14 |
Source: the authors, 2020.
Beginning with group 5, question 95265 stands out as the hardest question in the whole test, including the ones not presented in the table and, as verified by being in grey, is part of the set with highest FE. In addition to it, the other questions in grey for group 5 present an intermediary frequency of correct answers. The first 11 questions in the table had an 88% frequency of correct answers for this group and a low FE.
Three levels of difficulty can be seen in a more accentuated form in the questions in grey for groups 3 and 4: when the frequency of correct answers is too high, the question stops presenting a high FE value for that group and the same can be said when the frequency of correct answers is too low.
Note that for groups 1 and 2, the highest frequency of correct answers coincides (for the most part) with the questions with highest FE, since the hit rates for these groups never reach really high values (maximum of 45% for group 1 and 70% for group 2). On the other hand, the group of difficult questions (low hit rate) is quite large and presents an incredibly low FE.
A possible interpretation for this phenomenon is that the very difficult questions (low hit rate) cause little fatigue because participants do not invest a long time attempting to solve them or cannot cognitively engage with their resolution. On the other hand, questions with a high hit rate (too easy) also do not cause fatigue because participants manage to solve them even when they are at the end of the test, and they are tired. Questions at an intermediary hit rate level are those that are not too easy and can be solved quickly, nor too difficult, being beyond the candidate’s abilities, and thus highlight the effect of the fatigue caused by an evaluation as lengthy as the Enem.
That interpretation is aligned to what was suggested by Travitzki (2017) to explain the anomalous behavior for some of the Enem’s questions. Our analysis substantiates that suggestion by demonstrating that the fatigue effect differently affects groups with distinct performances according to each question’s difficulty.
Conclusions
This paper presents the first empirical evidence that the fatigue effect is manifested in the Enem. From a sample of over four million answers present in the microdata of the 2016 edition of the Mathematics and its Technologies test, we found a substantial drop in the performance of students in a given question when it appeared closer to the end of the test. This evidence is compatible with results obtained in other countries (BORGHANS; SCHILS, 2012) as well as with the experience of Brazilian students in other examinations (SASSAKI et al., 2018).
Next, we deepened the understanding on the fatigue effect considering how it is manifested in different participants, grouped according to the total number of correct answers obtained during the test. Our results suggest that all groups are affected by the fatigue effect, but groups with distinct performances present the effect on different questions.
Lastly, when considering the difficulty of the questions for each group, we identified the trend that questions with a higher FE are those at an intermediary level of difficulty. Our tentative explanation for this phenomenon is that the easiest questions are not challenging enough for these participants and, therefore, they manage to solve them with the same efficiency whether they are at the beginning or end of the test. At the other extreme, harder questions are perceived as beyond the student’s abilities, resulting in little cognitive involvement with it, and reducing the impact of fatigue. As far as we know, this result is unprecedented in academic literature. This explanation is also aligned with the most erratic behavior in students’ answers at the end of the test in the 2009 and 2011 editions of the Enem, as identified by Travitzki (2017).
From a methodological perspective, the variation in the FE that we identified the section “Different groups suffer from fatigue on different questions”, suggests that the approach we adopted, of grouping students by performance, should be considered by studies in the field, since it allows a more refined view of phenomena such as the ones identified by Sassaki et al. (2018), Toffoli (2019), and Travitzki (2017).
It is worth noting that this study has two limitations, arising from the intentional selection of a specific year (2016) and only one field of knowledge (Mathematics). We acknowledge that restriction but point out that nothing keeps the finds in this study from being replicated in other contexts. For example, the time series may be expanded, other areas of knowledge may be included, and other interactions explored, such as difference in the FE by sex or the students’ socioeconomic condition.
From the psychometric point of view, the effect we identified may compromise the grades attributed by Item-Response Theory. Although the accumulated impact of the fatigue effect on the students’ final grade still demands systematic investigation in future studies, we consider it prudent, given the social relevance these results may carry (TOFFOLI et al., 2016), that measures to mitigate this effect be considered by the Inep.
The literature on Item-Response Theory in large-scale standardized evaluations is very rich internationally (TOFFOLI, 2019), which may offer paths and options to mitigate this effect. Nevertheless, we highlight three options that came up during the elaboration of this paper: an adaption of the solution adopted in the 2000 edition of the Pisa (ADAMS; WU, 2002), which recalculated the difficulty parameters of each question for each workbook separately; using models that consider the position of the question as one of the parameters in the processing of results via Item-Response Theory (ALBANO, 2013); using other forms of creating different workbooks, such as the randomization of each question’s alternatives rather than the questions.
REFERENCES
ADAMS, Ray; WU, Margaret (ed.). PISA 2000 technical report. Paris: Organisation for Economic Co-operation and Development, 2002. Disponível em: https://www.oecd.org/pisa/data/33688233.pdf. Acesso em: 23 abr. 2022. [ Links ]
ALAVARSE, Ocimar Munhoz. Desafios da avaliação educacional: ensino e aprendizagem como objetos de avaliação para a igualdade de resultados. Cadernos Cenpec, São Paulo, v. 3, n. 1, p. 135-153, 2013. [ Links ]
ALBANO, Anthony D. Multilevel modeling of item position effects: modeling item position effects. Journal of Educational Measurement, Washington, v. 50, n. 4, p. 408-426, 2013. [ Links ]
BAUER, Adriana; ALAVARSE, Ocimar Munhoz; OLIVEIRA, Romualdo Portela. Avaliações em larga escala: uma sistematização do debate. Educação e Pesquisa, São Paulo, v. 41, esp., p. 1367-1382, 2015. [ Links ]
BORGHANS, Lex; MEIJERS, Huub; TER WEEL, Bas. The role of noncognitive skills in explaining cognitive test scores. Economic Inquiry, Hoboken, v. 46, n. 1, p. 2-12, 2008. [ Links ]
BORGHANS, Lex; SCHILS, Trudie. The leaning tower of Pisa: decomposing achievement test scores into cognitive and noncognitive components. In: SOCIETY OF LABOR ECONOMISTS CONFERENCE, 17., 2012, Chicago. Anais… Chicago: SOLE, 2012. Disponível em: http://conference.nber.org/confer/2012/SI2012/ED/Borghans_Schils.pdf. Acesso em: 23 abr. 2022. [ Links ]
DAVIS, Jeff; FERDOUS, Abdullah. Using item difficulty and item position to measure test fatigue. Washington: American Institutes for Research, 2005. [ Links ]
GONZAGA, Luiz Ricardo Vieira; ENUMO, Sônia Regina Fiorim. Lidando com a ansiedade de provas: avaliação e relações com o desempenho acadêmico. Boletim [da] Academia Paulista de Psicologia, São Paulo, v. 38, n. 95, p. 266-277, 2018. [ Links ]
HERZOG, Regula; BACHMAN, Jerald. Effects of questionnaire length on response quality. The Public Opinion Quarterly, Oxford, v. 45, n. 4, p. 549-559, 1981. [ Links ]
LAVRAKAS, Paul. Encyclopedia of survey research methods. Thousand Oaks: Sage, 2008. [ Links ]
LIMA, Priscila da Silva Neves et al. Análise de dados do Enade e Enem: uma revisão sistemática da literatura. Avaliação, Campinas, v. 24, n. 1, p. 89-107, 2019. [ Links ]
MARCHIONI, Cynthia G. Habilidades no cognitivas en América Latina: una medición desde pruebas estandarizadas. 2017. Tese (Mestrado em Economia) – Universidad Nacional de La Plata, La Plata, 2017. [ Links ]
MEYERS, Jason; MILLER, Edward; WAY, Walter. Item position and item difficulty change in an IRT-based common item equating design. Applied Measurement in Education, Abingdon, v. 22, n. 1, p. 38-60, 2008. [ Links ]
NEVO, David. Evaluation in education. In: SHAW, Ian; GREENE, Jennifer; MARK, Melvin (ed.). The SAGE handbook of evaluation. Thousand Oaks: Sage, 2011. p. 442-460. [ Links ]
RODRIGUES, Margarida Maria Mariano. Avaliação educacional sistêmica na perspectiva dos testes de desempenho e de seus resultados: estudo do SAEB. 2007. Tese (Doutorado em Psicologia) – Universidade de Brasília, Brasília, DF, 2007. [ Links ]
SASSAKI, Alex Hayato et al. Por que o Brasil vai mal no PISA? Uma análise dos determinantes do desempenho no exame. São Paulo: Insper, 2018. (Policy paper; n. 31). [ Links ]
TOFFOLI, Sônia Ferreira Lopes. Análise da qualidade de uma prova de matemática do Exame Nacional do Ensino Médio. Educação e Pesquisa, São Paulo, v. 45, e187128, 2019. [ Links ]
TOFFOLI, Sônia Ferreira Lopes et al. Avaliação com itens abertos: validade, confiabilidade, comparabilidade e justiça. Educação e Pesquisa, São Paulo, v. 42, n. 2, p. 343-358, 2016. [ Links ]
TRAVITZKI, Rodrigo. Avaliação da qualidade do Enem 2009 e 2011 com técnicas psicométricas. Estudos em Avaliação Educacional, São Paulo, v. 28, n. 67, p. 256-288, 2017. [ Links ]
WOYCIEKOSKI, Carla; HUTZ, Claudio Simon. Inteligência emocional: teoria, pesquisa, medida, aplicações e controvérsias. Psicologia: reflexão e crítica, Porto Alegre, v. 22, n. 1, p. 1-11, 2009. [ Links ]
* English versidon by Larissa Peixoto Gomes. The authors take full responsibility for the translation of the text, including titles of books/articles and the quotations originally published in Portuguese.
5- See: https://agenciabrasil.ebc.com.br/educacao/noticia/2016-11/enem-administrar-bem-o-tempo-e-fundamental-na-hora-da-prova and http://portal.inep.gov.br/enem/perguntas-frequentes.
6- Programme for International Student Assessment, developed by the OCDE in 1999 given to 15 year-old students with the aim of comparing educational systems in over 70 countries. More information at: http://www.oecd.org/pisa/.
7- An analogous effect can be observed in survey research, where panel fatigue is one of the main threats to the quality of information in longitudinal information gathering. In extreme cases, as Lavrakas (2008) highlights, panel fatigue can generate attrition in the sample and elevate the proportion of non-response. In addition, respondent fatigue is a phenomenon well-document in the literature and occurs when the interviewee tires from the interview. One of the effects of tiredness is inconsistent or even random responses (HERZOG; BACHMAN, 1981).
8- Available at: https://enem.inep.gov.br
9- The dataset that supports the outcomes of this study is not available in the same format that it was when this paper was written due to changes in privacy policies by the Brazilian Federal Government. However, all data used during our analysis may be accessed via https://osf.io/ev39z/?view_only=27d3b73665a04f079e98da507d0ac67b.
10- According to Microsoft, Excel’s total capacity is of 1.048.576 lines and 16.384 columns, see: https://support.microsoft.com/en-us/office/excel-specifications-and-limits-1672b34d-7043-467e-8e27-269d656771c3.
11- It is possible to have more than one application of the ENEM, whether for security reasons or to include specific groups. However, the first application usually includes the large majority of participants.
12- R is a free software for statistical analysis of data. Availabe at: https://cran.r-project.org/.
13- We used a least ordinary squares linear model (OLS), having as the dependent variable the FE and as independent variable the maximum distance in the positions of the questions in their respective workbooks. To ensure more robust results, we estimated a new model, controlling the relationship between FE and distance with the questions’ overall hit rate. The impact of the distance between the questions remains positive (β1 = 0,167) with a p-value of 0,051.
14- Due to space, these were not added to this paper, but can be easily obtained from the table available at: https://osf.io/ev39z/?view_only=27d3b73665a04f079e98da507d0ac67b.
Received: July 31, 2020; Revised: November 24, 2020; Accepted: February 10, 2021
 This is an Open Access article distributed under the terms of the Creative Commons Attribution Non-Commercial License, which permits unrestricted non-commercial use, distribution, and reproduction in any medium, provided the original work is properly cited.
