


Servicios Personalizados
Revista

Articulo
 texto en
  Inglés (pdf)
 Articulo en XML
 Enviar articulo por email
Compartir

 Permalink
Educação e Pesquisa
versión impresa ISSN 1517-9702versión On-line ISSN 1678-4634
Educ. Pesqui. vol.49 São Paulo 2023 Epub 31-Dic-2023
https://doi.org/10.1590/s1678-4634202349263111
THEME SECTION: education in health pandemic contexts covid-19
2Universidade Estadual do Ceará, Fortaleza, Ceará, Brazil.
It examines the quantitative expansion of stricto sensu graduate studies in the area of education in Brazil, based on the student dimension of its programs, considering their regional differences, type of course, and legal status. The quantitative approach and the documentary research method composed the methodological design of the investigation. The sample consisted of the total number of students in the course, admitted students, and graduated students in Graduate Programs in Education (GPEs), from 2004 to 2020. The data sets referring to the students were collected in the open data repository of the Coordination for the Improvement of Higher Education Personnel (CAPES, in Portuguese). Data analysis used descriptive statistics techniques, through the R language. There was an increase in the number of students in the courses, admitted students, and graduated students in GPEs in Brazil during the investigated period. The asymmetries, although still existing, were mitigated. The North and Northeast regions are still underrepresented. The participation of the private sector is still timid, if compared to the hegemony of the public sector, even when it comes to professional master’s degrees. In 2020 there was a decrease in all indicators, characterizing an inflection in the expansion process. These results are likely to contribute to support decision-making by managers and public policy makers.
Keywords Graduate Studies; Master’s Degree; Doctor’s Degree; Education; Covid-19
Examina a expansão quantitativa da pós-graduação stricto sensu na área de educação no Brasil, com esteio na dimensão discente de seus programas, ponderando suas diferenças regionais, de tipo de curso e de estatuto jurídico. A abordagem quantitativa e o método da pesquisa documental compuseram o desenho metodológico da investigação. A amostra se constituiu do total de estudantes do curso, de admitidos e de titulados em Programas de Pós-Graduação em Educação (PPGEs), de 2004 a 2020. Os datasets referentes aos estudantes foram coletados no repositório de dados abertos da Coordenação de Aperfeiçoamento de Pessoal de Nível Superior (CAPES). A análise dos dados empregou técnicas da estatística descritiva, por meio da linguagem R. Houve aumento no número de discentes, admitidos e titulados em PPGEs no Brasil, durante o período investigado. As assimetrias, apesar de ainda existentes, foram mitigadas. Norte e Nordeste ainda são regiões que se encontram sub-representadas. A participação do setor privado ainda é tímida, se comparada à hegemonia do setor público, mesmo nos mestrados profissionais. No ano de 2020, registrou-se diminuição em todos os indicadores, caracterizando uma inflexão no processo de expansão. Esses resultados são passíveis de contribuir para subsidiar a tomada de decisão dos gestores e formuladores de políticas públicas.
Palavras-chave Pós-Graduação; Mestrado; Doutorado; Educação; Covid-19
Introduction
After World War II, countries, especially the United States, began to understand the strategic role of science and technological innovation for their economic and social development. This idea permeated the environment of the 1950s and 1960s, which saw the birth of Brazilian graduate studies, partly based on the European tradition of holding a chair, partly involved in the American spirit of innovation (BALBACHEVSKY 2005; GOUVÊA 2012; MOREIRA; VELHO, 2008).
In the mid-twentieth century, the need for rapid expansion of Brazilian graduate studies led the Federal Government to take the initiative to create the Coordination for the Improvement of Higher Education Personnel (CAPES, in Portuguese) and the National Council for Scientific and Technological Development (CNPq, in Portuguese), agencies that would serve as an instrument of the development policy for this level of education (GOUVÊA 2012).
One of the main concerns of the managers of these agencies was the expansion of the National Graduate System (NGS). It would meet the need for qualified professors for higher education and high-level professionals since Brazilians needed to be trained abroad at the time. For this, the CAPES and CNPq scholarship policy was of fundamental importance, as it allowed the education of generations of researchers abroad (BALBACHEVSKY 2005; MOREIRA; VELHO, 2008).
Currently, stricto sensu graduate programs in Brazil are split into 49 assessment areas, which are grouped—according to affinity criteria—into three schools and nine major areas. In the area of human sciences, among the nine assessment areas that comprise it, education stands out, with the highest enrollment of students in 2021. Education is also the second area with the highest enrollment among the 49 assessment areas, second only to interdisciplinary3.
Based on this reality, this article proposes to analyze the quantitative expansion of stricto sensu Brazilian graduate studies in education, based on the student dimension of its programs, considering their regional differences, type of course, and legal status. It intends to contribute to the advancement of knowledge about the educational field, favoring the design of new studies, actions, and policies, based on the analysis of the opportunity to access this area.
Graduate studies in education in Brazil
The history of higher education in Brazil is relatively recent. The first institutions that had the legal authorization to grant diplomas appeared with the arrival of the Portuguese Royal Family in 1808. At that time, medical schools were created in the cities of Salvador and Rio de Janeiro. They followed the French model of professional and independent higher education institutions. The university, at that time, was rejected as an outdated institution (CUNHA 2007; PAULA 2009; SAVIANI 2008).
Graduate studies only started in the second half of the 20th century (GOUVÊA 2012), with the year 1965 as a milestone, with the approval of Opinion No. 977/1965, by the Federal Council of Education, authored by Newton Sucupira (CURY 2005). It established the double objective of training high-level professors and researchers to work in the expansion of the Brazilian higher education system and in the qualification of technical staff that are important for national development and for the promotion of social well-being. It is possible to discern, from the analysis of these objectives, the influence of the United States, whether in the relationship between knowledge production and social and economic development (MOREIRA; VELHO, 2008), or in the model adopted (BAETA NEVES 2020; HOSTINS 2006). The national graduate courses were created based on an imported model, but which was subject to adaptations, as a result of the specific needs of the country. The most important thing is that, from the beginning, graduate studies gained special attention from the Federal Government, which, through programs managed by CAPES and CNPq, fostered and stimulated its growth and expansion.
In the area of education, the first graduate courses appeared in the 1960s, starting with the master’s course at the Pontifical Catholic University of Rio de Janeiro (PUC-RJ) in 1966. The first doctoral course in the area emerged in 1976, also at this university (GONDRA; NUNES; MARTINS, 2018).
The Federal Government’s priorities and conceptions for graduate studies materialized in several National Graduate Plans—NGPs (BRASIL 1975, 1986, 2010)4. The theme of the quantitative expansion of the system is constant in these plans (HOSTINS 2006), since it was a response to the historically limited supply of higher education courses, a legacy of an elitist higher education that purposely restricted access to considerable portions of the population (CUNHA 2007).
The desire to expand graduate programs was also echoed in the National Education Plan (NEP) 2014–2024. It proposes ambitious objectives for the qualification of university faculties (goal 13), increasing the number of doctors and masters awarded per year (goal 14) and the qualification of basic education teachers through graduate studies (goal 16) (BRASIL 2014).
This rapid growth allowed the creation of the National Association of Graduate Studies and Research in Education (ANPEd, in Portuguese) in 1978, with 17 programs, 13 of which in public universities (CUNHA 2008). The constitution of ANPEd, which has as one of its historical commitments the fight for the quality of graduate studies in education, is an important milestone in the development of educational research and, since then, has been increasingly linked to the destinations of graduate studies in the area.
Since that time, graduate programs in education has been a space of dispute (CASTRO 2012) between those who advocate the primary function of graduate studies as related to the production of scientific research (SAVIANI 2003; SEVERINO 2007) and authors who are critical of the model that reduced research only to the elite sphere of graduate studies (GATTI 2001). In addition to this, there were resistances to the expansion model adopted by CAPES, which favored privatization and differentiation through professional programs (HOSTINS 2006).
Methodology
This research is an exploratory analysis supported by a quantitative approach. The sample consisted of students of graduate courses in education (CAPES evaluation area 38), from 2004 to 2020. The period allows observing the effects of public expansion policies under various governments and in different contexts in the area under the scope. The method adopted was documentary research, as documents are considered “[...] texts or data sets, printed or hand-written, quantitative and/or qualitative, physical or online, personal or official, closed or open, visual or representational”. (TIGHT 2019 p. 10).
Data sets were collected from the CAPES open data repository (https://dadosabertos.capes.gov.br), consisting of information provided annually by graduate programs through the Sucupira Platform (CAPES 2021a). The use of secondary data, as is the case, is a valuable strategy to explore the potential of large amounts of data collected on a large scale, usually by official organizations, for purposes other than those of this investigation (COHEN; MANION; MORRISON, 2018).
The data was treated and analyzed using the R language (R CORE TEAM, 2021). Descriptive statistics techniques were used to summarize the data. Graphs were generated using Microsoft Excel software, Microsoft 365 version. The variables selected for analysis are shown in the Chart 1.
Chart 1- Description of study variables
| Variables | Values |
|---|---|
| Course* | 1. Doctor’s Degree; 2. Academic Master’s Degree; Professional Master’s Degree |
| Student status |
1. Enrolled; 2. Graduated; 3. Dropout; 4. Dismissed; 5. Level change without defense; 6. Level change with defense |
| Region where the course is | 1. North; 2. Northeast; 3. Central-West; 4. Southeast; 5. South |
| Legal status | 1. Federal; 2. State; 3. Municipal; 4. Private |
* The first professional doctorate in the field of education emerged in 2019. Due to its appearance only at the end of the historical series, it was not analyzed separately from the academic doctorate.
Source: Elaborated by the authors.
Although aware of the criticisms of the biomedical model of ethical review of current research in Brazil (NUNES 2021), when making use of publicly accessible information, under the terms of Law No. 12,527, of November 18, 2011, this study is exempt from registration and evaluation by the CEP/CONEP system, as established in article 1, sole paragraph, item II, of CNS Resolution No. 510/2016 (BRASIL 2016).
Results and discussions
The last evaluation report of the education area had identified the growth in the number of programs (CAPES 2017). This increase is also confirmed by the total number of students. For this calculation, the six student situations (as expressed in the Box), in the reference year, in the Graduate Programs in Education (GPEs) were added. The result is expressed in Graph 1.
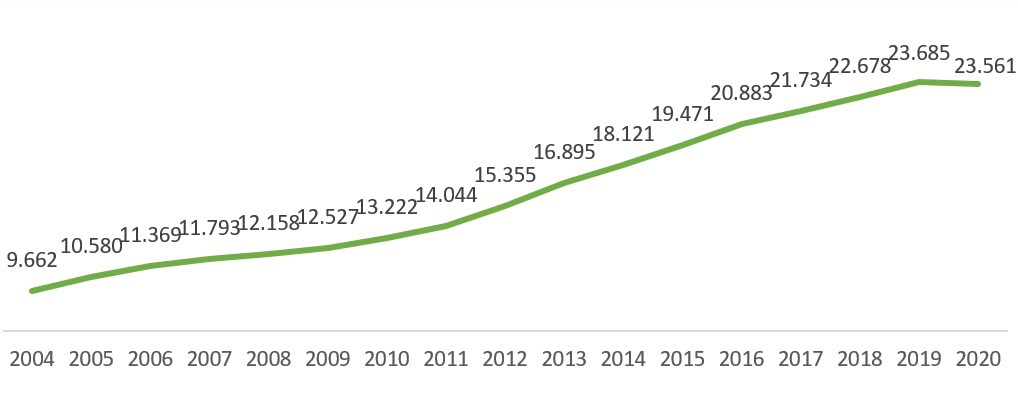
There was a gradual and continuous growth in the absolute number of students from 2004 to 2019. It started with 9,662 students in 2004, to reach the mark of 23,685 in 2019, an increase of more than 145.0%. Atypically, the year 2020 shows a decrease of 124 students compared to 2019. Only this time it happened during the period examined. The analysis of the growth rates per year makes it possible to visualize the different rhythms of expansion in the number of students (GRAPH 2).
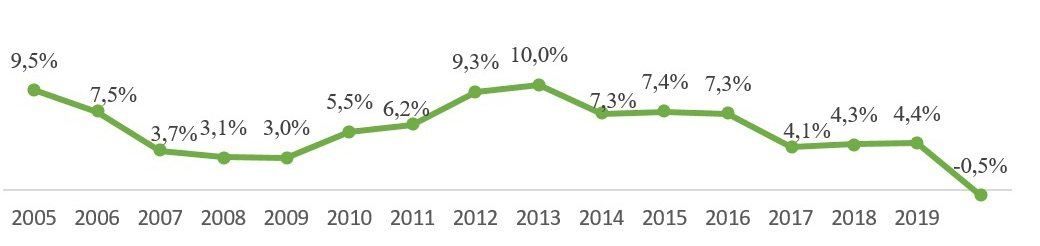
Despite a high start in 2005 (9.5%), the growth rate slowed down to reach 3.0% in 2009, coinciding with the last year of the second term of office of President Luiz Inácio Lula da Silva. In 2010, the number of students increased again to reach its peak – in 2013 (10.0%) – maintaining a fast pace from 2014 to 2016, the period corresponding to the term of office of President Dilma Rousseff. The number of students increased by more than 66.0%. During the term of office of President Michel Temer (2016-2018), the rate remained at a stable level. The growth rates from 2004 to 2019 show that the expansion that occurred in graduate studies as a whole (BRASIL 2010; CAPES 2018; CIRANI; CAMPANARIO; SILVA, 2015; STEINER 2005) also happened in the field of education. In 2020, during the term of office of President Jair Bolsonaro, the number of students, however, decreased by 0.5%, interrupting a sequence of 15 years of expansion of Brazilian graduate studies in the field of education. This increase in students, moreover, is not homogeneous between the types of graduate courses, as shown in Table 1.
Table 1 - Distribuição de discentes e taxas de crescimento anual dos PPGEs, por tipo de curso, 2004-2020
| Year | Doctor’s Degree | Academic Master’s Degree | Professional Master’s Degree | |||
|---|---|---|---|---|---|---|
| Rate (%) | Rate (%) | Rate (%) | ||||
| 2004 | 2.811 | - | 6.851 | - | - | - |
| 2005 | 3.021 | 7,5 | 7.559 | 10,3 | - | - |
| 2006 | 3.308 | 9,5 | 8.061 | 6,6 | - | - |
| 2007 | 3.503 | 5,9 | 8.290 | 2,8 | - | - |
| 2008 | 3.706 | 5,8 | 8.452 | 2,0 | - | - |
| 2009 | 3.930 | 6,0 | 8.597 | 1,7 | - | - |
| 2010 | 4.387 | 11,6 | 8.712 | 1,3 | 123 | - |
| 2011 | 4.644 | 5,9 | 9.013 | 3,5 | 387 | 214,6 |
| 2012 | 5.335 | 14,9 | 9.370 | 4,0 | 650 | 68,0 |
| 2013 | 5.973 | 12,0 | 9.747 | 4,0 | 1.175 | 80,8 |
| 2014 | 6.327 | 5,9 | 10.078 | 3,4 | 1.716 | 46,0 |
| 2015 | 6.547 | 3,5 | 10.468 | 3,9 | 2.456 | 43,1 |
| 2016 | 6.975 | 6,5 | 10.860 | 3,7 | 3.048 | 24,1 |
| 2017 | 7.406 | 6,2 | 10.830 | -0,3 | 3.498 | 14,8 |
| 2018 | 7.835 | 5,8 | 10.954 | 1,1 | 3.889 | 11,2 |
| 2019 | 8.415* | 7,2 | 11.117 | 1,5 | 4.153 | 6,8 |
| 2020 | 8.716** | 3,3 | 10.860 | -2,3 | 3.985 | -4,0 |
*There are 8,400 students in academic doctorates and 15 in professional doctorates.
**There are 8,675 students in academic doctorates and 41 in professional doctorates
Source: Elaborated by the authors.
The average annual growth rate of doctoral students (7.3%) was more than twice the average rate of the academic master’s degree (2.9%) and higher than the sample as a whole (5.7%). In the case of the professional master’s degree, considering the period from 2010 to 2020, the average growth rate was 41.6%. This indicates that the expansion of graduate studies occurred more quickly due to verticalization and the adoption of the professional modality.
In fact, when comparing the growth rate from 2004 to 2020, it is noted that the number of doctoral students increased by 210.1% in 16 years. Meanwhile, the master’s degree – adding academic and professional degrees – grew at a rate of 116.7%: a high percentage, just over half of the doctorate. When limited to the period 2010-2020, the average growth rate of the professional master’s degree (41.6%) is almost six times that of the doctorate (7.1%) and 19 times that of the academic master’s degree.
In 2020, the reduction in the number of students occurred only in the academic and professional master’s degrees. While academic and professional doctorates kept expanding, even if at a slower pace, master’s degrees experienced a decline in the total number of students. The professional master’s degree had the biggest reduction (-4.0%).
In the area of education, with the exception of the academic doctorate in teaching of Northeast Teaching Network (Rede Nordeste de Ensino, in Portuguese), created at the end of 2020 (RENOEN. 2021), there are no doctoral courses not linked to programs with master’s courses, a strong indication that the area follows the logic that the master’s degree is a step prior to entering the doctorate (BARROS; VALENTIM; MELO, 2005). It indicates, therefore, that the master’s programs invested in obtaining a better evaluation from CAPES and, consequently, in their verticalization through the creation of doctoral courses.
Academic master’s degrees showed low rates, and in the last four years, between declines (2017 and 2020) and low growth (2018 and 2019), the number of academic master’s students returned to the same level as in 2016. The opposite situation occurred in the professional modality: it expanded at high rates, never less than 10.0%, from 2011 to 2018. Professional master’s degrees were the object of the greatest reduction in 2020 (-4.0%).
The area of education resisted professional master’s degrees (BARROS; VALENTIM; MELO, 2005), having opened its first class more than ten years after the first students in this modality received their degrees (STEINER 2005). The resistance resulted, in part, from the fear of academic sectors of having their research themes hijacked by the pecuniary interests of companies and large caps (RIBEIRO 2005). As Dermeval Saviani (2003) reports, diversification signaled a “declining course” of Brazilian graduate studies, accompanied pari passu by the growth of private education.
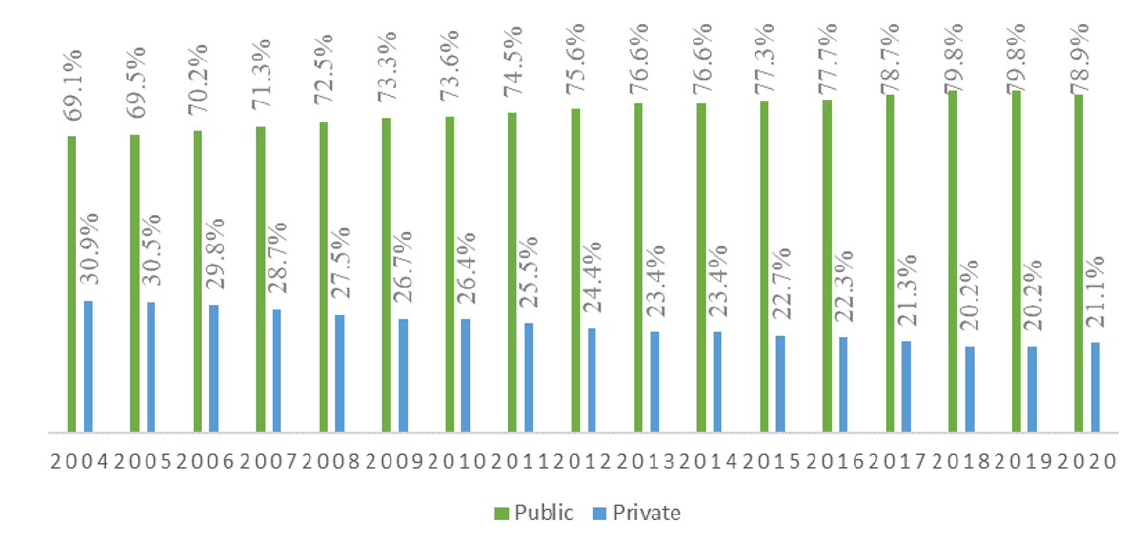
The warning made by Saviani (2003) seems to explain the great growth of the professional master’s degree in the field of education. The hypothesis is that the growth was due to the private sector, in a movement similar to that which occurred in undergraduate education. Based on the analysis of the number of students distributed between public and private HEIs, it is verified, therefore, if this actually occurred (Graph 3).
Source: Elaborated by the authors.
Graph 3 - Distribution of GPE students by public and private HEIs, 2004-2020
The proportional participation of the private sector gradually decreased until 2019. The private sector saw its participation drop from 30.9% in 2014 to 21.1% in 2020. The movement to increase the participation of the public sector even happened in professional master’s degrees, which were seen as more attractive to the private sector.
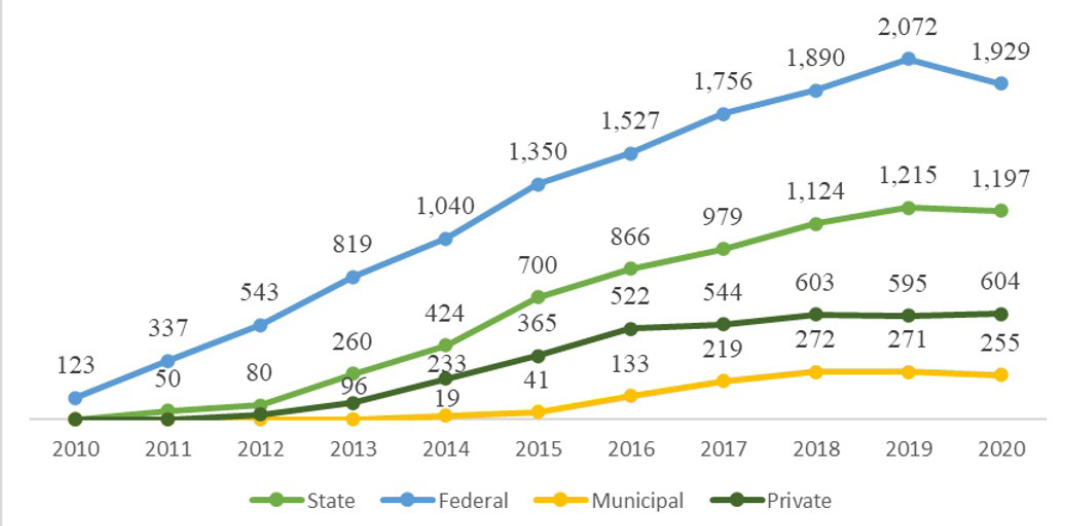
Graph 4 - Evolution of the number of students in professional master’s courses in education by legal status, 2010–2020
Professional master’s degrees in education, according to Graph 4, only started in 2010, initially in federal higher education institutions (HEIs), followed, in 2011, by state ones. The first professional master’s students in private HEIs emerged only in 2012 and the number grew until 2018. In federal and state HEIs, the number of students in professional master’s degrees grew at an accelerated pace until 2019.
The year 2020 showed an improvement in the participation of the private sector. In Graph 3, we can see that, from 2019 to 2020, the private sector increased its participation by almost 1.0%. This is due to both the increase in the number of students in the private sector, from 4,789 in 2019 to 4,965 in 2020 (3.7%), and the reduction in the public sector, from 18,896 in 2019 to 18,596 in 2020 (-1.6%). In the case of professional master’s degrees, the decline occurred exclusively in the public sector. In 2020, the number of students in master’s programs maintained by federal HEIs was reduced by 6.9%; in the state ones, by 1.5%, and by 5.9% in the municipal ones. Even so, the private sector accounted for only 15.2% of the number of professional master’s students in the area of education, a percentage lower than that of all graduate courses in the area (21.1%).
Professional master’s degrees have been a bet by CAPES since the 1990s to diversify the stricto sensu graduate offer and meet the aspirations of those who intended greater qualifications, but not aimed at academic life (HOSTINS 2006). According to Baeta Neves (2020), this diversification of Brazilian graduate studies constitutes a return to the origins of Opinion 977/65 which, inspired by the American model, saw masters as more professionalizing and attentive to the demands of the productive sector. The private sector, however, has not yet strongly adhered to professional master’s degrees in education, leaving them to the public sector.
Guiding many of the government actions in relation to the NGS, as well as synthesizing the policies in the area, there are the GNPs. There is a recurrent problem is in such plans: the asymmetries, especially the regional ones (BRASIL 1975, 1986, 2010). Next, it is possible to observe how the numbers of students of the GPEs behave, over the period investigated, in the geographic regions of the country (Table 2).
Table 2- Distribution of GPE students in the Brazilian regions, 2004-2020
| Year | Region | ||||
|---|---|---|---|---|---|
| North | Northeast | Central-West | Southeast | South | |
| 2004 | 126 | 1.381 | 677 | 5.214 | 2.264 |
| 2005 | 175 | 1.493 | 818 | 5.573 | 2.521 |
| 2006 | 210 | 1.622 | 900 | 5.896 | 2.741 |
| 2007 | 242 | 1.705 | 1.015 | 5.926 | 2.905 |
| 2008 | 242 | 1.817 | 1.098 | 5.957 | 3.044 |
| 2009 | 273 | 1.933 | 1.117 | 6.086 | 3.118 |
| 2010 | 298 | 2.093 | 1.173 | 6.377 | 3.281 |
| 2011 | 356 | 2.344 | 1.347 | 6.570 | 3.427 |
| 2012 | 383 | 2.477 | 1.379 | 7.377 | 3.739 |
| 2013 | 433 | 2.859 | 1.439 | 8.028 | 4.136 |
| 2014 | 548 | 3.150 | 1.470 | 8.586 | 4.367 |
| 2015 | 699 | 3.572 | 1.620 | 9.033 | 4.547 |
| 2016 | 846 | 3.958 | 1.679 | 9.603 | 4.797 |
| 2017 | 987 | 4.040 | 1.757 | 9.921 | 5.029 |
| 2018 | 1.071 | 4.203 | 1.876 | 10.284 | 5.244 |
| 2019 | 1.211 | 4.388 | 1.999 | 10.474 | 5.613 |
| 2020 | 1.263 | 4.342 | 1.929 | 10.197 | 5.830 |
Source: Elaborated by the authors.
There was a constant increase in the number of students in all regions of the country, from 2004 to 2019. However, this growth had different paces, being much higher in the North and Northeast regions, as shown in Table 3.
Table 3- Annual growth rates of students (%) in GPEs in the Brazilian regions, 2004-2020
| Year | Region | ||||
|---|---|---|---|---|---|
| North | Northeast | Central-West | Southeast | South | |
| 2005 | 38,9 | 8,1 | 20,8 | 6,9 | 11,4 |
| 2006 | 20,0 | 8,6 | 10,0 | 5,8 | 8,7 |
| 2007 | 15,2 | 5,1 | 12,8 | 0,5 | 6,0 |
| 2008 | - | 6,6 | 8,2 | 0,5 | 4,8 |
| 2009 | 12,8 | 6,4 | 1,7 | 2,2 | 2,4 |
| 2010 | 9,2 | 8,3 | 5,0 | 4,8 | 5,2 |
| 2011 | 19,5 | 12,0 | 14,8 | 3,0 | 4,4 |
| 2012 | 7,6 | 5,7 | 2,4 | 12,3 | 9,1 |
| 2013 | 13,1 | 15,4 | 4,4 | 8,8 | 10,6 |
| 2014 | 26,6 | 10,2 | 2,2 | 7,0 | 5,6 |
| 2015 | 27,6 | 13,4 | 10,2 | 5,2 | 4,1 |
| 2016 | 21,0 | 10,8 | 3,6 | 6,3 | 5,5 |
| 2017 | 16,7 | 2,1 | 4,6 | 3,3 | 4,8 |
| 2018 | 8,5 | 4,0 | 6,8 | 3,7 | 4,3 |
| 2019 | 13,1 | 4,4 | 6,6 | 1,8 | 7,0 |
| 2020 | 4,3 | -1,0 | -3,5 | -2,6 | 3,9 |
Source: Elaborated by the authors.
The average growth rate in the North region was 15.5%, followed by the Northeast (7.4%), Central-West (6.8%), South (6.1%) and Southeast (4.3%). In 2005 the North region had its highest growth in the period (38.9%). The peak of growth in the Northeast occurred in 2013 (15.4%). It is necessary to state that these high rates occur on top of small raw values (see Table 2), especially in the North region—although it also denotes an effort to reduce asymmetries between regions. All regions grew at higher rates than that of the Southeast. This region, in 2004, accounted for 54.0% of graduate students in education, according to Table 4.
Table 4- Evolution of the proportion of GPE students in the Brazilian regions of Brazil, 2004–2020
| Year | Region | ||||
|---|---|---|---|---|---|
| North | Northeast | Central-West | Southeast | South | |
| 2004 | 1,3 | 14,3 | 7,0 | 54,0 | 23,4 |
| 2005 | 1,7 | 14,1 | 7,7 | 52,7 | 23,8 |
| 2006 | 1,8 | 14,3 | 7,9 | 51,9 | 24,1 |
| 2007 | 2,1 | 14,5 | 8,6 | 50,3 | 24,6 |
| 2008 | 2,0 | 14,9 | 9,0 | 49,0 | 25,0 |
| 2009 | 2,2 | 15,4 | 8,9 | 48,6 | 24,9 |
| 2010 | 2,3 | 15,8 | 8,9 | 48,2 | 24,8 |
| 2011 | 2,5 | 16,7 | 9,6 | 46,8 | 24,4 |
| 2012 | 2,5 | 16,1 | 9,0 | 48,0 | 24,4 |
| 2013 | 2,6 | 16,9 | 8,5 | 47,5 | 24,5 |
| 2014 | 3,0 | 17,4 | 8,1 | 47,4 | 24,1 |
| 2015 | 3,6 | 18,3 | 8,3 | 46,4 | 23,4 |
| 2016 | 4,1 | 19,0 | 8,0 | 46,0 | 23,0 |
| 2017 | 4,5 | 18,6 | 8,1 | 45,6 | 23,1 |
| 2018 | 4,7 | 18,5 | 8,3 | 45,3 | 23,1 |
| 2019 | 5,1 | 18,5 | 8,4 | 44,2 | 23,7 |
| 2020 | 5,4 | 18,4 | 8,2 | 43,3 | 24,7 |
Source:Elaborated by the authors.
Note:if the sum in each line does not reach 100%, this fact results from the rounding adopted
Over the period under review, the relative participation of the Southeast region gradually decreased, reaching 43.3% in 2020. This decrease does not mean a lower number of students. On the contrary, as shown in Table 2, the number of students increased in all regions compared to 2004. The fact is that, over the period under analysis, the Southeast region decreased its relative participation in Brazil as a whole. This occurred as a result of the emergence of courses in regions initially underserved, preventing people interested in graduate courses from going to other regions of Brazil or to other countries.
The proportion of students from the South region remained almost stable, with very small variation, from 23.4% in 2004 to 24.7% in 2020. There was growth in the less represented regions, with emphasis on the North region, whose participation in the group of GPE students more than quadrupled, going from 1.3% in 2004 to 5.4% in 2020. In relation to the year 2020, there was a reduction in growth in the North and South regions and a loss of students in the other regions, being the Central-West region the most affected one (-3.5%) (see Table 2).
When comparing, however, the projection of the total population in the country in 2020, according to the region (IBGE 2020), with the percentage of students in graduate programs in education, it is possible to observe, through the difference between these percentages, that the North and Northeast regions are still underrepresented (Table 5).
Table 5- Percentage relating to distribution of GPE students and the Brazilian population by region, 2020
| Region | % Population | % GPE students | Difference |
|---|---|---|---|
| North | 8,7 | 5,4 | 3,3 |
| Northeast | 27,1 | 18,4 | 8,7 |
| Central-West | 7,8 | 8,2 | -0,4 |
| Southeast | 42,1 | 43,3 | -1,2 |
| South | 14,3 | 27,7 | -10,4 |
Source: Elaborated by the authors.
The situation of underrepresentation of the North and Northeast regions is even more pronounced in the case of doctoral courses in education, as shown in Graph 5, in comparison with IBGE projections for the Brazilian population in 2020.
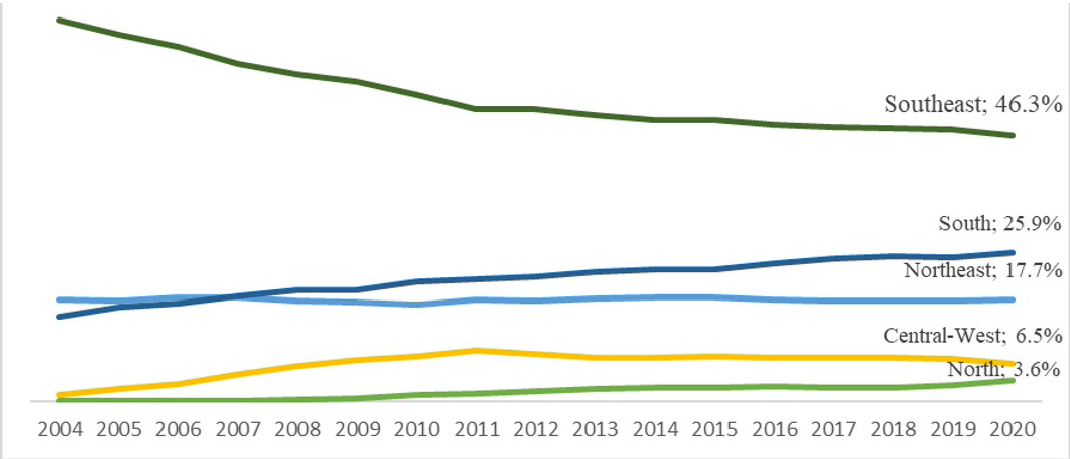
Graph 5 - Evolution of the percentage of students in doctoral courses in education by region in Brazil, 2004-2020
At the beginning of the historical series, there was a large concentration of doctoral students in the Southeast region. This is understandable, given that the first master’s and doctoral courses in education emerged in this region of the country (GONDRA; NUNES; MARTINS, 2018; A. F. MOREIRA 2009). Public policies guided by the objectives of the last GNPs managed to reduce asymmetries. This contributed to a much more equitable situation in 2020, compared to 2004. However, on the other hand, the South region increased its overrepresentation, showing that it will be necessary to strengthen the public policy to reduce asymmetries for doctoral courses. The North region, in turn, did not even have doctoral students in the field of education until 2008.
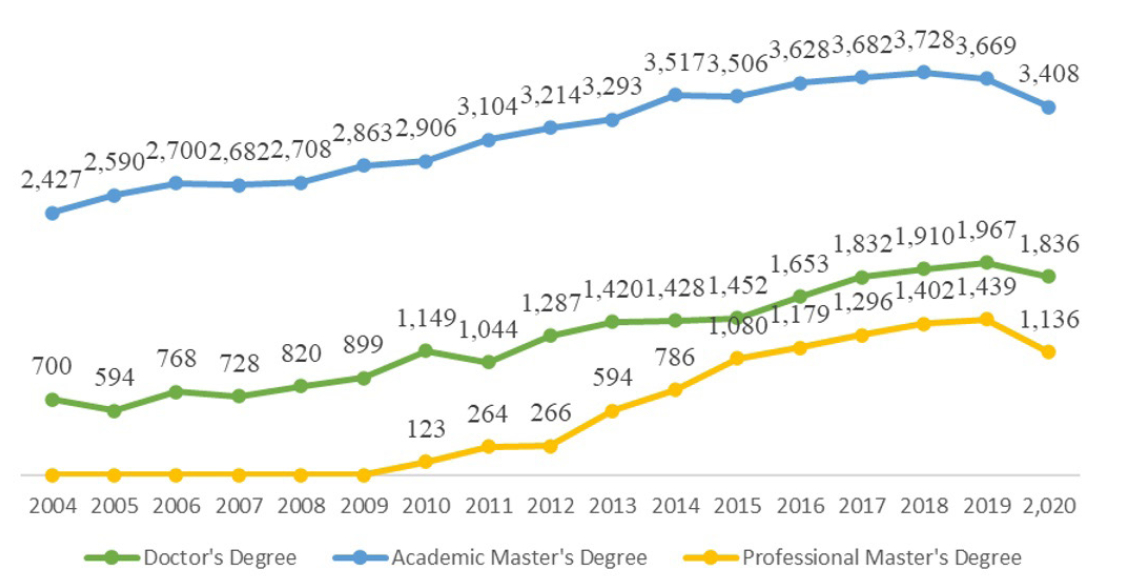
The number of those who enrolled in these courses is an important indicator to understand the expansion of graduate courses. It is possible to know though it if more students are enrolling in such courses. Graph 6 shows the evolution of the number of students who started the courses from 2004 to 2020, by type of course.
Source: Elaborated by the authors.
Graph 6 - Evolution of the number of enrollments in GPEs in Brazil by type of course, 2004-2020
An increase can be seen in the number of those who started graduate courses in education during the investigation period. This increment is not, however, always continuous. Variations in growth rates even indicate that, in some periods, there was a decrease in the number of students. Table 6 shows the growth rates by type of course.
Table 6- Number of admissions and annual growth rates (%) of GPEs by type of course, 2004-2020
| Year | Doctor’s Degree | Academic Master’s Degree | Professional Master’s Degree | |||
|---|---|---|---|---|---|---|
| Rate (%) | Rate (%) | Rate (%) | ||||
| 2004 | 700 | - | 2.427 | - | - | - |
| 2005 | 594 | -15,1 | 2.590 | 6,7 | - | - |
| 2006 | 768 | 29,3 | 2.700 | 4,2 | - | - |
| 2007 | 728 | -5,2 | 2.682 | -0,7 | - | - |
| 2008 | 820 | 12,6 | 2.708 | 1,0 | - | - |
| 2009 | 899 | 9,6 | 2.863 | 5,7 | - | - |
| 2010 | 1.149 | 27,8 | 2.906 | 1,5 | 123 | - |
| 2011 | 1.044 | -9,1 | 3.104 | 6,8 | 264 | 114,6 |
| 2012 | 1.287 | 23,3 | 3.214 | 3,5 | 266 | 0,8 |
| 2013 | 1.420 | 10,3 | 3.293 | 2,5 | 594 | 123,3 |
| 2014 | 1.428 | 0,6 | 3.517 | 6,8 | 786 | 32,3 |
| 2015 | 1.452 | 1,7 | 3.506 | -0,3 | 1.080 | 37,4 |
| 2016 | 1.653 | 13,8 | 3.628 | 3,5 | 1.179 | 9,2 |
| 2017 | 1.832 | 10,8 | 3.682 | 1,5 | 1.296 | 9,9 |
| 2018 | 1.910 | 4,3 | 3.728 | 1,2 | 1.402 | 8,2 |
| 2019 | 1.967* | 3,0 | 3.669 | -1,6 | 1.439 | 2,6 |
| 2020 | 1.836** | -6,7 | 3.408 | -7,1 | 1.136 | -21,1 |
*There are 1,952 students in academic doctorates and 15 in professional doctorates.
**There are 1,810 students in academic doctorates and 26 in professional doctorates.
Fonte: Elaboração própria.
The average annual growth of people who entered the professional master’s degree, from 2010 to 2019, was 31.4%, indicating intense growth in this modality. The exception is for the year 2020, in which the number of new students fell by 21.1%. In gross terms, professional master’s degrees no longer received 303 students. These were greater losses than those of academic doctoral courses (-142 students) and academic master’s (-261 students). This decrease is likely to have occurred, among other factors, due to lower demand for courses or a decrease in the number of vacancies. The consequences of this loss will still be felt in a possible reduction in the number of graduates in the future, thus jeopardizing the achievement of GNP and NEP targets.
Although the year 2020 shows a reduction in the number of enrollments, the balance, in the period analyzed, is still positive. In 2020, 162.3% more students enrolled in doctoral courses than in 2004. In master’s courses, the greater offer of courses, whether academic or professional, allowed 4,544 students to start their master’s courses in 2020, 2,117 more than in 2004. This shows a significant increase in the number of vacancies in the field of education.
Another type of graduate course began in 2019: the professional doctorate. That year, the first 15 students enrolled in a course offered by the Federal University of Rondônia (UNIR, in Portuguese). This was the only segment that did not show a decrease in 2020, having received another 26 students, 15 from UNIR and 11 from International University Center (Centro Universitário Internacional, in Portuguese), a private HEI in the South region. It is still too early to say whether it will have the same vertiginous growth observed in professional master’s degrees. A comparative study carried out by Calderón et al. (2019) on the emergence of professional doctoral courses in the world shows that many countries have already adopted the model of this type of stricto sensu graduate course, such as China, Iceland, and Australia.
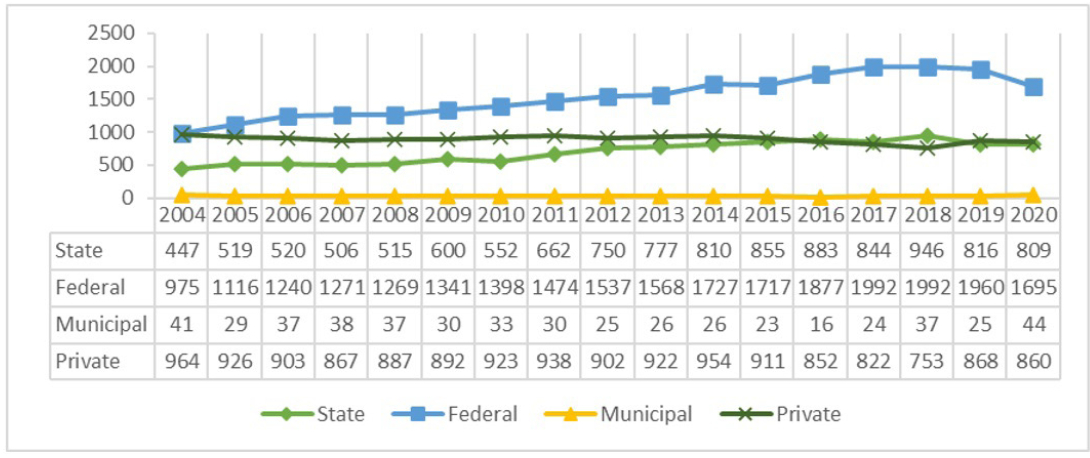
In the case of academic master’s degrees, when analyzed by legal status, there was a 10.8% decline in the entry of students in courses maintained by the private sector in the period under analysis (GRAPH 7). This decrease may occur due to the economic crisis experienced from 2014 onwards.
Source: Elaborated by the authors.
Graph 7 - Number of admissions to academic master’s courses in education by legal status, 2004-2020
The number of new enrollments in state HEIs increased significantly in the period (81.0%), surpassing that of private HEIs in 2016, but being supplanted by them, again, in 2019. In federal HEIs, there were 720 more enrollments in 2020 than in 2004. Until the year 2019, the number of new students in federal HEIs had doubled (101.0%), although it decreased by 265 in 2020. It was the biggest drop among legal status types.
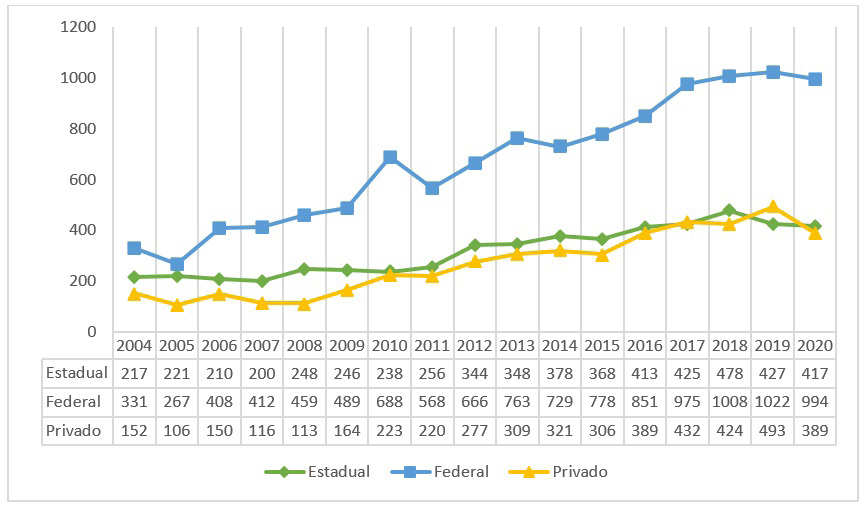
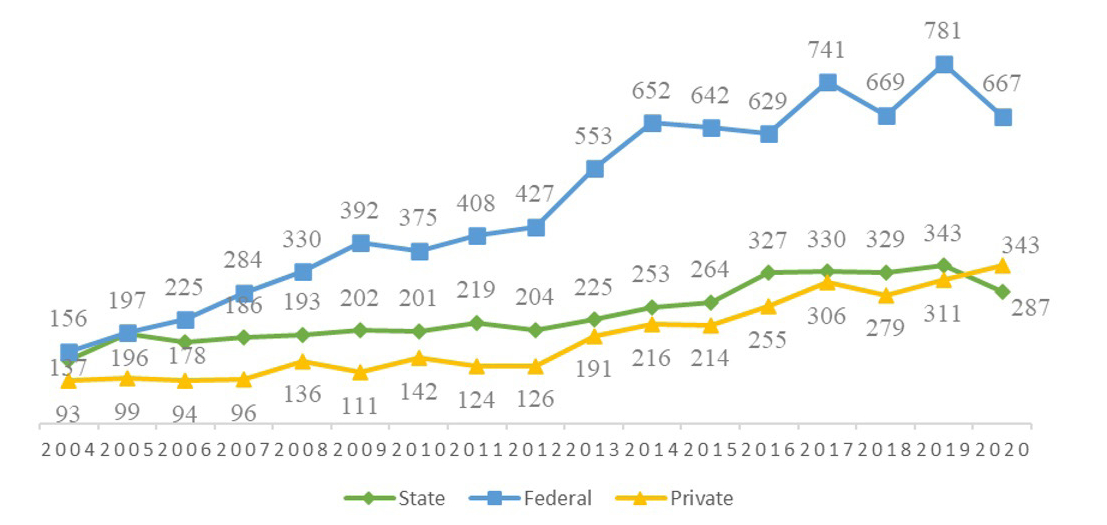
A different situation is found in relation to those who entered academic doctoral courses. Despite the irregularity of the curves in Graph 8, there was growth in the three spheres. It is observed that private HEIs invested in the verticalization of their programs, surpassing state HEIs in 2017 and 2019. The number of new enrollments in state HEIs increased by 92.2%, while in private HEIs it was 155.9%. Federal HEIs showed the greatest growth (200.3%). In 2020, the three types of HEIs showed a decrease compared to 2019, being greater in private HEIs, with 21.1% fewer admissions.
Source: Elaborated by the authors.
Graph 8 - Number of admissions to academic doctoral courses in education by legal status, 2004-2020
Note: admissions of (federal and private) professional doctorates were not considered, nor those of academic doctorates maintained by city governments, as only in 2019 did admissions begin in municipal doctorates (10 in 2019 and 10 in 2020) and in professional doctorates, which makes an analysis of the historical series, the object of this research, impossible.
Graph 9 shows the data referring to graduates, making it possible to assess the role of graduate studies in the area of education in training researchers, masters, and doctors, as well as the consequent availability of new research reports in the format of dissertations and theses.
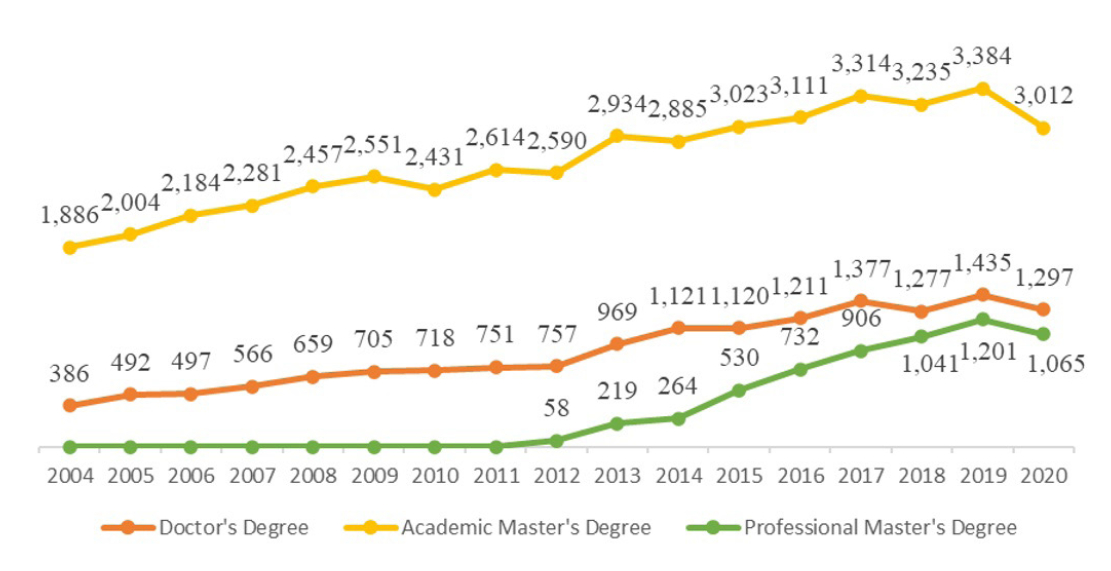
Note: There were no professional doctorate students in the years under review.
There was a significant increase in the number of graduates in the three types of courses from 2004 to 2019, mainly in professional master’s degrees (1,970.7%) and in doctoral courses (271.8%). However, it is necessary to consider that, in the case of professional master’s degrees, they only started to be granted in 2012 and the percentage, although large, was made from a very small initial base. This shows an intensive trend towards the establishment of this type of graduate program in Brazil. Bonfim, Vieira and Deccache-Maia (2018), when reflecting on the advancement of professional master’s degrees in Brazil, point out positive and negative aspects of this new graduate model, especially in the area of education and teaching, and discuss the need for constant vigilance so as not to let the proposals of professional master’s degrees fall easy prey to a purely technicist paradigm.
In 2020, however, there was a drop in the number of graduates in the three types of course. Proportionally, the most affected were professional master’s degrees, with a loss of 11.3%, compared to 2019. Academic master’s degrees are in second place, with a decrease of 11.0%. Doctorates, despite showing a lower decline rate than that of master’s degrees, still registered a reduction of 9.6% of graduated students in 2020. Although Graph 9 shows that there were other years with a decrease in the number of graduated students (doctorates and academic master’s degrees), the causes for this decrease in 2020 are certainly related, among other possibilities, to the measures to make the degree time more flexible by CAPES, including an exceptional extension of the scholarship period, due to the COVID-19 pandemic (CAPES 2020a, 2020b, 2020c).
According to the 2021 CAPES management report, this reduction was felt throughout the NGS, with losses especially for the number of graduates, thus compromising the achievement of the goals related to graduate studies in the NEP (CAPES 2021). The decreases were entirely attributable to the negative effects of the COVID-19 pandemic. The decrease in the number of graduates certainly means a delay in the defense of theses and dissertations, motivated by problems caused by the pandemic in the progress of research or by mental health problems. In a recent demand, Assunção-Luiz et al. (2021) carried out a qualitative analysis of the contents of a virtual group, via Facebook page, of graduate students and professors who discussed the difficulties inherent in doing graduate work under pandemic conditions. Among the results, there is the fact that 36.2% of the analytical corpus concerned problems with academic production and deadlines for defense and scholarships, as well as activities related to graduate cycles. It still remains to be shown that the percentage of 17.6% of the content of the discussions concerned aspects of a psychological nature, such as writing or studying block.
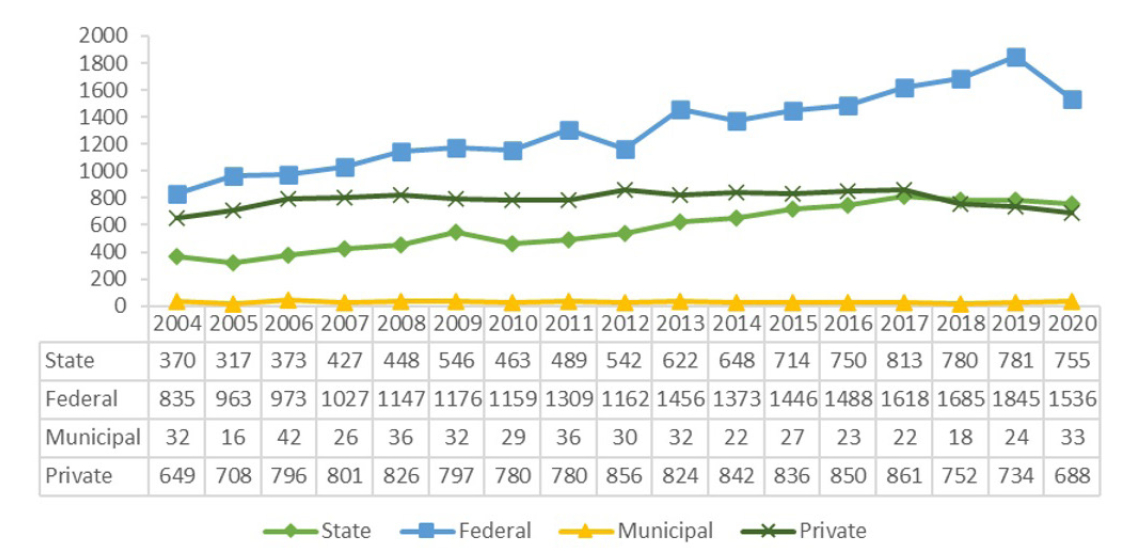
Graph 10 shows the number of doctoral degrees granted by legal status. In 2004, this number in the federal and state HEIs was quite close, with a difference of only 19 graduates in federal ones. This difference, however, has been magnified over time.
Source: Elaborated by the authors.
Graph 10 - Graduated students in doctoral courses in education by legal status, 2004-2020
As shown in Graph 8, the federal HEIs began to offer more vacancies in doctoral courses than the state ones. The result of this initiative is found in Graph 10, when it indicates the widening of the difference between the number of graduates in these two public spheres. In 2019, the difference reached 431 graduates, showing that federal HEIs held more than double the number of state HEIs. The increase in doctoral degree holders in private institutions, moreover, surpassed that of state HEIs in 2020. In fact, while federal and state HEIs had considerable decreases in 2020 (-14.6% and -16.3%, respectively), private HEIs experienced growth of 10.3%.
The federal HEIs increased their participation in the percentage of graduates in doctoral courses in education from 40.4% in 2014 to 51.4% in 2020. The private HEIs, accounted for 26.4% of the graduates in 2020, a higher percentage than that of 2004 (24.1%). On the other hand, the state HEIs were subject to a significant decrease in relation to the other HEIs, with their representation dropping from 35.5% in 2004 to 22.1% in 2020.
A different situation occurred in academic master’s degrees, especially those maintained by private HEIs, where the downward trend registered in other indicators is also shown in Graph 11. Although private HEIs graduated more masters in 2020 than in 2004, the number began to fall in 2018. In the case of public HEIs, the increase was 84.0% for federal and 104.1% for state ones. The year 2020 was a bad one for federal HEIs, registering a 16.7% decrease in the number of academic master’s degrees. Even with this decrease, public HEIs increased their participation in the number of graduates in academic master’s courses from 65.0% in 2004 to 77.2% in 2020.
Source: Elaborated by the authors.
Graph 11 - Graduated students in academic master’s courses in education by legal status, 2004-2020
Graph 12 shows graduates of professional master’s courses by legal status. As professional master’s degrees in education only started operating in 2010, the increase in the number of graduates is significant in the four spheres. Public HEIs decreased the number of graduates in 2020. Following the opposite trend, professional master’s degrees at private HEIs grew by 46.3% compared to 2019.
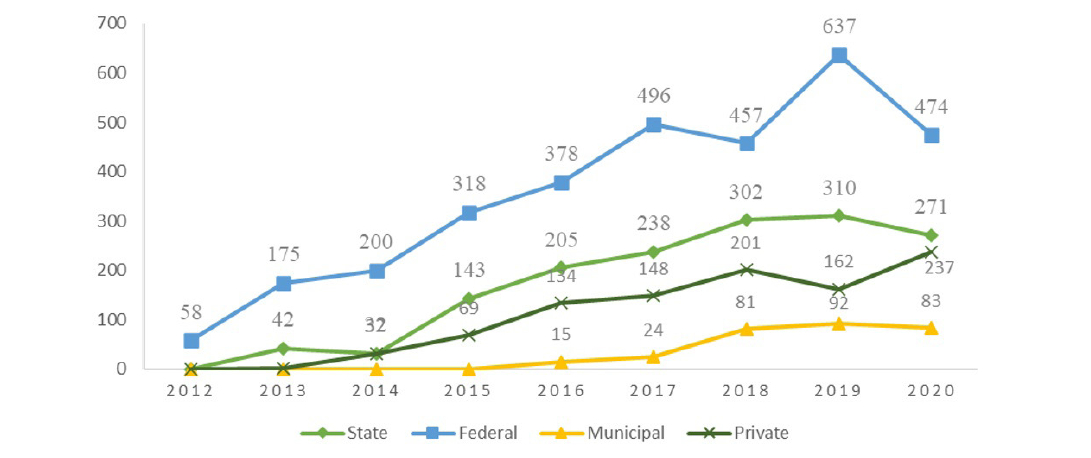
Source: Elaborated by the authors.
Graph 12 - Graduated students in professional master’s courses in education by legal status, 2012-2020
The number of graduates from each type of graduate course in education, according to the regions of Brazil, is shown in Table 7. This data reaffirms the regional differences in the country, concentrating, over the years, a greater number of graduates in the Southeast and South regions as the result of a historical heritage of asymmetries.
Table 7- Graduates in GPEs by regions of Brazil and types of course, 2004-2020
| Year | Central-West | Northeast | North | Southeast | South | ||||||||||
|---|---|---|---|---|---|---|---|---|---|---|---|---|---|---|---|
| D | AM | PM | D | AM | PM | D | AM | PM | D | AM | PM | D | AM | PM | |
| 2004 | 1 | 179 | - | 53 | 203 | - | - | 25 | - | 293 | 990 | - | 39 | 489 | - |
| 2005 | 1 | 211 | - | 78 | 253 | - | - | 47 | - | 344 | 969 | - | 69 | 524 | - |
| 2006 | 9 | 200 | - | 103 | 294 | - | - | 44 | - | 321 | 996 | - | 64 | 650 | - |
| 2007 | 10 | 252 | - | 125 | 304 | - | - | 66 | - | 339 | 998 | - | 92 | 661 | - |
| 2008 | 13 | 283 | - | 117 | 299 | - | - | 73 | - | 400 | 1.125 | - | 129 | 677 | - |
| 2009 | 38 | 250 | - | 140 | 362 | - | - | 75 | - | 389 | 1.162 | - | 138 | 702 | - |
| 2010 | 42 | 242 | - | 124 | 365 | - | - | 61 | - | 417 | 1.095 | - | 135 | 668 | - |
| 2011 | 56 | 258 | - | 127 | 432 | - | - | 87 | - | 432 | 1.125 | - | 136 | 712 | - |
| 2012 | 72 | 264 | - | 129 | 394 | - | 5 | 82 | - | 395 | 1.154 | 58 | 156 | 696 | - |
| 2013 | 78 | 296 | 35 | 153 | 468 | 56 | 14 | 105 | - | 518 | 1.271 | 125 | 206 | 794 | 3 |
| 2014 | 89 | 265 | 5 | 217 | 428 | 43 | 18 | 80 | - | 538 | 1.286 | 180 | 259 | 826 | 36 |
| 2015 | 99 | 287 | 40 | 202 | 471 | 137 | 24 | 114 | 13 | 564 | 1.289 | 254 | 231 | 862 | 86 |
| 2016 | 79 | 295 | 38 | 208 | 499 | 200 | 26 | 133 | 14 | 594 | 1.394 | 366 | 304 | 790 | 114 |
| 2017 | 96 | 352 | 13 | 257 | 564 | 238 | 42 | 187 | 26 | 648 | 1.378 | 469 | 334 | 833 | 160 |
| 2018 | 101 | 335 | 24 | 226 | 547 | 302 | 34 | 228 | 16 | 592 | 1.351 | 511 | 324 | 774 | 188 |
| 2019 | 137 | 377 | 46 | 262 | 519 | 362 | 30 | 266 | 51 | 681 | 1.393 | 559 | 325 | 829 | 183 |
| 2020 | 88 | 320 | 60 | 226 | 532 | 217 | 33 | 203 | 13 | 622 | 1.239 | 599 | 328 | 718 | 176 |
D – Doctor’s Degree, AM – Academic Master’s Degree, PM – Professional Master’s Degree.
Source: Elaborated by the authors.
These asymmetries are even felt in the declines recorded in 2020. The North (-28.2%), Central-West (-16.4%), and Northeast (-14.7%) regions recorded the largest decreases in the number of new graduates. When these decreases are also analyzed by type of course, the professional master’s degree courses in the North region shows the most significant decline (74.5%), followed by professional master’s degree courses in the Northeast (40.1%) and doctoral courses in the Central-West (35.8%). Despite the decrease observed in 2020, there was a significant expansion of graduates in all Brazilian regions, from 2004 to 2020 – mainly in the North region, which only had its first PhDs awarded in 2012. This reality is in line with the growth in the number of students observed in Table 2 and 3, as well as meeting goals 13 and 14 of the NEP, regarding the increase in the number of masters and doctors in the higher education and the gradual increase in the number of enrollments, with the objective of reaching 25,000 doctors and 60,000 masters annually (BRASIL 2014).
Final considerations
This essay proceeded from an examination of the quantitative expansion of stricto sensu graduate studies in the area of education in Brazil. In this way, it was limited to data related to the set of students (students, number of admissions, graduates), listing differences due to legal statutes, types of course, and Brazilian regions, comprising the period from 2004 to 2020.
Public policies to promote and support graduate studies in Brazil – expressed in the various NGPs drawn up since the 1970s – seem to have had an effect in the area of education. The data allows us to state that, from 2004 to 2020, there was a growth of 143.9% in the number of graduate students, 104.0% in admissions and 136.5% in graduates – despite the changes that occurred in the Federal Government, which were four in total.
From 2004 to 2020, it was possible to verify the verticalization of the programs, with a substantial increase in the number of students, people who entered and graduated in doctoral courses. The area of education has also expanded through diversification, with the adhesion of many HEIs, especially public ones, to professional master’s degrees and, in 2019, to professional doctorates as well. The initial resistance to professional programs seems to have been overcome, although there is still criticism about this ongoing education model at the NGS.
The fear of expansion through exacerbated privatization, as occurred in undergraduate courses, was not realized in graduate courses. Even professional courses, apparently more attractive to the private sector, flourished in greater numbers in public institutions. Therefore, in 2020, contrary to the fears of some, 78.9% of graduate students in education were in public HEIs, and in professional master’s degrees, this figure reached 84.8%.
A more common theme in recent NGPs is regional asymmetries, especially in doctoral courses. These asymmetries were mitigated during this period. This shows the government’s effort to reduce such asymmetries and to make possible a more accessible graduate offer in the various regions of the country. This also helps in increasing the number of doctors residing in the regions and, consequently, in the growth of research and partnerships with the productive sector.
In conclusion, this study captured the reduction in several of the stricto sensu graduate indicators in the area of education in 2020. The total number of students had a 0.5% reduction, with professional master’s degree courses having the most significant loss (-4.0%). This was possibly largely due to the decline in the number of admissions (-21.1%). Even the overall number of graduates fell by 10.7%, with greater losses for the public sector. According to CAPES (2021), these decreases are entirely attributed to the negative effects of the COVID-19 pandemic.
However, it is curious that – despite the pandemic crisis causing financial losses with the paralysis of several sectors of the economy – the losses in the public sector, in general, were greater than in the private sector. Oftentimes, the private sector even achieved improvement in its indicators; for example, with regard to the general number of students, while the public sector had a decrease of 1.6% in the total number of students, the private sector increased by 3.7%. When looking at the data of those who started the courses, it can be seen that both had losses; however, public HEIs contracted by 10.2%, while the private sector decreased by 8.4% in 2020. Private HEIs also recorded growth of 5.1% in the number of graduates, driven by professional master’s degree courses.
The differences found between the public and private sectors allow us to formulate an alternative hypothesis: that these recorded decreases were caused not only by the pandemic, but also by the policy of cutting funds adopted by the government of President Jair Bolsonaro. About this, the CAPES report (2021) shows that there is a retraction in the agency’s expenses in the years 2020 and 2021. In 2020 the reduction was 16.0% in the committed amount, compared to 2019, which represents more than 600 million less investment. In 2021, the reduction reached 19.0%, when compared to 2019. As a result, it is understood that it is necessary to monitor these indicators in the coming years, in order to put to the test which of the causes listed herein – or whether both, to some extent – contributed to this interruption in the process of expansion of graduate studies in the area of education, which compromises both the goals of the NEP and the spirit of expanding opportunities that has always guided the NGPs.
It is expected that this analysis will contribute to support the decision-making process of public policy makers and managers. Moreover, this is a discussion that makes room for future research that expands and problematizes the results expressed in this text.
REFERENCES
ASSUNÇÃO-LUIZ, Alan Vinícius et al. Impacto da Covid-19 em alunos de pós-graduação. Olhares & Trilhas, Uberlândia, v. 30, n. 2, p. 538-554, abr./jun. 2021. [ Links ]
BAETA NEVES, Abílio Afonso. A pós-graduação no Brasil. International Journal of Business & Marketing, São Paulo, v. 5, n. 2, p. 23-29, 2020. [ Links ]
BALBACHEVSKY, Elisabeth. A pós-graduação no Brasil: novos desafios para uma política bem sucedida. In: BROCK, Colin.; SCHWARTZMAN, Simon. Os desafios da educação no Brasil. v. 1. Rio de Janeiro: Nova Fronteira, 2005. p. 275-304. [ Links ]
BARROS, Elionora Cavalcanti de; VALENTIM, Márcia Cristina; MELO, Maria Amélia Aragão. O debate sobre o mestrado profissional na CAPES: trajetória e definições. Revista Brasileira de Pós-Graduação, Brasília, DF, v. 2, n. 4, p. 124-138, jul. 2005. [ Links ]
BONFIM, Alexandre Maia do; VIEIRA, Valéria; DECCACHE-MAIA, Eline. A crítica da crítica dos mestrados profissionais: uma reflexão sobre quais seriam as contradições mais relevantes. Ciência & Educação., Bauru, v. 24, n. 1, p. 245-262, 2018. [ Links ]
BRASIL. Plano Nacional de Educação PNE 2014-2024. Brasília, DF: MEC, 2014. [ Links ]
BRASIL. Plano Nacional de Pós-Graduação - PNPG 1975/1979. Brasília, DF: MEC/CAPES, 1975. [ Links ]
BRASIL. Plano Nacional de Pós-Graduação - PNPG 1986/1989. Brasília, DF: MEC/CAPES, 1986. [ Links ]
BRASIL. Resolução nº 510, de 7 de abril de 2016. Dispõe sobre as normas aplicáveis a pesquisas em Ciências Humanas e Sociais. Diário Oficial da União, Brasília, DF, seção 1, n. 98, p. 44-46, 24 maio 2016. [ Links ]
BRASIL. Coordenação de Aperfeiçoamento de Pessoal de Nível Superior. Plano de Nacional de Pós-graduação - PNPG 2011-2020. v. 1. Brasília, DF: CAPES, 2010. [ Links ]
CALDERÓN, Adolfo-Ignácio et al. Doutorado profissional em educação: tendências em universidades de classe mundial contextualizadas nos rankings acadêmicos internacionais. Práxis Educativa, v. 14, n. 1, p. 138-162, 2019. [ Links ]
CAPES. Coordenação de Aperfeiçoamento de Pessoal de Nível Superior. Dados abertos. Brasília, DF: Capes, 2021. Disponível em: https://dadosabertos.capes.gov.br/ Acesso em: 12 dez. 2021. [ Links ]
CAPES. Coordenação de Aperfeiçoamento de Pessoal de Nível Superior. Portaria nº 36, de 19 de março de 2020. Brasília, 2020a [ Links ]
CAPES. Coordenação de Aperfeiçoamento de Pessoal de Nível Superior. Portaria nº 55, de 29 de abril de 2020. Brasília, DF: Capes, 2020b. [ Links ]
CAPES. Coordenação de Aperfeiçoamento de Pessoal de Nível Superior. Portaria nº 121, de 19 de agosto de 2020. Brasília, 2020c. [ Links ]
CAPES. Coordenação de Aperfeiçoamento de Pessoal de Nível Superior. Portaria nº 209, de 21 de outubro de 2011. Brasília, DF: Capes, 2011. [ Links ]
CAPES. Coordenação de Aperfeiçoamento de Pessoal de Nível Superior. Relatório da avaliação quadrienal 2017: educação. Brasília, DF: Capes, 2017. [ Links ]
CAPES. Coordenação de Aperfeiçoamento de Pessoal de Nível Superior. Relatório de gestão 2018. Brasília, DF: Capes, 2018. [ Links ]
CAPES. Coordenação de Aperfeiçoamento de Pessoal de Nível Superior. Relatório de gestão 2021. Brasília, DF: Capes, 2021. [ Links ]
CASTRO, Rosane Michelli de. A pós-graduação em educação no Brasil: alguns aspectos à luz de estudos realizados na área. Educação em Revista, Belo Horizonte, v. 28, n. 4, p. 263-287, dez. 2012. [ Links ]
CIRANI, Claudia Brito Silva; CAMPANARIO, Milton de Abreu; SILVA, Heloisa Helena Marques. A evolução do ensino da pós-graduação senso estrito no Brasil: análise exploratória e proposições para pesquisa. Avaliação, Sorocaba, v. 20, n. 1, p, 163-189, mar. 2015. [ Links ]
COHEN, Louis; MANION, Lawrence; MORRISON, Keith. Research methods in education. 8. ed. London: Routledge, 2018. [ Links ]
CUNHA, Luiz Antônio. A universidade temporã: o ensino superior, da colônia à Era Vargas. 3. ed. São Paulo: Unesp, 2007. [ Links ]
CUNHA, Luiz Antônio. A retomada de compromissos históricos aos 30 anos da ANPEd. Revista Brasileira de Educação, Rio de Janeiro, v. 13, n. 37, p. 168-172, jan./abr. 2008. [ Links ]
CURY, Carlos Roberto Jamil. Quadragésimo ano do Parecer CFE nº 977/65. Revista Brasileira de Educação, Rio de Janeiro, n. 30, p. 7-20, 2005. [ Links ]
GATTI, Bernadete Angelina. Reflexão sobre os desafios da pós-graduação: novas perspectivas sociais, conhecimento e poder. Revista Brasileira de Educação, Rio de Janeiro, n. 18, p. 108-116, set./dez. 2001. [ Links ]
GONDRA, José Gonçalves; NUNES, João Batista Carvalho; MARTINS, Marcos Francisco. Fórum de Coordenadores de Programas de Pós-Graduação em Educação (FORPREd/ANPEd): história, configurações, desafios. Revista Brasileira de Educação, Rio de Janeiro, v. 23, e230044, p. 1-28, 2018. http://dx.doi.org/10.1590/S1413-24782018230044 [ Links ]
GOUVÊA, Fernando César Ferreira. A institucionalização da pós-graduação no Brasil: o primeiro decênio da CAPES (1951-1961). Revista Brasileira de Pós-Graduação, Brasília, DF, v. 9, n. 17, p. 373-397, jul. 2012. [ Links ]
HOSTINS, Regina Célia Linhares. Os Planos Nacionais de Pós-graduação (PNPG) e suas repercussões na Pós-graduação brasileira. Perspectiva, Florianópolis, v. 24, n. 1, p. 133-160, jan/jun 2006. [ Links ]
IBGE. Instituto Brasileiro de Geografia e Estatística. Projeções da população do Brasil e unidades da federação, por sexo e idade: 2010-2060. Brasília, DF: IBGE, 2020. [ Links ]
MOREIRA, Antônio Flávio. A cultura da performatividade e a avaliação da pós-graduação em educação no Brasil. Educação em Revista, Belo Horizonte, v. 25, n. 3, p. 23-42, dez. 2009. [ Links ]
MOREIRA, Maria Lígia; VELHO, Lea. Pós-graduação no Brasil: da concepção “ofertista linear” para “novos modos de produção do conhecimento” – implicações para a avaliação. Avaliação, Sorocaba, v. 13, n. 3, p. 625-645, nov. 2008. [ Links ]
NUNES, João Batista Carvalho. Ética em pesquisa nas dissertações e teses da área de educação: um olhar para a região Nordeste. Práxis Educativa, Ponta Grossa, v. 16, e2117319, p. 1-22, 2021. https://doi.org/10.5212/PraxEduc.v.16.17319.065 [ Links ]
PAULA, Maria de Fátima de. A formação universitária no Brasil: concepções e influências. Avaliação, Campinas, v. 14, n. 1, p. 71-84, mar. 2009. [ Links ]
R CORE TEAM. R: A language and environment for statistical computing. Vienna [s. n.], 2021. Available at: https://www.r-project.org/ Accesso em: 30 Jul. 2022. [ Links ]
RENOEN. Rede Nordeste de Ensino. Página inicial. [S. l.: s.n.], 2021. Disponível em: https://www.renoen.net.br/ Acesso em: 30 nov. 2021. [ Links ]
RIBEIRO, Renato Janine. O mestrado profissional na política atual da CAPES. Revista Brasileira de Pós-Graduação, Brasília, DF, v. 2, n. 4, p. 8-15, jul. 2005. [ Links ]
SAVIANI, Demerval. História das ideias pedagógicas no Brasil. 2. Ed. Campinas: Autores Associados, 2008. [ Links ]
SAVIANI, Demerval. Política e gestão da pós-graduação em educação no Brasil. Comunicações, Piracicaba, v. 10, n. 2, p. 93-103, dez. 2003. [ Links ]
SEVERINO, Antônio Joaquim. A pesquisa na pós-graduação em educação. Revista Eletrônica, São Carlos, v. 1, n. 1, p. 31-49, set. 2007. [ Links ]
STEINER, João E. Qualidade e diversidade institucional na pós-graduação brasileira. Estudos Avançados, São Paulo, v. 19, n. 54, p. 341-365, ago. 2005. [ Links ]
TIGHT, Malcom. Documentary research in the social sciences. Thousand Oaks: Sage, 2019. [ Links ]
Data availability: the entire data set supporting the results of this study is available in the CAPES open data repository, which can be seen at: https://dadosabertos.capes.gov.br/dataset?organization=diretoria-de-avaliacao
3- Data available at: https://geocapes.capes.gov.br/geocapes/ Last accessed: 5th November 2022.
Received: April 14, 2022; Accepted: December 19, 2022; Revised: October 11, 2022
 Este é um artigo de acesso aberto distribuído sob os termos de uma Licença Creative Commons
