


 texto em
  Inglês (pdf)
 Artigo em XML
 Enviar este artigo por email
 Permalink
INTRODUCTION
In spite of its privileged geographical position in Latin America and the fact that it is the 9th world economy l1, Brazil is one of the most unequal countries in the world2. Brazil was an agricultural colony of Portugal based on slave labor and received half of the world trade of enslaved Africans, being the last country in the Americas to abolish slavery3. More than 25% of the Brazilian population comprised enslaved black people. The understanding of the Brazilian economic system must consider its colonial history and its peripheral position in the world economy4.
Although considered a racial democracy5)-(8, Brazil maintains racism as an important landmark in the socioeconomic structure9)-(13. The impact of the enslavement of black and brown people allows us to understand race as an important defining factor of Brazilian social mobility. Individuals from the lower economic classes experience inequalities - related to racial differences - when seeking opportunities in a free market society, in which the social ascension of white people prevails14.
It is important to say that Brazilian racism differs from that observed in the United States of America (USA), where the rule of hypodescent determines social relations15), (16. In Latin America, especially in Brazil, encouraging miscegenation was a powerful tool for demobilizing non-whites17), (18. Whereas whites of the high social strata have the same interest and class situation, the others are divided by race and social issues, making the population a highly fragmented one. It is this small ruling group that has the tools to write the history of the country and maintain its status quo19.
Access to the university and medical education
Brazil maintains a post-colonial legacy of socioeconomic and racial inequalities regarding the access to university. Socially valued jobs are perpetuators of inequalities and not of democratization20), (21. This is more evident in courses of greater social prestige, such as Medicine22, traditionally attended by whites, the wealthy and the upper middle class22)-(24, although 54% of the Brazilians consider themselves as being of black or brown25. In São Paulo, among the graduating medical population, only 0.9% are black or brown26. Thus, it is possible to infer that these professionals do not share cultural characteristics with their assisted population.
In the USA, it has become evident that the higher the percentage of non-white professionals in a health unit, the more culturally appropriate their behavior is, making it possible to reduce health disparities27. With the National Curriculum Guidelines for Medicine, the Brazilian federal government understood that a culturally-competent professional is trained to be exposed to diversity28, and the curriculum “must also contribute to the understanding, interpretation, preservation, reinforcement, promotion and diffusion of national and regional, international and historical cultures, in a context of pluralism and cultural diversity”28.
According to the 2016 higher education census, in Brazil only 14.05% of the teachers are brown, 1.81% are black and 0.12% are indigenous29. In this situation, it is worth asking ourselves how we can possibly train culturally-competent professionals if the students are not exposed to diversity in the classroom.
Affirmative Action Policy in Higher Education
Among the initiatives to deal with this scenario, the social and racial quotas occurred under pressure from the Brazilian organized civil society18. Since the late 1990s, state governments and the federal government have been working to develop public policies to respond to this social demand. In 1999, the federal government created the ‘Student Financing’ (Fies) strategy30. In 2003, Universidade de Brasília (UNB) and Universidade Estadual do Rio de Janeiro (UERJ) started the process of establishing quotas reserved for black and indigenous individuals and students from public schools. These initiatives were followed in 2005 by Universidade Estadual de Campinas (Unicamp) and in 2006 by Universidade Estadual de São Paulo (USP), by applying the policy of quotas in all of them31.
In the 2010s, the federal sphere unified the university admission exams through the Unified Selection System31. Two years later, Law n. 12.711/201232 defined that federal public universities should adopt affirmative action policies, guaranteeing access to groups that have been historically excluded from the universities. Such policies are institutional efforts aimed at improving the opportunities for these socially excluded groups33, ensuring equal opportunities, a basic principle of a healthy meritocratic capitalist economy.
Affirmative policies originated in the early 20th century in India, due to the inequality of the caste system34, and have been adopted by more countries in the last 100 years. In the USA, such policies were initiated during the Kennedy administration through Executive Order n. 1092533 in 1961, which resulted in the Presidential Committee for Equal Employment Opportunity.
In Brazil, the leadership of the anti-racist movement led the political struggle for the racial quota system18. Although the initial demand from the organized civil society was a racial issue, the debate was thwarted by conflicting interests. The Brazilian government, linked to the white elite and the discourse of a racial democracy, redirected the discussion towards the economic bias35.
Therefore, Law n. 12,711 / 2012 marginally incorporated affirmative racial actions. According to this Law, 50% of the vacancies are reserved for public school students, the main inclusion criterion. Moreover, there are specific sub-quotas for blacks, browns, indigenous people, people with low income and the physically disabled ones36. During the first seven years of its existence, greater economic democratization of access to most higher education courses was observed20, as it was observed in previous experiences such as in Unicamp31 and UERJ. In the latter, there was even an increase in the associated curricular performance37. However, Medical school, in particular, remains the most resistant to change and the fulfillment of the law objective, and its student profile has changed but little20), (22), (24.
Study issue
Our hypothesis is that the law of affirmative policies in higher education (Law n. 12.711/2012)36 selectively included poor white people in medical schools. If this is true, the law that would reduce racial inequities in access to medical education in Brazil - by bringing doctors closer to the Brazilian population profile - failed to address the structural racism of the Brazilian society38.
This failure shows a double overlap:
On the one hand, the non-recognition, by the assisted population, of the professional authority of non-white doctors that come from the lower social strata of society. Lidola e Borges39 - in an ethnographic study on the connectivity between Cuban doctors in a slum in the city of Rio de Janeiro - observed that residents did not recognize black, and apparently poor professionals, as legitimate medical authorities. This would be due, according to the authors, to post-colonial health care legacies in Brazil that mediate the moral and professional legitimacy relationships between the population and health professionals.
On the other hand, the identity disconnection between professionals and the population may result in the failure to recognize the health needs of black and poor individuals.
Ferreira Filho40 emphasizes the importance of empathy at the bedside, in which good practices are the essence of medical art. The author uses the term ‘empathy’ as the capacity to be aware of someone else’s feelings and emotions. Hence, the importance of understanding racism and poverty. The National Policy for Comprehensive Health Care of the Black Population41 recognized social and racial inequalities in Brazil as factors that interfere with health care. Racism is a fundamental determinant in health care access and quality9), (42), (43. It is also known that black Brazilians have lower life expectancy and lower quality of health indicators44), (45.
Batista et al.38 stated that racism is related to the quality of care, the profiles and estimates of infant mortality, preventable suffering or early deaths, mortality rates and profiles, maternal mortality indicators and coefficients. The racial bias of the medical staff may, heuristically, be co-responsible for health inequalities46)-(49.
The present study is a pioneer in the analysis of the effectiveness of affirmative social and racial affirmative policies for black and poor students in medical courses in the West. Its objective was to assess changes in the racial and social profile of those entering medical school in the first five years of policy implementation; we chose the student body of the School of Medicine of a public university in the state of Rio de Janeiro.
MATERIALS AND METHODS
This is a census study that mobilized two sociological categories: social class and race. Our research describes the socioeconomic and racial profile of medical students at a public university in Rio de Janeiro, enrolled between 2013 and 2017, a period determined for Brazilian federal universities to change from the system of broad competition to that of social quotas. We analyzed the data from race/skin color and social class categories independently. The census participants were all students who were actively-enrolled medical students and entered the university from 2013 to 2017 through the broad competition system, as well as those transferred from other institutions within the same period.
Between January and July 2018, we applied an anonymous, structured, and self-filled questionnaire extracted from the Socioeconomic Questionnaire applied at the National Student Performance Exam (ENADE, Exame Nacional de Desempenho de Estudantes)50 in 2015, the last year of the exam for medical students. ENADE is a tool used by the federal government to assess the knowledge of all students at public universities and includes a socioeconomic questionnaire, which has a census characteristic. We chose this model because it has already been validated and tested at national level. Small adaptations were made to meet the variables listed in the research, eliminating or modifying questions that were outside the study scope. The assessed variables were: age, gender, race/skin color, school background in high school, family income, parental level of schooling, parental higher education status, receiving assistance and/or student permanence policies and employment status during the course period.
We performed a descriptive analysis, in which the data were entered twice and tabulated in Excel® spreadsheets (version 2016) by different team members, and the spreadsheets were converted to a database using IBM SPSS®. We carried out the sample description by simple frequency in each variable. Pearson’s chi-square test was used to calculate associations between the variables: monthly family income, receiving or not receiving financial assistance from the family, skin color, school background in high school and level of schooling of the family and, specifically, parental level of schooling.
To protect the collective anonymity of the participants, we omitted the name of the researched university. Students from the selected period (2013-2017) were contacted during test periods, when we had access to the largest number of students at the same time. We obtained the consent from the course coordinators and teachers of the disciplines in which the census was applied. The questionnaire was distributed at the beginning of the tests and collected anonymously at the end.
Regarding the ethical standards of research including human beings, the study was based on Resolution 510 of the National Health Council of April 7, 2016, article 1, item IV, which exempts census research in Human and Social Sciences from registration in the CEP/CONEP system.
RESULTS
According to data collected at the Coordination of the Medical Course secretariat, a total of 835 students were enrolled when the questionnaires were applied. Of these, 813 student enrollments were active and 22 inactive. A total of 748 questionnaires were applied to the group of 813 students who were actively enrolled, corresponding to 93.1% of the student body. The other 65 were not reached because they were absent during the tests. Of those reached, 90 questionnaires were returned blank, totaling an effective coverage of 658 students (85.4%) (Data not shown in Tables).
Population profile
Table 1 lists the relative frequencies of the students for the variables: age group, gender identity, skin color, higher education degree in the family, parental education and schooling level of father and mother. The 658 responses for the age group show that 68.4% of the students in the sample are aged between 25 and 30 years. Age ranged from 18 to 41 years, with a mean of 23.6 (standard deviation = 3.1 years). As for gender, the question was asked by self-declaration and open. Of the 657 valid responses, 49% identified themselves as being males and 51% as females.
Table 1 Description of the sociodemographic variables of students at a School of Medicine in the state of Rio de Janeiro. Rio de Janeiro, 2018
| Studied characteristics | n | % |
| Age Group | ||
| Up to 20 years | 73 | 11,1 |
| From 21 to 25 years | 451 | 68,4 |
| From 25 to 30 years | 111 | 16,8 |
| 31 years or older | 23 | 3,5 |
| Gender | ||
| Male | 322 | 49 |
| Female | 335 | 51 |
| Skin Color | ||
| White | 473 | 69,9 |
| Black | 22 | 3,2 |
| Yellow | 18 | 2,7 |
| Brown | 162 | 23,9 |
| Indigenous | 2 | 0,3 |
| Paternal Schooling | ||
| None | 2 | 0,3 |
| 1st segment of Elementary school | 50 | 7,4 |
| 2nd segment of Elementary school | 40 | 5,9 |
| Regular High School | 147 | 21,8 |
| Technical school | 53 | 7,9 |
| University/College | 243 | 36 |
| Postgraduate School | 140 | 20,7 |
| Maternal Schooling | ||
| None | 0 | 0 |
| 1st segment of Elementary school | 28 | 4,2 |
| 2nd segment of Elementary school | 34 | 5 |
| Regular high school | 129 | 19,4 |
| Technical school | 34 | 5,1 |
| University/College | 267 | 40,1 |
| Postgraduate School | 174 | 26,1 |
| Higher education degree in the family | ||
| Yes | 585 | 86,5 |
| No | 91 | 13,5 |
| Parent’s Higher Education | ||
| Both have | 309 | 46,4 |
| Only one has | 201 | 30,2 |
| Neither parent has | 156 | 23,4 |
Source: Elaborated by the authors
We have divided the 677 valid responses for the skin color item in each of the answer options. The profile found was mostly white (69.87%), followed by browns (23.78%) who together account for almost all students. Self-declared black students comprised 3.2%; yellow, 2.7%; those who declared themselves indigenous represent only 0.3% of the total participants. As this value was not statistically relevant, we made the methodological option of analyzing the data only with the white, yellow, brown and black categories, excluding indigenous people.
When asked if anyone in the family, regardless of degree of kinship, had a higher education diploma, students provided 676 responses, of which 86.5% were affirmative. In contrast, 13.5% of students said they were the first in their families to enter a university.
As for the level of paternal and maternal schooling, 666 responses were obtained. The results were aggregated into three variables: father and mother with higher education, which corresponded to 46.4%; only father or mother, with 30.2% and neither father nor mother with Higher Education degree, 23.4% of students.
Table 2 describes the variables related to the financial status of the students participating in the census. We evaluated monthly family income, housing conditions, personal financial status, work status, whether the student was receiving permanent assistance and was a scholarship recipient. The monthly family income, in Brazilian Reais (R$), was described in numbers of minimum wages received, taking into account the national value on 01/01/2018 and subsequently transformed into an annual income in US dollars (US$), with the exchange rate of 01/06/2018. We had 673 responses, in which 44.3% of the participants declared an annual income between US$ 8,640.00 and US$ 28,760.00; 42.6%, above US$ 28,760.00 and only 13.1% was in the lowest annual income stratum, up to US$ 8,640.00.
Table 2 Description of the variables related to the financial status of medical students at a medical school in the state of Rio de Janeiro. Rio de Janeiro, 2018. (n = 685)
| Studied Characteristics | n | % |
| Annual family income | ||
| Up to US$ 4,320.00 | 32 | 4.8 |
| From US$ 4,320.00 to US$ 8,640.00 | 56 | 8.3 |
| From US$ 8,640.00 to US$ 12,960.00 | 79 | 11.7 |
| From US$ 12,960.00 to US$ 17,280.00 | 78 | 11.6 |
| From US$ 17,280.00 to US$ 28,800.00 | 141 | 21 |
| From US$ 28,800 to US$ 86,400 | 215 | 31.9 |
| Above US$ 86,400.00 | 72 | 10.7 |
| Financial status | ||
| No income and expenses are funded by government programs | 23 | 3.4 |
| No income and expenses are supported by the family | 542 | 79.2 |
| Has income, but the expenses are supported by the family | 95 | 13.9 |
| Has income and does not need help | 11 | 1.6 |
| Has income and contributes to the support of the family | 10 | 1.5 |
| Main responsible for the support of the family | 3 | 0.4 |
| Work status | ||
| Does not work | 617 | 90.1 |
| Works eventually | 35 | 5.1 |
| Works up to 20h/week | 21 | 3.1 |
| Works from 21h to 40h/week | 10 | 1.5 |
| Works 40h/week or more | 2 | 0.3 |
Source: Elaborated by the authors
Of the 684 who answered about their personal financial status, 79.2% has no income of their own and their expenses were supported by the family. Regarding the work status, 685 answered the question, showing that 90.1% of the students during the assessed period, did not have a paid activity, being full-time students. answers
Table 3 shows the variables related to the academic trajectory of the assessed students. We observed that 85.2% graduated from traditional high schools and 13% from technical schools (675 responses); 60.5% came from private schools and 35.1% from public schools (729).
Table 3 Description of the variables related to the academic trajectory of the students from a Medical School in the state of Rio de Janeiro. Rio de Janeiro, 2018.
| Studied characteristics | n | % |
| High school modality | ||
| Traditional High School | 575 | 86,2 |
| Technical school | 89 | 13,1 |
| Youth and Adult Teaching / Supplementary school | 5 | 0,7 |
| Another modality | 6 | 0,9 |
| Type of school where the student attended high school | ||
| All years in a public school | 288 | 35,1 |
| All years in a private school | 411 | 60,5 |
| All years abroad | 12 | 1,8 |
| Most years in a public school | 18 | 2,7 |
| University admission method | ||
| Broad competition | 424 | 65,9 |
| Public school | 86 | 13,4 |
| Public school and income | 48 | 7,5 |
| Public school, income and race | 41 | 6,4 |
| Public school, income and disability | 0 | 0 |
| Public school, income, race and disability | 3 | 0,5 |
| Public school and race | 37 | 5,6 |
| Public school and disability | 1 | 0,2 |
| Public school, race and disability | 3 | 0,5 |
Source: Elaborated by the authors
Regarding the method of admission at the university, the data collected were divided into each of the admission modalities provided for by Law n. 12.711/1232. Of the 643 valid responses, 65.9% declared they entered university through broad competition and 34.1% through affirmative action policies. After isolating the specification of quotas compared to the total number of students, we observed that the majority entered university through broad competition.
Among those benefiting from the quotas, the main forms of admission were, in descending order: attended only public school; attended public school, with an annual income up to US$ 8,640.00; attended public school, with an annual income up to US$ 8,640.00 and black or indigenous; attended public school and black or indigenous, regardless of income.
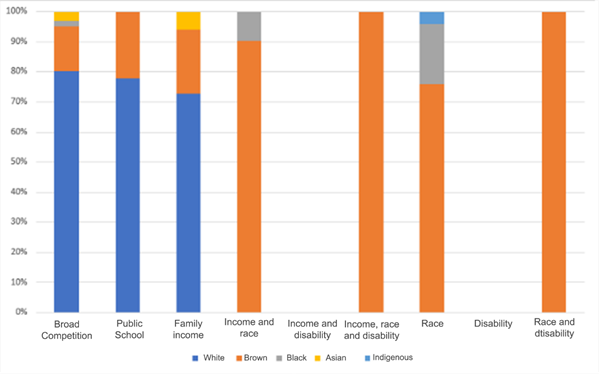
Chart 1 shows the racial profile of each of the modalities. In the admission mode through broad competition, whites predominate, with 82%; through the public school modality, regardless of other factors, they comprise 76% and through the public-school modality with income factor, it comprises 71%. In the modalities with mandatory racial component, there was a clear predominance of browns. Regarding the access through public school with an exclusively racial approach, 77% of the freshmen declared themselves to be brown. Considering the racial and income profiles, browns represented 84% of the answers. Two of the three admissions of people with disabilities with an racial approach were individuals that declared as brown.
Source: Elaborated by the authors
Chart 1 Distribution of the absolute frequency of students according to race by type of admission to the School of Medicine (2013-2017). State of Rio de Janeiro, Brazil, 2018
Only two students identified themselves as indigenous; one entered university exclusively through the racial quota and the other through broad competition. Only one student (white) entered through the modality dedicated exclusively to the disabled and none entered through the modality for the disabled subject to income.
Comparative analysis of the categories social class and race/skin color
Regarding the family’s financial support, 96.5% of broad competition students receive it, in comparison to 90% of those who entered through the quota system. Among the broad competition students, 3.5% do not receive this support, in comparison to 10% of those who entered through the quota system. Although the difference is small, students who entered university through the quota system, regardless of the modality, have a higher proportion of those who do not receive help. When assessing the financial situation of the family, 3.9% of the broad competition students have an annual income of up to US$8,640.00, while among the quota students, they represent 27.6%. Among the broad competition students, 38.1% have an annual family income between US$8,640.00 and US$28,760.00 against 57.6% of the quota students (Table 4).
Table 4 Association between sociodemographic/socioeconomic characteristics and type of admission of students at a medical school in the state of Rio de Janeiro, based on Pearson’s chi-square test. Rio de Janeiro, 2018.
| Studied characteristics | Type of Admission | p-value | |
| Broad Competition | Affirmative action | ||
| n (%) | n (%) | ||
| Type of High school | |||
| Private school | 385 (92.5) | 0(0) | <0.0001 |
| Public school | 31 (7.5) | 217 (100.0) | |
| Receives financial support from the family | |||
| Yes | 408 (96.5) | 197 (90.0) | 0.001 |
| No | 15 (3.5) | 22 (10.0) | |
| Annual family income | |||
| Up to $8,640 | 16 (3.9) | 60 (27.6) | <0.0001 |
| Between $8,640 and $28,760 | 158 (38.1) | 125 (57.6) | |
| Above $28,760 | 241 (58.1) | 32 (14.7) | |
| Scholarship recipient | |||
| Yes | 170 (40.3) | 72 (33.0) | 0.073 |
| No | 252 (59.7) | 146 (67.0) | |
| Parental Higher Education | |||
| Both have | 242 (57.9) | 53 (24.7) | <0.0001 |
| Only one has | 121 (28.9) | 71 (33.0) | |
| Neither has | 55 (13.2) | 91 (42.3) | |
Source: Elaborated by the authors
Of the broad competition students, 58.1% have an annual family income above US$28,760.00, while among quota students they are 14.7%. Regarding the parental education level, 57.9% of broad competition students have both parents with higher education; among the quota students, they are 24.7%. On the other hand, 28.9% of broad competition students have only a father or only a mother with a higher education degree; among quota students, they are 33%. Of the broad competition students, 13.2% have parents who did not graduate from high school; among quota students they are 42.3%. Of the students who have both parents with a higher education degree, broad competition students are in the majority. Among the students of whom none of the parents have a higher education degree, the quota students are the majority (Table 4).
When comparing students according to self-declared race/skin color and high school background, we observed (Table 5) that 73% of white students and 81.3% of yellow students attended private schools. On the other hand, this percentage is 29.9% for browns and 27.3% for blacks. Regarding receiving financial assistance from the family, 95.1% of white students declared they received it, as well as 77.8% of yellow students. Among brown students, 91.4% do, whereas 71.30% of black students receive family support.
Table 5 Association between sociodemographic/socioeconomic characteristics and the self-reported skin color of students from a medical school in the state of Rio de Janeiro based on Pearson’s chi-square test. Rio de Janeiro, 2018.
| Studied characteristics | Race/skin Color | p-value | |||
| White | Yellow | Brown | Black | ||
| n (%) | n (%) | n (%) | n (%) | ||
| High school type | |||||
| Private school | 341 (73.3) | 13 (81.3) | 47 (29.9) | 6 (27.3) | <0.0001 |
| Public school | 122 (26.3) | 3 (18.8) | 110(70.1) | 16(72.7) | |
| Receives financial support from the family | |||||
| Yes | 449 (95.1) | 14 (77.8) | 148(91.4) | 17(71.3) | 0.002 |
| No | 23 (4.9) | 4 (22.2) | 14 (8.9) | 5 (22.7) | |
| Annual family income | |||||
| Up to $8,640 | 40 (8.6) | 2 (11.1) | 41(25.8) | 4 (19.0) | <0.0001 |
| Between $8,640 and $28,760 | 186 (39.9) | 6 (33.3) | 90 (56.6) | 11(52.4) | |
| Above $28,760 | 240 (51.5) | 10 (55.6) | 28 (17.6) | 6 (28.6) | |
| Scholarship recipient | |||||
| Yes | 186 (39.7) | 2 (12.5) | 64 (40.5) | 10 (45.5) | 0.806 |
| No | 282 (60.3) | 14 (87.5) | 94 (59.5) | 12 (54.5) | |
| Parental Higher Education | |||||
| Both have | 251(54.0) | 10(62.5) | 42 (26.4) | 5 (22.7) | <0.0001 |
| Only one has | 139(29.9) | 4 (25.0) | 52 (32.7) | 5 (22.7) | |
| Neither has | 75 (16.1) | 2 (12.5) | 65 (40.9) | 12 (54.5) | |
Source: Elaborated by the authors
When dividing students by monthly family income ranges and associating them with self-reported skin color, we noticed that of the white students, 8.6% have an annual family income of up to US$ 8,640.00; of the yellow students, it is 11.1%. Once again, the data shows the opposition in the comparisons of whites and yellows with browns and blacks, since 25.8% and 19% of them, respectively, are in the lowest income strata.
In the range between US$8,640.00 and US$28,760.00 there are 39.9% of white students; 33.3% of yellow students; 56.6% of browns, and 52.4% of blacks. When evaluating those with an income above US$ 28,760.00, more than half of the whites have the annual family income in this stratum (51.5%); of yellow students, 55.6%; of browns, 17.6%, and of blacks, 28.6%.
Regarding the parental level of schooling, 54% of whites, 62.5% of yellows, 26.4% of browns and 22.7% of blacks have both parents with a higher education degree. Among the whites, 29.9% have only a father or only a mother with a higher education degree; of the yellow students, 25%; of browns, 32.7%; and of blacks, 22.7%. Of the white students, 16.1% have neither parent with a higher education degree; of yellow students, 12.5%; of browns, 40.9% and of blacks, 54.5%.
Among students whose both parents with a higher education degree, most are white and yellow students. Among students whose neither parent has a higher education degree, the majority are brown and mainly black students.
On the one hand, table 5 shows that browns are closer to whites than blacks regarding the item “Receives financial support from the family”. On the other hand, in relation to high school background and parental level of schooling, browns, as well as blacks, and differently from whites, who have mostly attended public schools. The same is observed among those with the lowest family income, and with parents who do not have a higher education degree.
Yet in table 5, the data regarding the comparison between blacks and browns and browns and whites, demonstrated that regarding the high school background, family income and parental level of schooling, whites differ, with statistical significance, from browns, while blacks do not. The only item in which browns and whites are similar is related to the family’s financial support, and there is no difference between blacks and browns. Although blacks are the largest group that does not receive help (almost twice as many as browns and four times as many as whites), most of them still receive it.
Temporal analysis of the racial and economic profile
In 2013, the first year of full adoption of the quota law by the university, of the incoming students, 26.4% were black and brown and 73.6% were white and yellow. According to the data in Table 6, there is a reduction in the proportion of blacks in 2014 and an increase in the following years, with no statistical significance in any of the years.
Table 6 Evolution of the number of students in relation to race/skin color criterion admitted to a Medical School in the state of Rio de Janeiro between 2013 and 2017, based on Pearson’s chi-square test. Rio de Janeiro, 2018
| Year of admission | Race/skin color | p-value | |
| Whites and Yellows | Blacks and Browns | ||
| n (%) | n (%) | ||
| 2013 | 92 (73.6) | 33 (26.4) | |
| 2014 | 93 (81.6) | 21 (18.4) | 0.141 |
| 2015 | 127 (77.4) | 37 (22.6) | 0.451 |
| 2016 | 81 (65.9) | 42 (34.1) | 0.184 |
| 2017 | 86 (64.7) | 47 (35.3) | 0.121 |
Source: Elaborated by the authors
Regarding the income analysis, since 2013 there has been an increase in the number of admitted students at the lowest income stratum and a decrease in those at the highest income stratum. Although the difference between the first year of law enforcement and the years 2014 and 2015 is not statistically significant, it is possible to see a significant difference in the years 2016 and 2017 (Tables 7).
Table 7 Evolution in the number of students divided by annual family income who were admitted to a Medical School in the state of Rio de Janeiro between 2013 and 2017 based on Pearson’s chi-square test. Rio de Janeiro, 2018
| Year of admission | Annual Family Income (U$) | p-value | ||
| Up to 8,640.00 | 8,640.00 - 28,760.00 | ≥ 28,760.00 | ||
| n (%) | n (%) | n (%) | ||
| 2013 | 11 (8.9) | 51 (41.4) | 62 (50.0) | |
| 2014 | 14 (12.5) | 48 (42.9) | 50 (44.6) | 0.302 |
| 2015 | 11 (6.8) | 76 (46.9) | 75 (46.3) | 0.829 |
| 2016 | 21 (17.5) | 55 (45.9) | 44 (36.7) | 0.013 |
| 2017 | 27 (20.6) | 58 (44.3) | 46 (35.1) | 0.003 |
Source: Elaborated by the authors.
DISCUSSION
The census showed an increase in the number of public high school students in the medical course at the surveyed university between 2013 and 2017, differently from the racial profile, which remained mostly white. Our data showed that there was no difference between the racial profile of the students admitted through the broad competition system and quotas without racial criteria; however, the census occurred during the transition from the broad competition to the quota system, making this finding a relative one. Here, the most important is to understand that affirmative actions of a strictly social nature do not implicitly increase the number of black and indigenous students. A possible reading of the data produced in this study is given by the literature that supports the independence of the concept of race in relation to that of social class10), (11), (18), (51. In this sense, we will discuss, based on the data, the distinction between the two categories.
Tables 1 and 2 show that the prevalent profile among medical students in Brazil is: white, with high family income, parents with a higher education degree, who attended a private school and who do not work during the course, being financially supported by the family, similar to that described in national and North-American literature20), (52.
Half of the Brazilians lived on less than US$2,897.00 annually; the average annual income of Brazilian households in 2015 was US$9,853.0053. However, we can observe the economic profile of medical students at the extremities; the number of students whose family income was between US$8,640.00 to US$12,960.00 per year, close to the Brazilian average, is practically the same as those who live with an annual income above US$86,400.00. Most of them have an annual household income greater than US$28,800.00, almost three times the average income of the country. Ristoff24 states that the Brazilian medical student is, on average, six times richer than the national population.
When we associate socioeconomic variables with racial variables, self-declared brown and black students have similar financial status, inferior to whites. Among black and brown students, are the highest proportions of students from public schools (126 against 122 whites) and parents with low level of schooling (54.5% and 40.9% had neither parent with a higher education degree, against 16.1% of whites), in accordance with that evidenced by the national reality25), (53)-(55.
Henriques56 showed that among the poorest 10% of the Brazilian population, 70% are black. Among the richest 10%, there are only 15% blacks versus 85% whites. In relation to housing conditions, blacks have worse conditions than whites: they are the majority living on unsuitable land, with a higher resident density, inadequate water supply and less basic sanitation. More than half of blacks and browns are in the income range of US$8,640 and US$28,760, while more than half of the whites are concentrated in the annual income range above US$28,760.
As for schooling, inequalities are aggravated in higher education57 and in postgraduate degrees52), (57. Santos58 and Scheffer52 demonstrate that whites occupy 86% of vacancies in master’s and doctoral degree courses. Despite the tendency for the increase in the number of black students in universities, due to affirmative action policies, there is greater access for black men to the detriment of black women57. In addition to racism, sexism also acts as a factor of social hierarchy associated with health vulnerability59.
In general, the majority of the students who answered our census do not work (90.1%) nor have their own formal income, being financially supported by the family (79.2%), showing that, in order to study Medicine, a financial investment is required, which many families are unable to provide, legitimizing the existence of exclusion by the socioeconomic criteria. However, in this context of structural inequality, we maintain that the situation of black and brown students is socially more severe than that of whites.
When analyzing the census participants’ modalities of admission at the university, the majority of those entering through the broad competition system are white (82%), as well as in the quota modality without the racial/skin color factor associated with the public school background (76% for public school regardless of income and 71% for public school considering the income). Blacks and browns are only the majority when the quota vacancies consider the racial criterion. Exclusively socioeconomic quotas seem to be ineffective for the inclusion of black men, black women and indigenous people into the medical course.
Since the majority of students admitted through the broad competition system is white, if the affirmative action policy did not exist, the proportion of black, brown and indigenous students would probably be even lower. The same can be said for the poorest students, a minority among those admitted through the broad competition system: only 3.9% of these belong to the annual income stratum of up to US$8,640.00; among quota students, this stratum represents 20.6%.
Related to this information, Chart 1 allows the association with the theory that the elimination of racial inequalities does not depend on universal policies60, such as those that only include the income and school background criteria. It is necessary to implement policies that are specific for blacks, browns and indigenous people. The results of tables 5 and 7 corroborate this position: in the 5-year period of universal affirmative actions, significant changes in the economic profile occurred in the years 2016 (p = 0.013) and 2017 (p = 0.003), when compared to 2013. However, there were few changes in the racial profile.
Such increase in the representativeness of blacks and browns occurred due to quotas with some racial criteria and the greater offer of vacancies. Valverde and Stocco57 denied the idea of structural changes in Brazilian society and in its racial relations. At the time, they argued for the need for essentially racial inclusive measures, not subordinated to socioeconomic criteria, such as educational background in the public system, differently from the one established in Law 1.711 /201236.
This debate on broad social measures to the detriment of affirmative racial policies has become especially dangerous when it appears in a silencing perspective. The assumption that improving public basic education and income distribution would improve the black population’s access to places where they are historically marginalized disregards the racial criterion as a producer of inequalities61. Like Heringer62, Valverde and Stocco57, we understand the quotas reserved for non-whites in universities as a strategy for this population to have access to places of power, having another viewpoint of the problems of Brazil.
CONCLUSION
Based on our data, we conclude that, in the specific case, the quota system for university access based on the subordination of the race/skin color category to the social class has failed to include non-whites in the analyzed medical course, confirming our hypothesis. Our data corroborate the independence of the two categories, so that the objectives established in Law n. 12.71136 concerning the correction of structural racism in the access to higher education, especially medical education, can be met.
However, we highlight the limitations of our research. In Brazil, the definition of race goes through a collective imagination, in addition to being intrinsically linked to subjective issues63. Even if there is no discrepancy in the use of self or racial hetero-attribution64, any analysis will be crossed by the non-quantifiable, and hardly identifiable subjectivity of those who attribute it.
When using self-filling data acquisition methods, hetero- and self-attribution systems may be influenced by a bias, when the answer given will guarantee access to public policies, which can benefit this or that group65. Therefore, without objective criteria or institutional control over admission and census declaration, candidates are free to respond inconsistently with their phenotype, aiming to being admitted to the medical course.
To advance this discussion, further studies are needed, mainly on the impacts of the racial hetero- and self-attribution processes on entering higher education. We are convinced by the fact that the debate on the social construction of the racial category in Brazil is not exclusive of the stricto sensu social sciences, but rather to socio-racial determinants that should be part of the research in other areas.
We recommend that health courses identify the profile of their undergraduate and graduate students. Information on the socioeconomic, racial and cultural profiles of the professionals trained by the universities bring new dimensions to the evaluation of the results of pedagogical projects and curricula. Knowing the profile of the graduated student allows that, at least in the health area, their services be more aligned with the demand of users of the public health system.

