


 Inglês (pdf)
 Artigo em XML
 Enviar este artigo por email
 Permalink
INTRODUCTION
Progress tests are comprehensive longitudinal assessments used to measure students’ knowledge throughout a curriculum that allow, when properly designed and applied, observation of the individual growth pattern over repeated tests and comparisons of cohorts1)-(6.
In Brazil, at Escola Paulista de Medicina - Universidade Federal de São Paulo, SP, the progress test was introduced in 19967),(8. This assessment has been carried out annually for students from the 1st to the 6th year of medical school at several institutions, either alone or in partnership1),(9. Additionally, numerous studies have been carried out aiming to verify the students’ performance on the progress test7),(10),(11.
Furthermore, an important question that arises is about the validity of taking the progress test from the 1st to the 6th year, taking into consideration the amount of human and financial resources that are spent for its performance, especially for the first years of medical school. In this sense, an attempt to answer this question would be found if the grades obtained during medical school showed correlations between them and any relationship with passing the medical residency exam12),(13.
Karay and Schauber reported relationships between the individual students’ development assessed by progress tests and performance in high stakes national licensing examinations, showing that the progress tests were suitable to monitor the students’ growth of knowledge during the course of medical training14.
A study performed at Universidade Federal de São Paulo searched for a predictable statistical model of success in medical residency exams based on the progress test and medical clerkship evaluations. Data on 114 medical students that took the progress tests and had clerkship evaluation at the 5th and 6th years were searched for predictors of the student’s score in the medical residency exam by linear regression analysis. The final model showed that the grades of the 5th year clerkship rotations could predict the medical residency exam score, but grades of the progress test only approached the threshold of significance (p=0.06). Although the progress test failed to predict the final residency score, the univariate analysis pointed out to some correlation between the progress tests performed at the 4th, 5th and 6th years15.
To investigate these correlations and eventually expand the number of factors influencing the residency exam, the factor analysis, which is a statistical method that searches for correlations between factors and allows the grouping of strongly correlated variables that explain a given phenomenon, would be considered appropriate16.
Thus, the objective of this study was to measure the correlation between grades on the progress tests, clerkship rotations assessments and medical residency exam and search for the strongest correlation with grades of the final medical residency exam using factor analysis.
METHODS
This was a retrospective and longitudinal study with correlation analyses of grades attained on the progress tests from the 1st to 6th year of medical school, the clerkship rotations performance coefficient (5th and 6th year) and medical residency exam in a cohort of students enrolled in the first year of medical school at the Universidade Federal de São Paulo in 2009.
The inclusion criteria were students enrolled in the 1st year in 2009 at this Institution who undertook the progress tests (PT) from the 1st to the 6th year. The exclusion criteria were students who missed the progress tests at any time during the six years of the medical school.
Correlations between the grades on the progress tests, clerkship rotations coefficient and medical residency exam of all included students were performed using factor analysis17),(18.
This study was approved by the institution’s Research Ethics Committee under number 2,555,803.
Progress test
The progress tests at Escola Paulista de Medicina-Universidade Federal de São Paulo were administered once a year in the second semester of the school year. They contained 120 multiple-choice questions with five alternatives and were prepared in conjunction with eight universities participating in the university agreement, covering the entire cognitive content studied until the end of the course, in the areas of basic sciences, internal medicine, surgery, pediatrics, public health, ethics, gynecology and obstetrics. The scores ranged from 0-10, based on the percentage of correct answers. The test was not mandatory, and feedback was given to students by handing over the question booklet and releasing the answer key.
Coefficient of academic performance
During the 5th year, students’ rotations comprised outpatient internal medicine, family medicine, primary care, interdisciplinary outpatient clinic for adult comprehensive care, cardiology, cardiovascular surgery, endocrinology, gastrointestinal clinic, gastrointestinal surgery, gynecology, obstetrics, hematology, nephrology, urology, neurology, neurosurgery, ophthalmology, otorhinolaryngology, and community pediatrics, pneumology, thoracic surgery and psychiatry.
Throughout the 6th year, students attend the following areas: general surgical ward, internal medicine ward, infectology, emergency medicine, anesthesiology, plastic surgery, vascular surgery, pediatric emergencies, clinical pediatrics, neonatal pediatrics, obstetrics, orthopedics and traumatology, surgical emergency room, advanced life support in cardiology and an optional clerkship.
The coefficients of academic performance (CAP) for the last two years of medical school that corresponded to the medical clerkship rotations were analyzed.
The CAP is the index that measures, throughout the course, the student’s academic performance at the end of each term and represents the weighted mean of the grades during the clerkship rotations. Each Academic Department or Discipline evaluate their students at the end of the shift, mostly through a written assessment test, skills and attitudes, requiring a frequency of at least 80% of activities and a minimum grade of 6 in 10.
Medical residency exam
This exam was carried out in two stages. The first corresponded to the written theory-based exam with 100 assertive questions with short answers to questions equally distributed in the areas of internal medicine, surgery, obstetrics and gynecology, preventive medicine and pediatrics, and it lasted four hours and thirty minutes.
The second phase comprised the practical test for which students who obtained the highest grades in a ratio of three students/vacancy were invited. The practical test consisted of two stages, one computer-based and the other in the form of practical stations (the Objective Structured Clinical Examination: OSCE). In the computer-based test, the candidates answered 50 questions that involved images displayed on a computer available to each candidate. This hour-long test consisted of questions about internal medicine, general surgery, obstetrics and gynecology, pediatrics and preventive and social medicine. The other stage of the practical test (OSCE) consisted of four stations on clinical medicine, clinical surgery, pediatrics and gynecology-obstetrics. In this test, the candidates performed an activity related to medical practice during five minutes and were observed by teachers who assigned a grade based on a checklist.
The final result of the medical residency exam, which was included in this analysis, was determined by the sum of the scores obtained in the written theoretical test (multiplied by 5), in the practical test (multiplied by 4) and grade given for the interview with the analysis of the candidate’s curriculum and performance during this activity (multiplied by 1).
Statistical analysis
The descriptive analysis of the test scores was expressed as the mean and standard deviation and the median with minimum and maximum values. The average grades on the progress tests from the 1st to the 6th year, CAP of the 5th year and CAP of the 6th year and the medical residency exam were compared by paired t-test. To analyze data reliability, Cronbach’s alpha19) was evaluated and considered adequate when greater than 0.720.
Correlations between scores on all exams included in the study were performed through factor analysis of the grades17),(18.
The following criteria were established for factor analysis: a sample size of at least 100 grades in each test21; minimum communality value of 0.516),(18; and Kaiser-Meyer-Olkin (KMO) coefficient greater than 0.622.
The factor extraction technique was based on the main components17. The number of factors extracted followed the Kaiser rule, which determined that only factors with an eigenvalue greater than 1 should be extracted to obtain an accumulated explained variance of the extracted factors greater than 60%21.
The rotation of the factors was performed using the Varimax orthogonal technique, with the main objective to make the empirical results more easily interpretable, while conserving its statistical properties. This method seeks to minimize the number of variables that show high loads in each factor22.
Finally, the extracted components were identified with their respective factors and each factor loading.
Statistical analyses were performed with the SPSS® software (IBM SPSS Statistics, Somers, NY, USA, version 17), with a significance level of p < 0.05.
RESULTS
In 2009, 123 students were enrolled in the first year of medical school at the assessed University. Of these, 114 (92.7%) took the progress tests from 2009 to 2014 and had medical clerkship rotations evaluations (CAP 5th and 6th) in 2013 and 2014. Of the 114 students included in the study, 105 (92.1%) completed all stages of the residency exams at the University in 2015, and all 105 students passed the exam, thus being included in the analysis (Figure 1).
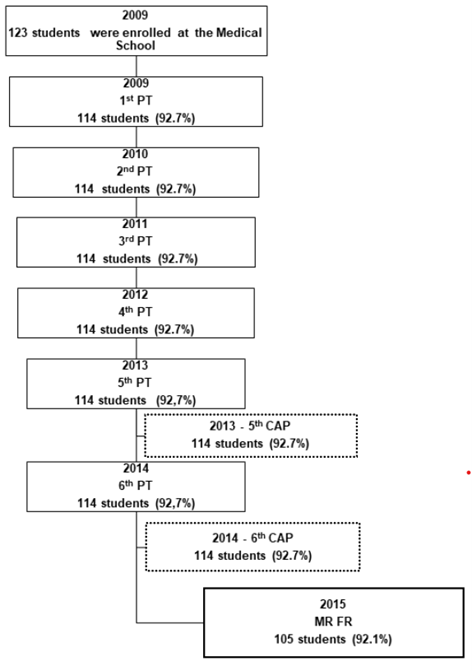
Figure 1 Flowchart of the study. PT: Progress tests at each year during the six years of Medical School; CAP: Coefficient of academic performance during Medical clerkship rotations; MR FR: Final result of Medical Residency Exam.
Data reliability assessed by Cronbach’s alpha coefficient showed significant internal consistency between the grades on the progress tests from the 1st to 6th year, CAP 5th year, CAP 6th year and the medical residency exam, with a value of 0.736, 95% CI: 0.653 - 0.806 (p <0.001).
The average test scores are shown in Table 1. There was a progressive increase in the grades on the progress tests from the 1st to the 6th year of medical school, with statistically significant differences between all tests (p <0.001), except between the grades on the progress tests in the 3rd and 4th years, with a reduction in the grade in the 4th year (p = 0.028). The average grade for the CAP 5th year was higher than the average for the CAP 6th year (p <0.001), and the grade on the residency exam was lower than the clerkship rotations grades.
Table 1 Descriptive data of grades from the 1st to 6th year for the Progress Tests, Coefficient of academic performance during Medical clerkship rotations and the Final Result of the Medical Resident Exam.
| Mean ± SD | Median | Minimum | Maximum | |
|---|---|---|---|---|
| 1st PT (n=114) | 2.67 ± 0.97 | 2.83 | 0 | 4.5 |
| 2nd PT (n=114) | 3.00 ± 0.70 | 3.04 | 0 | 4.58 |
| 3rd PT (n=114) | 4.19 ± 1.13 | 4.33 | 0 | 6.25 |
| 4th PT (n=114) | 4.01 ± 1.05 | 4.14 | 0 | 6.58 |
| 5th PT (n=114) | 5.19 ± 1.56 | 5.42 | 0 | 7.25 |
| 6th PT (n=114) | 6.38 ± 1.80 | 6.83 | 0 | 8.42 |
| CAP 5th (n=114) | 8.33 ± 0.29 | 8.34 | 7.71 | 8.96 |
| CAP 6th (n=114) | 8.26 ± 0.28 | 8.29 | 7.53 | 8.84 |
| MR T (n=105) | 7.53 ± 0.56 | 7.63 | 5.75 | 8.95 |
| MR FR (n=105) | 8.05 ± 0.42 | 8.10 | 6.84 | 9.28 |
SD: Standard Deviation; PT: Progress Test; CAP: Coefficient of academic performance during Medical clerkship rotations; MR T: Result of the Theoretical Medical Resident Exam; MR FR: Final Result of the Medical Residency Exam.
The analysis of the communalities of the different exams varied from 0.46 to 0.839. The grades on the 1st year progress test had a coefficient 0.46, suggesting less strength in the linear relationship with the other variables (<0.5) and were, therefore, removed from the factor analysis.
The analysis of the grades on the progress tests in the 2nd, 3rd, 4th, 5th and 6th year, grades of the performance at the clerkship rotations (CAP 5th, CAP 6th) and grades on the medical residency exam regarding the Kaiser-Meyer-Olkin test (KMO) was 0.709 and the Bartlett’s sphericity test was significant (p <0.001), showing adequacy of the data for the factor analysis.
The extraction of factors, following the Kaiser rule, determined the extraction of three factors with an eigenvalue greater than 1 (Figure 2).
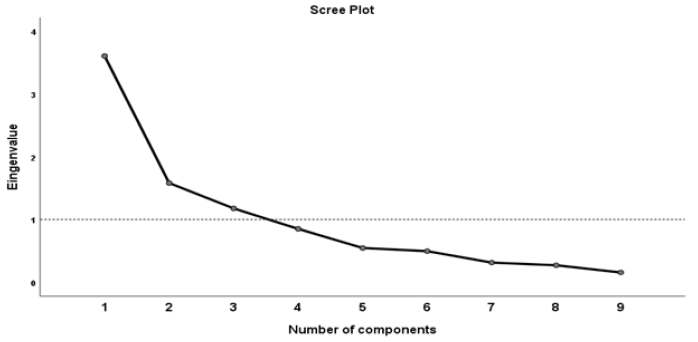
The first component consisting of the variables CAP 5th, CAP 6th and medical residency grades explained 43.9% of the variance, whereas the second component was represented by the progress tests in the 5th and 6th year with 18.0%, and the third component, which consisted of the progress test grades in the 2nd, 3rd and 4th years explained 14.4% of the variance of the model, totaling 76.3% of the total variance (Table 2).
Table 2 Isolated and total variance explained by each matrix component
| Initial eigenvalues | Extraction sums of squared loadings | |||||
|---|---|---|---|---|---|---|
| Components | Total | % of Variance | Cumulative % | Total | % of Variance | Cumulative % |
| 1 | 3.511 | 43.884 | 43.884 | 3.511 | 43.884 | 43.884 |
| 2 | 1.443 | 18.035 | 61.920 | 1.443 | 18.035 | 61.920 |
| 3 | 1.148 | 14.350 | 76.270 | 1.148 | 14.350 | 76.270 |
| 4 | .634 | 7.926 | 84.196 | |||
| 5 | .520 | 6.495 | 90.692 | |||
| 6 | .317 | 3.963 | 94.654 | |||
| 7 | .271 | 3.392 | 98.046 | |||
| 8 | .156 | 1.954 | 100.000 | |||
The matrix rotation using the Varimax method allowed the visualization of the three components with greater correlation strength and generated a new correlation matrix. Component 1 was identified as CAP 5th, CAP 6th and medical residency grades, component 2 was formed by the grades on the progress tests in the 5th and 6th years and the third component comprised the grades on the progress tests in the 2nd, 3rd and 4th years (Table 3).
Table 3 Correlation matrix for each component after matrix rotation using the Varimax method.
| Components | 1 | 2 | 3 |
|---|---|---|---|
| 2nd PT | .137 | -.092 | .795 |
| 3rd PT | .065 | .465 | .709 |
| 4th PT | .231 | .422 | .680 |
| 5th PT | .144 | .882 | .082 |
| 6th PT | .102 | .884 | .150 |
| CAP 5th | .840 | .022 | .328 |
| CAP 6th | .798 | .073 | .461 |
| MR FR | .795 | .272 | -.173 |
PT: Progress Test; CAP: Coefficient of academic performance during Medical clerkship rotations; MR FR: Final Result of the Medical Resident Exam. Extraction Method: Principal Component Analysis. Rotation Method: Varimax with Kaiser Normalization. Converged rotation in 5 interactions.
DISCUSSION
The present study showed that, with some variations, the percentage of correct answers on the progress tests from the 1st to the 6th year of medical school and the medical residency exam scores at the Universidade Federal de São Paulo were similar to those of other medical schools3),(9),(11.
Willoughby and Hutcheson23 reported lower percentages of correct answers than those in the present study on the progress tests from the 1st to the 6th year, which were 6.1, 16.1, 30.7, 41.6, 50.9 and 56.0% at the University of Missouri. Likewise, Van der Vleutenet al3) in a 15-year analysis of progress tests at Maastrich Medical School in the Netherlands, from 1977 to 1985, showed increasing percentages of correct answers from the 1st to the 6th year, with values close to 20% in the 1st year and 60% in the 6th year. Another study also showed similar results on the progress tests for three classes of McMaster University students, with initial scores of 10 and 20% at the beginning of the course, with an almost linear rise until reaching 50% on the 5th exam2.
The theoretical medical residency exam score of 7.5 ± 0.6 was similar to that observed in another Brazilian University, in 2012 (7.6 ± 0.9), 2013 (7.3 ± 0.8), and 2014 (7.5 ± 0.9) in the multiple-choice questions in the areas of general surgery, internal medicine, gynecology and obstetrics, pediatrics and public health11.
The factorial model obtained in the present study showed that although there were correlations between each of the tests, the strongest correlations were detected among three groups of students’ grades. The first group was represented by grades during the clerkship rotations and at the medical residency exam; the second group was represented by grades on the 5th and 6th year progress tests; and the third group by the 2nd, 3rd and 4th-year progress tests.
Therefore, this analysis showed that the performance during the clerkship rotations, represented by the coefficients of academic performance during clerkship rotations and 5th and 6th year progress tests showed the greatest association with grades on the medical residency exam. The 2nd, 3rd and 4th-year progress tests were also correlated with performance on the medical residency exam, although at a lower level.
Authors have reported an association between the global means of progress tests performed during medical course with the theoretical result of the medical residency exam, but not the final result of the medical residency exam. This fact could be explained because the progress test assesses the formative content, as well as the theoretical medical residency exam13. However, the present study aimed to search for factors correlated to the final result of medical residency exam, which measures a summative dimension. For this reason, the progress test grades, as well as the evaluation of the clerkship rotation had to be included in the factorial analysis, as clerkship evaluation represents a global knowledge2),(24. According to the factor analysis, the final result of the medical residency exam was correlated with both the progress tests from the 2nd to 6th year and clerkship. The difference found between this study and the literature might be explained by the variables included in the analysis. As the final result of the medical residency exam included a summative evaluation of knowledge, it could explain the strong correlation with clerkship evaluation and the weaker correlation with the progress test2.
After applying the factorial analysis technique, the 1st year progress test was excluded from the analysis, possibly because of lower grades in the first year than in the subsequent years of the course, which resulted in a low correlation between them. Likewise, a study showed a significant Pearson’s correlation between the final result of the medical residency exam and the progress test scores, except for the 1st, 2nd and 3rd years15. Other authors have already reported lower percentages of correct answers in the initial years with an almost linear rise towards the end of the course2),(3),(23.
It should be noted that the reason why the 1st year progress test was not included in the model was that its correlation was not as strong as the other tests and the fact that its communality was slightly lower than 0.5. Such technical issues of factor analysis are not absolutely rigid; however, it served to obtain a better model from the mathematical point of view. Thus, a more liberal approach in relation to the inclusion of the 1st year progress test grades could have shown a correlation with less power in the explained variance and, perhaps, created a fourth component, with much less strength than the others. This analysis is in line with the idea that the progress test among first-year students has less discriminatory power because only a small percentage of the questions refer to the knowledge acquired at the beginning of the course3 and, furthermore, in the 1st year of medical school the adhesion to progress might be lower than in more advanced years, with lower scores, which possibly reduced the strength of the correlation with later assessments25.
Therefore, these results do not imply that grades of the 1st year progress test do not provide any added value to the students’ performance on the medical residency exam. In this line, a study reported that initial levels and gains of knowledge during the medical course are related to later performances on national licensing examinations. The authors showed that the pre-clinical (1st-4th semesters) and the clinical phase (5th-12th semesters) of the medical course were both positively related to long-term assessments14.
Therefore, it can be said that the progress test would be important to understand the performance evaluation process of medical students at each year, to analyze the development of students within a particular cohort, so it could be used as a tool for early diagnosis and interventions, as well as for comparisons between medical schools1),(14),(24),(26.
Therefore, considering all the research together, although in the present study, grades of the 1st year progress test were not correlated with performance in other tests, students should be encouraged to take these tests in a committed way in the very beginning of the course. Moreover, efforts to improve the quality of the progress test and measures to improve students’ adhesion to it, especially in the first years, and better quality of the progress test would increase the correlation between these assessments2),(24),(25),(27.
A limitation of this study was the analysis of only one group of students who started medical school in a given year. Additionally, except for the progress test, which could be interinstitutional, the inclusion of only one institution that may show clerkship rotations heterogeneity, different contexts of the practice of medicine and different forms of assessments compared to other schools of medicine, could represent an inclusion bias28),(29, supporting the need for further studies.
The strength of this research was the longitudinal analysis of the test scores performed during the course, with great adherence by students to the progress tests and adequate reliability of data consistent with the internal consistency coefficient found in this study. Furthermore, the statistical treatment that was developed here allowed measuring the strength of the correlation factor, which might be in accordance with the daily experience. In addition, unlike other studies, the present research showed that the progress test applied in the last five years of medical school at our institution was also correlated with the final result of the medical residency exam, even though more studies are needed to validate these results.
CONCLUSIONS
This study showed that grades of the progress test from the 2nd to 6th year, clerkship rotations assessments and the final medical residency exam had strict and positive correlations between them. Furthermore, the academic performance during medical clerkship rotations showed the strongest correlations with the medical residency exam scores.

