


Servicios Personalizados
Revista

Articulo
 texto en
  Inglés (pdf)
 Articulo en XML
 Enviar articulo por email
Compartir

 Permalink
Revista Brasileira de Educação Médica
versión impresa ISSN 0100-5502versión On-line ISSN 1981-5271
Rev. Bras. Educ. Med. vol.46 no.4 Rio de Janeiro 2022 Epub 07-Dic-2022
https://doi.org/10.1590/1981-5271v46.4-20220145
ORIGINAL ARTICLE
Progress Test: medical student absenteeism is suggestive of poor academic performance
1
, study concept and design, manuscript drafting, the main writer  http://orcid.org/0000-0001-9550-7266
1
, consultant and statistics reviewerhttp://orcid.org/0000-0001-6704-1673
2
, consultant, statistics and manuscript reviewerhttp://orcid.org/0000-0002-0777-109X
3
, consultant and manuscript reviewerhttp://orcid.org/0000-0002-3340-9465
1Universidade Federal de Santa Catarina, Florianópolis, Santa Catarina, Brazil.
2Universidade Estadual de Londrina, Londrina, Paraná, Brazil.
3Universidade da Região de Joinville, Joinville, Santa Catarina, Brazil.
4Universidade Federal do Rio Grande do Sul, Porto Alegre, Rio Grande do Sul, Brazil.
Introduction:
It is not known whether the absence of medical students at the Progress Test (PT) is random event or if it due to some systematic characteristic of the students, which could influence the representativeness of the results obtained by the participants.
Objectives:
1) to compare the academic performance indexes, in UFSC Medical School, of students who were present and absent from the PT in 2019; 2) to propose a way to estimate, based on these indexes, what the absentee’s grades would be if they had participated in the PT; 3) to identify factors associated with absence from the PT.
Method:
The averages of academic performance indexes, overall and in the different phases (semesters) in the groups of students who were present and absent from the PT, were compared using Student’s t test for independent samples. Using a linear regression technique, the probable PT scores were assigned to the group of absent students.
Results:
The global averages of the three academic indicators were significantly lower in students absent from the PT (p ranging from < 0.03 to < 0.0001); in 10 of the 11 analyzed course phases (semesters), the academic indicators of absentees were worse than those present at the test. The attribution of PT grades to the absentees allowed us to verify that there is a correlation (R=0.62) between the percentage of these students and the difference in grades between the groups that took and those that did not take the PT. Among male students, 25.8% did not attend the PT, while among female students the number of absentees was 16.6% (difference with p <0.01).
Conclusions:
The absence of students at the PT does not occur randomly. Among the absentees, there is a systematic tendency to have students with worse academic performance. The use of multiple imputation of data demonstrate a correlation between the percentage of absentees and the difference in the average of grades in the PT of this group, compared to the average of the participants’ grades. The proportion of male students who missed the PT was significantly higher than that of female students.
Keywords: Medical Education; Educational assessment; Progress Test; Multiple imputation; Absence of students at PT
Introdução:
Não se sabe se a ausência de estudantes de Medicina ao Teste de Progresso (TP) se dá de forma aleatória ou por alguma característica sistemática deles, o que poderia influenciar a representatividade dos resultados obtidos pelos participantes.
Objetivo:
Este estudo teve como objetivos comparar os índices de desempenho acadêmico, no curso de Medicina da UFSC, dos alunos presentes e ausentes ao TP em 2019; propor uma maneira de estimar, a partir desses índices, quais seriam as notas dos faltantes se tivessem participado do TP; e identificar fatores associados à ausência ao TP.
Método:
Foram comparadas as médias dos índices de desempenho acadêmico, globais e nas diferentes fases (semestres) dos grupos de alunos presentes e ausentes ao TP, utilizando teste t de Student para amostras independentes. Por meio de uma técnica de regressão linear, foram imputadas as prováveis notas no TP ao grupo de alunos ausentes.
Resultado:
As médias globais dos três indicadores acadêmicos foram significativamente menores nos alunos ausentes ao TP (p variando de < 0,03 a < 0,0001); em dez das 11 fases (semestres) analisadas do curso, os indicadores acadêmicos dos faltosos foram piores do que dos presentes. A imputação de notas no TP aos ausentes permitiu verificar que existe correlação (R = 0,62) entre a porcentagem destes e a diferença de notas entre os grupos que realizaram e os que faltaram ao TP. Entre os alunos do gênero masculino, 25,8% não fizeram o TP, enquanto no gênero feminino foram 16,6% (diferença com p < 0,01).
Conclusão:
A ausência de alunos ao TP não se dá de forma aleatória. Entre os faltosos, há uma tendência sistemática de existirem alunos com piores índices de desempenho acadêmico. O uso de imputação múltipla de dados evidencia uma correlação entre a porcentagem de faltosos e a diferença na média da nota no TP, desse grupo, comparada à média da nota dos participantes. A proporção de homens que faltaram ao TP foi significativamente maior do que a de mulheres.
Palavras-chaves: Educação Médica; Avaliação Educacional; Teste de Progresso; Imputação Múltipla; Ausência de estudantes ao TP
INTRODUCTION
The Progress Test (PT) is a type of serial, longitudinal assessment of students’ knowledge, in which students from medical schools periodically take, on the same day, a test aimed at assessing the knowledge expected at the end of undergraduate school. Among the several uses of the PT in the teaching and learning process, the results of these tests are used for students to verify their individual performance during undergraduate school, and for each school to evaluate the performance of the students, comparing them with students from the other participating schools1)-(3. The proportion of students absent from the PT varies greatly between different schools. It is not known whether this absence occur randomly or due to some systematic characteristic of the absentees, which could affect the global representativeness of the PT results.
The lack of information about the characteristics of the missing data in an assessment, such as the Progress Test, can generate biased information4)-(7. If the students’ absence occurs at random, the results of this evaluation may be representative of the school; but if the absence occurs systematically, more predominantly, for instance, among students with high or low performance in the medical course, then it is likely that the PT result is not truly representative of the school6.
Either independently, or with the support of the Brazilian Association of Medical Education (ABEM, Associação Brasileira de Educação Médica), groups or regional consortia of medical schools prepare and apply a Progress Test per year8. In Brazil, student participation in the PT is not mandatory in all schools9),(10. In other countries, this assessment is applied two to four times a year. In the Netherlands, for instance, the test is administered four times a year and participation is mandatory; the results are included in each student’s individual curriculum and the PTs can be a substitute for the professional licensing exam2),(11.
Although it may have an influence on school results, the causes of PT absenteeism in Brazil, the characteristics of absent students and the impact of the proportion of absentees on the PT results are not studied. Little value is assigned to the existence, or not, of any bias in the results, due to some systematic characteristic(s) of the absent students. There is also little concern about how to deal with missing data, even though there are statistical techniques, with robust literature, that can be used to impute presupposed values to the group of students that were absent from the PT12)-(14.
Some techniques for imputing data to absentees, using the average of the ones present at the test, are not very concise4, but others, using multiple regression, are more precise4),(14)-(16. These techniques are widely used in planning, research and evaluation of educational performance4),(6),(14),(15),(17),(18. Students’ grades and academic performance indicators can be used to verify whether there is any systematic difference between being present and being absent from the PT. Such indicators can also be used to estimate and impute probable grades in the PT to absent students, aiming to make the results of this type of assessment more representative of the school.
With the objective that periodic evaluations, such as the PT, can, in the future: i) contribute to improving public policies to control and improve the quality of medical education and ii) influence or determine the practice of medicine by trained physicians, it is important that their results in the PT are truly representative of the training of all medical school students. Thus, the issue of absent students must be very well valued to consolidate trust (representativeness) in the results of the PTs and consolidate the legitimacy of the impact of this type of evaluation in medical education and future practice of medicine.
Objectives
The objectives of this research are:
To verify if there is a difference, random or systematic, in the academic performance between students who participated and those who did not participate in the PT;
To propose a methodology that allows estimating the PT scores of absent students, based on their academic performance indexes;
To identify possible factors associated with non-participation in the PT.
METHODS
Population
The study population comprised students of the School of Medicine at Universidade Federal de Santa Catarina (UFSC), a public school located in Florianópolis, capital of the state of Santa Catarina, located in the southern region of Brazil. In this school, in the second semester of 2019, there were 625 students able to participate in the annual PT.
Inclusion and exclusion criteria
Academic performance and PT outcome data from regularly enrolled students would be eligible for the analysis. However, those related to students in the first semester of the course (60 students) were excluded, as they still did not have a six-month index of academic performance. Then, the data of 565 students, eligible to be assessed in the present study, remained in the analysis.
Study design
This was a population-based, cross-sectional and historical study based on data from the academic control system at UFSC19 and the results of the PT. The academic performance indicators, overall and in the different phases (semesters) of the students who participated in the PT were compared to the indicators of the students who did not participate in the evaluation.
Based on academic indicators and using the technique of multiple imputation of data to absentees, grades were assigned to absent students in the PT to improve the comparison between the “present” and the “absent” groups12),(14),(17),(20),(21. The following were assessed: association between gender and absence from the PT; relationship, in the phases of the course, between the percentage of students absent from the TP and the difference in scores in the 2019 Progress Test, between those present and the scores attributed to those absent from the test.
Instruments used in the study
The Progress Test, which was organized by 12 medical schools from the Southern Regional II22 of the Brazilian Association of Medical Education, is a test containing 120 simple multiple-choice questions, with 4 answer options, without penalty for wrong answers. It covers the theoretical content of medical courses in Brazil, according to the National Curriculum Guidelines for medical courses23, being focused on the knowledge expected for students at the end of the course. In Brazil, medical courses comprise 12 academic phases or semesters. In the present study, the test was applied in 2019, and only the UFSC results were analyzed.
Participation in the test was not mandatory and there was no penalty for non-participants. Students who participated in the PT would have this activity included in their school records as a complementary activity.
Variables
The variables analyzed in this study were: the three academic performance indicators used at UFSC, the Enrollment Index (EI), the Accumulated Achievement Index (AAI) and the Proportional Achievement Index (PAI); participation in or absence from the PT; the grades of the participants in the PT; which phase (semester) was being attended at the time of the PT; and student gender.
The AAI is calculated cumulatively for each semester, represented by the result of the division between the sum of points obtained until then and the workload accumulated until the semester in which the student is enrolled (AAI = points obtained / enrolled workload). The PAI is the same as the previous one but using only the disciplines in which the student was approved (PAI = points obtained, excluding failures / enrolled workload, excluding workloads of the failed disciplines). The EI is obtained by multiplying the AAI by the result of the division of the workload already attended (WAA) and the total workload (TW) of the course: EI = AAI x WAA / TW. The higher the values of these indexes, the better the student’s performance. The PT grade is given by the percentage of correct answers in the test.
Statistical analysis
The variables: academic performance indicators (AAI, PAI and EI), scores in the 2019 Progress Test, phases of the course and gender were transcribed into an Excel spreadsheet (Microsoft) and imported into SPSS Statistics, version 20, IBM.
Initially, the percentage of absentees was calculated and, using the Two Proportion Z-Test, it was verified whether there was an association between gender and PT absence/presence. Then, the global averages of the indicators EI, AAI and PAI of the groups of students present at and absent from the PT were compared, using the Student’s t test for independent samples. Next, the averages of the EI, AAI and PAI indicators, for those present at and for the ones absent from the test, were compared at all stages, using the same statistical procedure. As the results of the three indicators are numerous and were very similar to each other, for the analysis of the difference of the grades in the phases only the results of the Enrollment Index (EI) will be presented as representative of these indicators.
Then, linear regression was used to impute probable grades of absent students in the PT, based on 10 imputations by the monotonic method, using the PT grade as the dependent variable and phase in the course, EI, AAI and PAI as the independent variables. This method, known as multiple imputation of missing data12),(14),(15),(17),(24, assumes the model known as “missing at random (MAR)” for the outcome, that is, in the context of the present research, it is assumed that the PT scores of absent students were associated with the same independent variables as those who participated in the PT. With the averages of the PT of the students present at the test and the probable averages of the absent students obtained by imputation, the differences in the 11 phases were calculated and these averages were compared with the t test .
Using linear regression, the relationship of the generated variables, differences in the PT scores (between those present and imputed to those absent) and the percentages of students who missed the test were tested.
The research was approved by the UFSC Human Research Ethics Committee, under number 5,261,272/2022. The Free and Informed Consent Term (FICT) was waived, as the data were received by the only researcher who analyzed them, anonymously, without identifying the respondents.
RESULTS
In 2019, of the 565 UFSC medical students who could participate in the PT, 443 (78.4%) attended the test and 122 (21.6%) did not attend it. Regarding gender, of the 306 male students, 79 (25.8%) were not present and of the 259 female students, 43 (16.6%) were absent. It is verified that the proportion of men who did not attend the 2019 PT is statistically higher than the proportion of women (p <0.01).
The averages of the academic performance indexes (EI, AAI and PAI) in the medical course, in the semester when the PT was applied, of students of both genders, present at and absent from the Progress Test, are shown in Table 1.
Table 1 Comparison of academic performance indexes (EI, AAI and PAI) obtained in the UFSC medical course of students present at and absent from the 2019 Progress Test
| Academic indicators | Present (n = 443) | Absent (n = 122) | t-test | ||||
|---|---|---|---|---|---|---|---|
| mean | SD | mean | SD | sign* | |||
| IE | 4,063 | 2,702 | 3,608 | 1,885 | 0.03 | ||
| AAI | 8,517 | 655 | 7,818 | 1,049 | 0.0001 | ||
| PAI | 8,567 | 532 | 8,077 | 543 | 0.0001 | ||
EI = Enrollment Index; AAI = Accumulated Achievement Index.
PAI = Proportional Achievement Index.
*Student's t-test: sign ≤ 0.05
Source: prepared by the authors.
The three academic performance indexes used at UFSC indicate that students who attended the PT test in 2019 had better performance in the course when compared to those who did not attend it. These differences were statistically significant for all three indicators.
The same comparison, using only the “EI” index, was carried out in the different phases of the medical course - Table 2. The comparisons in the phases, using AAI and PAI, showed similar results and will not be presented here.
Table 2 Comparison of the “Enrollment Index” (EI) indicator in the UFSC medical course of students present at and absent from the 2019 PT
| Phases in the course | Present students | Absent students | ||||||||
|---|---|---|---|---|---|---|---|---|---|---|
| N | mean | SD | N | mean | SD | Difference | sign* | |||
| 2 | 51 | 575 | 259 | 7 | 402 | 166 | 173 | ns | ||
| 3 | 43 | 1,220 | 66 | 9 | 1,197 | 161 | 23 | ns | ||
| 4 | 41 | 1,836 | 148 | 9 | 1,712 | 193 | 124 | 0.05 | ||
| 5 | 45 | 2,520 | 79 | 5 | 2,563 | 164 | -43 | ns | ||
| 6 | 43 | 3,080 | 409 | 19 | 2,698 | 202 | 382 | 0.001 | ||
| 7 | 38 | 3,659 | 552 | 16 | 3,387 | 347 | 272 | ns | ||
| 8 | 26 | 4,489 | 602 | 21 | 3,897 | 301 | 592 | 0.0005 | ||
| 9 | 25 | 5,583 | 298 | 23 | 5,113 | 275 | 470 | 0.001 | ||
| 10 | 45 | 6,459 | 253 | 4 | 6,283 | 446 | 176 | ns | ||
| 11 | 33 | 7,918 | 861 | 5 | 6,985 | 426 | 933 | ns | ||
| 12 | 53 | 8,494 | 401 | 4 | 8,377 | 533 | 117 | ns | ||
| Total | 443 | 4,063 | 2,702 | 122 | 3,608 | 1,885 | 455 | 0.03 | ||
*sign: diferença entre médias, teste-t de Student, ≤ 0,05.
Fonte: elaborada pelo autor.
In ten of the eleven phases (or semesters), the averages of the EI academic performance indicator were higher among the groups of students who attended the PT, when compared to the groups of absentees; differences were significant at four phases.
Using the three indicators of academic performance of the absent students, in the phase that was being attended, the imputation of the probable grades in the PT to the absent students was made by linear regression. The average scores at the PT of the present students, the percentages and average scores attributed to the absent students and the differences between the averages of those present and the ones attributed in each phase of the medical course are shown in Table 3.
Table 3 Comparison, at each phase of the course, of the average grades in the 2019 PT of the students present at the test and the grades attributed to those absent; percentages of absentees and differences between means.
| Phases in the course | All students | Present | Absent from the PT | ||||||
|---|---|---|---|---|---|---|---|---|---|
| N | average at the PT | N | % | imputed average | Difference between averages | sign* | |||
| 2 | 58 | 36.9 | 7 | 12.1 | 33.3 | 3.6 | ns | ||
| 3 | 52 | 35.6 | 9 | 17.3 | 33.9 | 1.7 | ns | ||
| 4 | 50 | 40.3 | 9 | 18.0 | 36.0 | 4.3 | 0.04 | ||
| 5 | 50 | 44.5 | 5 | 10.0 | 45.3 | -0.8 | ns | ||
| 6 | 62 | 49.0 | 19 | 30.6 | 43.8 | 5.2 | 0.01 | ||
| 7 | 54 | 42.7 | 16 | 29.6 | 39.2 | 3.5 | ns | ||
| 8 | 47 | 46.7 | 21 | 44.7 | 39.5 | 7.2 | 0.01 | ||
| 9 | 48 | 54.1 | 23 | 47.9 | 46.3 | 7.8 | 0.0001 | ||
| 10 | 49 | 57.9 | 4 | 8.2 | 54.1 | 3.8 | 0.05 | ||
| 11 | 38 | 56.6 | 5 | 13.2 | 47.9 | 8.7 | 0.04 | ||
| 12 | 57 | 59.9 | 4 | 7.0 | 60.0 | -0.1 | ns | ||
| Total | 565 | 47.4 | 122 | 21.6 | 42.1 | 5.31 | 0.0001 | ||
*Student's t-test: sign ≤ 0.05
Source: prepared by the authors
In nine of the eleven analyzed phases, the averages of the PT grades of the students present at the test were higher than the averages attributed to the absent students. In this analysis, the significant differences increased to six phases, with a predominance in the final phases of the course. In phases five and twelve, with a relatively low proportion of absentees, the scores attributed to those absent from the PT were higher than the scores of the PT participants, but the difference is not statistically significant.
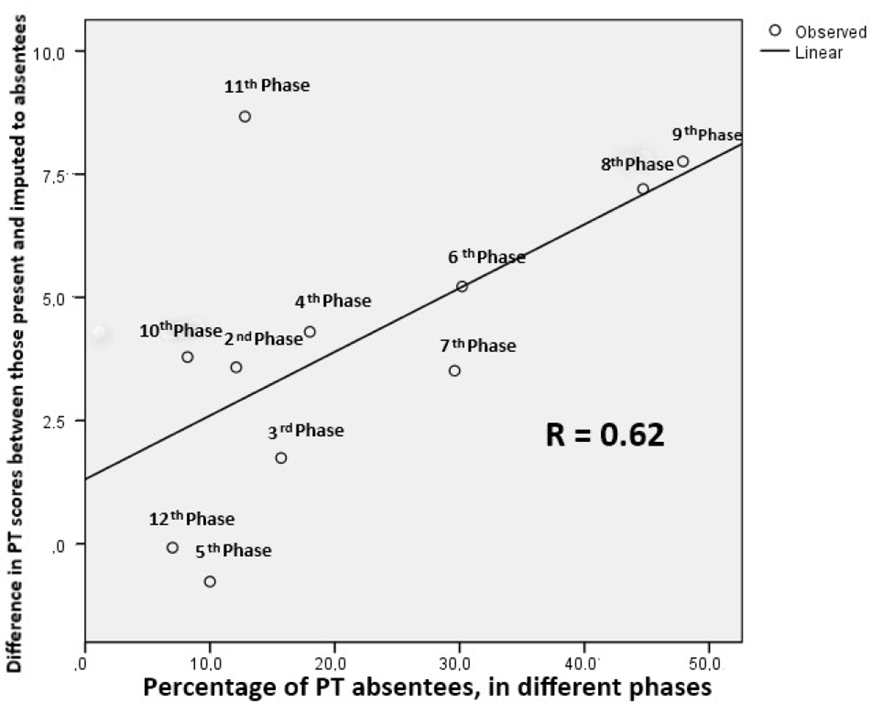
With the data, percentage of absentees and difference in the students’ grades in the PT and the grades attributed to the absentees described in Table 3, it is possible to verify whether there is a relationship between the two variables (Figure 1).
Source: Prepared by the authors.
Figure 1 Relationship, in the phases of the course, between the differences in the scores of students present at and absent from the Progress Test with the percentage of students absent from the 2019 PT
The regression showed that there is a positive linear relationship between the differences in the scores of students present at and absent from the Progress Test with the percentage of students absent from the PT. The “R” correlation was 0.62 (p < 0.0001) and the coefficient of determination “R2” was 0.38 (p < 0.0001). That is, there is a tendency that, as the percentage of absentees increases, the greater the difference between the scores of those present at the PT and the scores attributed to the absentees, as seen in Figure 1.
DISCUSSION
In the analyzed PT, 21.6% of UFSC students were absent from the test. This percentage was higher than those found in other studies on PT in Brazil, which describe less than 10% of absentees25)-(27. In the international literature, a Dutch article, which analyzed the use of PT in post-graduation for 14 years, reports an increase throughout the studied period from 1% to 16% of radiology residents requesting exemption from participation28. Regarding the significantly higher proportion of male students missing the 2019 PT, we did not find data in the national or international literature to compare our results. Differences between genders are observed in the literature on medical education, with men having a higher rate of absenteeism in classes, which is associated with higher failure rates29)-(31 and lower educational performance29),(32),(33. Women have a lower rate of conflicts inside medical schools32.
The analysis of the scores of three academic performance indicators (EI, AAI and PAI), comparing students present at with those absent from the PT, show that the group of absentees has worse academic performance. Using one of these indicators, called the Enrollment Index (EI), to separately analyze each of the 11 phases of the course, we observed that in 10 phases the group that did not attend the PT had worse academic performance than the group that participated in it. This measurement strongly suggests that absence from the PT does not occur randomly. The group of students who were absent from the PT showed a systematic tendency to be consisted of students with lower academic performance. In the literature on the PT, we did not find any other study that compared characteristics of students present at and absent from the test.
The finding that PT absenteeism does not occur randomly leads to two reflections. At the individual level, the literature on education suggests that student characteristics such as absenteeism from classes, social isolation, depression and language difficulties are risk factors associated with poor academic performance32. The present study suggests that absence from the PT could also be a sign of academic difficulty; therefore, it could, or perhaps, even should be considered a warning for early interventions to support this group of students, potentially with difficulties, aiming at pedagogical and social inclusion interventions.
At the institutional level, if the absence from the PT occurs in a systematic way, consisting mostly of a group with lower academic performance, then, with the increase in the proportion of absentees, the average performance in the PT of those present at the test tends to “apparently” increase the school result, making the latter biased6),(13),(15),(34, as shown in this study. There is no certainty, but researchers working with missing data statistics suggest in systematic absence that, when the proportion of missing students is greater than 5 to 10% of students in a course, the results will be biased (in this study it was 21.6%); when, however, the absences occur randomly, they do not significantly affect the results6),(20.
Therefore, it is reasonable to suggest that institutions with 10% or more of students absent from the PT establish policies to increase student participation. Making participation in the PT mandatory would be the first step. Scoring participation in the PT, in the school records of each student, would be another idea that could be discussed. To minimize the bias caused by missing data in school results, the use of some statistical strategy, such as data imputation, could increase the actual “representativeness” of the PT results.
The occurrence of missing data, shown in clinical or educational research, reduces the sample size and variability, decreasing the statistical power and external validity of the studies15),(24. On the contrary, the use of the multiple data imputation technique to calculate the absent students’ probable grade in the PT and the inclusion of these results preserves the size and variability of the samples. Reviews on the use of imputation of missing data in educational research can be found in the national4),(15 and international6),(17),(18 literature.
Overall, the missing data are classified as: Missing Completely at Random - MCAR, which do not change results; Missing at Random - MAR, which may or may not affect the results (depending on whether random absences affect different extracts under study in different manners); Missing Not at Random - MNAR, which affect the results12, such as those found in our study. However, after imputation of data, we observed that, specifically in the fifth and twelfth phases, the absentees’ performance was better (but not significantly) than that of students present at the PT. Therefore, it cannot be said that the absentees are always the students with the lowest academic performance.
The linear regression between differences in grades in the PT and the percentage of absentees, as seen in Figure 1, show that there is a relationship between the percentage of absentees and the average performance in the PT. The more absentees, the higher the average grade of those present at the PT. Therefore, it is reasonable to consider that, when internally comparing the results of a school25, or comparing the results between different schools or consortia8, information on the percentage of absentees should be included; moreover, that the missing data should be imputed, so that the expression of the results is closer to the representativeness of the global performance of the assessed schools.
Despite showing that absence from the PT does not occur at random, but systematically, that there is a relationship between the percentage of absentees and the difference between the grades of those present and the grades attributed to the absentees, and that it affects the results, the present study does not demonstrate as of what percentage of absentees the data do not represent the real values of the school. To more accurately verify which percentage affects the data, much larger samples would be needed than those used in the present study.
Another observed limitation is that it is a single-center study, based on only one test. In the period from 2011 to 2018, the absenteeism rates at the PT at UFSC ranged from 8.0 to 37.7% (average = 18.2%; SD = 10.5). The percentage of absentees of 21.6% found in this research is close to the average of nine years of PT at UFSC. Traditionally, the highest proportions of absentees were found among the students attending the seventh and eighth semesters. In 2019, there was an unusual absence of 47.9% of students in the ninth phase. The attempt to understand why this happened, and who the absentees were in the ninth phase, originated the present study. A similar analysis in relation to the absentees should be carried out in other schools, to confirm the external validity of the findings of this study.
Currently, in Brazil, there are groups willing to support the implementation of licensing exams for the exercise of the profession35),(36. This discussion is a heated one and occurs in many countries around the world, even without any research unequivocally showing the advantage of this type of assessment37),(38. As the licensing exam takes place at the end of undergraduate school, our fear is that it will (belatedly) fall only on the student and will not have consequences for the schools and on the quality of teaching. With or without licensing, it seems obvious to us that serial, longitudinal assessments, such as the Progress Test or the National Serial Assessment of Medical Students - ANASEM (Avaliação Nacional Seriada de Estudantes de Medicina)39, discarded by the federal government, should be encouraged and resumed. Assessments from the beginning of undergraduate school would allow students to implement an early correction of their paths and allow schools to do the same. They could greatly contribute to the quality of medical education.
FINAL CONSIDERATIONS
The current study shows that there is a positive correlation between male gender and absence from the PT (male students were more often absent); that the absences did not occur at random, but systematically, with the group of absentees predominantly consisting of students with lower academic performance. This suggests that the absence from the PT can be used as a potential marker and warning for students with poor performance, to establish policies to encourage and include them, from the initial or intermediate phases of the courses. It also shows that there was a correlation between the percentage of absentees and a possible change in the “actual” result (global representativeness) of the PT. The technique of multiple imputation of data to absentees can be used to estimate what the school grades would be if all students participated in the test.
It remains clear the importance of encouraging strategies to reduce the percentage of PT absentees in Brazil, of taking better care of this group of students and promoting actions to increase the representativeness of the PT results. This would contribute to making them more useful and reliable, valuing longitudinal assessments of students and courses and, consequently, contributing to public policies that will improve medical education in our country.
REFERENCES
1. Schüttpelz-Brauns K, Karay Y, Gehlhar K, Arias J, Zupanic M. Comparison of the evaluation of formative assessment at two medical faculties with different conditions of undergraduate training, assessment and feedback. GMS J Med Educ. 2020;37(4):1-23. [ Links ]
2. van der Vleuten C, Freeman A, Collares CF. Progress test utopia. Perspect Med Educ. 2018;7(2):136-8. [ Links ]
3. Heeneman S, Schut S, Donkers J, van der Vleuten C, Muijtjens A. Embedding of the progress test in an assessment program designed according to the principles of programmatic assessment. Med Teach. 2017 Jan 2;39(1):44-52. [ Links ]
4. Vinha LGA, Laros JA. Dados ausentes em avaliações educacionais: comparação de métodos de tratamento. Estudos em Avaliação Educacional. 2018;29(70):156-87. [ Links ]
5. Rawlings AM, Sang Y, Sharrett AR, Coresh J, Griswold M, Kucharska-Newton AM, et al. Multiple imputation of cognitive performance as a repeatedly measured outcome. Eur J Epidemiol. 2017;32(1):55-66. [ Links ]
6. Fernández-Alonso R, Suárez-Álvarez J, Muñiz J. Imputación de datos perdidos en las evaluaciones diagnósticas educativas. Psicothema. 2012;24(1):167-75. [ Links ]
7. Hayati Rezvan P, Lee KJ, Simpson JA. The rise of multiple imputation: a review of the reporting and implementation of the method in medical research Data collection, quality, and reporting. BMC Med Res Methodol. 2015;15(1):1-14. [ Links ]
8. Bicudo AM, Hamamoto Filho P, Abbade J, Hafner ML, Maffei C. Teste de Progresso em consórcios para todas as escolas médicas do Brasil. Rev Bras Educ Med. 2019;43(4):151-6. [ Links ]
9. Sakai MH, Ferreira Filho OF, Almeida M, Mashima D, Marchese M. Teste de Progresso e avaliação do curso: dez anos de experiência da medicina da Universidade Estadual de Londrina. Rev Bras Educ Med . 2008;32(2):254-63. [ Links ]
10. Tomic ER, Martins MA, Lotufo PA, Benseñor IM. Progress Testing: evaluation of four years of application in the school of Medicine, University of São Paulo. Clinics. 2005;6060(55):389-96. [ Links ]
11. Karay Y, Schauber SK. A validity argument for progress testing: examining the relation between growth trajectories obtained by progress tests and national licensing examinations using a latent growth curve approach. Med Teach . 2018;40(11):1123-9. [ Links ]
12. Rubin D. Multiple imputation for nonreponse in surveys. New York: Wiley; 1987. 258 p. [ Links ]
13. Sinharay S. Score reporting for examinees with incomplete data on large-scale educational assessments. Educ Meas Issues Pract. 2021;40(1):79-91. [ Links ]
14. Pedersen AB, Mikkelsen EM, Cronin-Fenton D, Kristensen NR, Pham TM, Pedersen L, et al. Missing data and multiple imputation in clinical epidemiological research. Clin Epidemiol. 2017;9:157-66. [ Links ]
15. Ferrão ME, Prata P, Alves MTG. Multiple imputation in big identifiable data for educational research: an example from the Brazilian education assessment system. Ensaio. 2020;28(108):599-621. [ Links ]
16. Shrive FM, Stuart H, Quan H, Ghali WA. Dealing with missing data in a multi-question depression scale: a comparison of imputation methods. BMC Med Res Methodol . 2006;6(57) [Acessado em 28/09/2021]. Disponível em: Disponível em: http://www.biomedcentral.com/1471-2288/6/57 . [ Links ]
17. Geraci M, Mclain A. Multiple imputation for bounded variables. Psychometrika. 2018;83(4):919-940. [ Links ]
18. Grund S, Lüdtke O, Robitzsch A. On the treatment of missing data in background questionnaires in educational large-scale assessments: an evaluation of different procedures. J Educ Behav Stat. 2021;46(4):430-65. [ Links ]
19. Universidade Federal de Santa Catarina. Sistema de Controle Acadêmico da Graduação - CAGR. UFSC; 2021 [acesso em 11 nov 2021]. Disponível em: Disponível em: https://cagr.sistemas.ufsc.br/ . [ Links ]
20. Vinha LGA. Estudos longitudinais e tratamento de dados ausntes em avaliações educacionais [Tese]. Brasilia: UnB; 2016. 124 p. [ Links ]
21. Nunes LN, Klück MM, Fachel JMG. Uso da imputação múltipla de dados faltantes: uma simulação utilizando dados epidemiológicos. Cad Saude Publica. 2009;25(2):268-78. [ Links ]
22. Associação Brasileira de Educação Médica. [Acessado em 28/09/2021] Disponível em:https://abem-educmed.org.br/acoes/. [ Links ]
23. Brasil. Diretrizes Curriculares Nacionais do curso de Graduação em Medicina. Brasilia: Ministério da Educação; 2014. p. 8-11. [ Links ]
24. Walani SR, Cleland CM. The multiple imputation method: a case study involving secondary data analysis. Nurse Res. 2015;22(5):13-9. [ Links ]
25. Sakai MH, Ferreira Filho OF, Matsuo T. Avaliação do crescimento cognitivo do estudante de medicina: aplicação do teste de equalização no Teste de Progresso. Rev Bras Educ Med . 2011;35(4):493-501. [ Links ]
26. Ferreira RC. Relação entre o desempenho no Teste de Progresso e na seleção para residência médica. [Tese] Campinas: Unicamp; 2019. 84 p. [ Links ]
27. Rosa MI, IsoppoI C, CattaneoI H, MadeiraI K, ADAMI F, Ferreira Filho OF. O Teste de Progresso como indicador para melhorias em curso de graduação em Medicina. Rev Bras Educ Med . 2017;41(1):58-68. [ Links ]
28. Rutgers D, van Raamt F, van Lankeren W, Ravesloot C, van der Gijp A, ten Cate T, et al. Fourteen years of progress testing in radiology residency training: experiences from The Netherlands. Eur Radiol. 2018;28(5):2208-15. [ Links ]
29. Fredj MB, Sahli J, Ezzaairi F, Ezzine A, Saad S, Ajmi T. Influencing factors of absenteeism among first cycle of medical students in the Faculty of Medicine of Sousse. Tunis Med. 2016;97(04):519-24. [ Links ]
30. Hakami AR. Effect of absenteeism on the performance of medical sciences students: gender differences. Med Educ Online. 2021; 26(1) [Acessado em 28/09/2021]. Disponível em: Disponível em: https://doi.org/10.1080/10872981.2021.1875531 . [ Links ]
31. Dunn MC, Kadane JB, Garrow JR. Comparing harm done by mobility and class absence: missing students and missing data. J Educ Behav Stat . 2003;28(3):269-88. [ Links ]
32. Maher BM, Hynes H, Sweeney C, Khashan AS, O’Rourke M, Doran K, et al. Medical school attrition-beyond the statistics a ten year retrospective study. BMC Med Educ. 2013;13(13):1-16. [ Links ]
33. MacKenzie RK, Cleland JA, Ayansina D, Nicholson S. Does the UKCAT predict performance on exit from medical school? A national cohort study. BMJ Open. 2016;6(10):e011313. [ Links ]
34. Wang L, Laird-Fick HS, Parker CJ, Solomon D. Using Markov chain model to evaluate medical students’ trajectory on progress tests and predict USMLE step 1 scores: a retrospective cohort study in one medical school. BMC Med Educ . 2021;21(200):1-9. [ Links ]
35. Mota A, Carvalho B, Candido L, Lomanto R, Maia T. Exame do Cremesp como indicador da qualidade do ensino médico. Rev Bras Educ Med . 2014;38(1):150-9. [ Links ]
36. Troncon LE. Licensing examinations: a necessary component to external evaluation of students and graduates of medical courses. Interface Comun Saúde Educ. 2019;24:e190576. [ Links ]
37. van der Vleuten C. Editorial - National licensing examinations and their challenges. J Heal Spec. 2013;1(1):1-2. [ Links ]
38. Bica RB, Kornis GE. Exames de licenciamento em Medicina: uma boa ideia para a formação médica no Brasil? Interface Comun Saúde Educ . 2020;24:1-16. [ Links ]
39. Brasil. Anasem - Avaliação Nacional Seriada dos Estudantes de Medicina - Documento Básico. Brasília: Inep, MEC; 2016. [ Links ]
Received: May 19, 2022; Accepted: September 21, 2022
 Este é um artigo publicado em acesso aberto sob uma licença Creative Commons
