


Servicios Personalizados
Revista

Articulo
 texto en
  Inglés (pdf)
 Articulo en XML
 Enviar articulo por email
Compartir

 Permalink
Acta Scientiarum. Education
versión impresa ISSN 2178-5198versión On-line ISSN 2178-5201
Acta Educ. vol.42 Maringá 2020 Epub 01-Mar-2020
https://doi.org/10.4025/actascieduc.v42i1.44903
TEACHERS' FORMATION AND PUBLIC POLICY
Monitoring and evaluation of Mato Grosso do Sul State education plan (2014-2024)

1Universidade Católica Dom Bosco, Av. Tamandaré, 6000, 79117-010, Campo Grande, Mato Grosso do Sul, Brasil.
This paper is part of a master’s degree dissertation in Education, and has the goal to analyze the enforcement of Target 2 - Mato Grosso do Sul State Education Plan (2014-2024), for the purpose of spreading basic education of nine years to all population from 6 to 14 years of age, and to guarantee at least 95% of the students finishing this stage in the recommended age, as well as the strategy 2.4, which aims to create, from 2015, mechanisms that benefit school flow. This research consisted in systematization, analysis and gathering of documents made through federal and state governments, such as legislation, educational programs, messages to the Legislative Assembly, laws, decrees and official gazettes. It was shown that, although the state had developed some actions which aimed to secure the access to this stage, it still hasn’t secure the permanence of students through all years of basic education.
Keywords: educational planning; universalization of elementar school; access and permanence
Este artigo é parte de uma dissertação de mestrado em Educação, tem como objetivo analisar o cumprimento da Meta 2 - Plano Estadual de Educação de Mato Grosso do Sul (2014-2024), com a finalidade de universalizar o ensino fundamental de nove anos para toda a população de 6 a 14 anos e garantir que pelo menos 95% dos estudantes concluam essa etapa na idade recomendada, bem como a estratégia 2.4, que objetiva criar, a partir de 2015, mecanismos que favoreçam o fluxo escolar. A pesquisa compreendeu coleta, sistematização e análise de documentos produzidos em âmbitos federal e estadual, como legislação, mensagens à Assembleia Legislativa, programas educacionais, leis, decretos e diários oficiais. Demonstrou que, embora, o estado tenha desenvolvido algumas ações que objetivam assegurar o acesso a essa etapa, ainda não conseguiu assegurar a permanência dos alunos no ensino fundamental.
Palavras-chave: planejamento educacional; universalização do ensino fundamental; acesso e permanência
Este artículo es parte de una disertación de maestría en Educación, tiene como objetivo analizar el cumplimiento del Meta 2: Plan Estatal de Educación de Mato Grosso do Sul (2014-2024), con el fin de universalizar la enseñanza primaria de nueve años para toda la población de 6 a 14 años y garantizar que al menos el 95% de los estudiantes completen esta etapa en la edad recomendada, así como la estrategia 2.4, que pretende crear a partir de 2015, mecanismos que favorezcan el flujo escolar. La investigación comprendió recolección, sistematización y análisis de documentos producidos en ámbitos federales y estatales, como legislación, mensajes a la Asamblea Legislativa, programas educativos, leyes, decretos y diarios oficiales. Demostró que, aunque el estado ha llevado a cabo algunas acciones encaminadas a garantizar el acceso a esa etapa, todavía no ha logrado garantizar la permanencia de los alumnos en la enseñanza primaria.
Palabras clave: planificación educativa; universalización de la enseñanza primaria; acceso y permanencia
Introduction
This paper has the goal to approach the Mato Grosso do Sul State Education Plan - PEE/MS (2014-2024), approved by the Law n. 4621, of December 22nd of 2014 (Mato Grosso do Sul, 2014), from the second government term (2011-2014) of André Puccinelli, who’s from the Brazilian Democratic Movement Party (PMDB2), in accordance to the Law n. 13.005, of June 25th of 2014 (Brasil, 2014a), approved the National Plan of Education (PNE 2014-2024), from the second presidential term of Dilma Vana Rousseff (2011-2016), who is from the Worker’s Party (PT).
The research is focused on monitoring and evaluating Target 2, which has as a goal “[...] to spread basic education of nine years to all population of 6 to 14 years of age, guaranteeing at least 95% of the students finishing this stage in the recommended age, until the last year of validation of this PEE [...]”, and the strategy 2.4, which predicts “[...] to create, from the first year of validation of this PEE, mechanisms to ensure the permanence and learning process of all students among basic education, favoring the school flowing” (Mato Grosso do Sul, 2014, p. 24).
For such, it aimed to verify if the state of Mato Grosso do Sul, since the approval of the PEE/MS until the year of 2016, during the term of Reinaldo Azambuja Silva (2015-2016), who is from the Brazilian Social Democratic Party (PSDB), presented actions that could guarantee the permanence and the learning process of basic education students, favoring the school flow.
The approach used consisted in documental research and analysis of the data provided by INEP, Brazilian Institute of Geography and Statistics and National Household Sample Survey (IBGE/Pnad) and the Observatory of PEE/MS, in the situational analysis presented and from the Messages to the Legislative Assembly, to examine how this goal and strategy were shaped by the years of 2015 to 2017.
The PNE (2014-2024) is a legal document, approved by law, which registers the State policies and not by the government, since is a final document which came from discussions between the civil and political society. This means the contents from the goals, purposes and strategies establish the course of state actions and express the summary of the negotiations, intentions, ideologies and disputes of the participating groups of its preparation. This coverage requests the qualification of terms, guidelines, goals, purposes and strategies, to clarify how foundations, aims and actions are formed.
The guidelines, according to the Educational Planning in Brazil (Bordignon, Queiroz e Gomes, 2011), establish the parameters and period for the normative orientations already defined by policies. In turn, the goals translate the institutional challenges, the collective commitments, and guide, in an effective way, the actions. Goals can be understood as the qualified intention or the known purpose. The strategies are related to the process and procedures responsable of improving the goals. In that way, it’s able to say that guidelines and purposes form the foundations of the plan, in terms of orientation and aims of the actions expressed by the document. The goals and strategies of an education plan clarify the way guidelines and purposes will guarantee the right of education as a right to all and a duty of the State (universality), prescribed in the Article 205 of the Federal Constitution of 1988 (Brasil, 1988).
The PEE/MS (2014-2024), with goals and strategies alligned to the PNE (2014-2024), specifies that the foundations and guidelines are directed to the eradication of the analphabetism, to the universalization of the school services and for the overcoming of educational inequalities, with emphasis in the promotion of citizenship and in the eradication of all kinds of discrimination, in every level, step and category of teaching for the state of Mato Grosso do Sul.
For the enforcement of Target 2, the state must execute actions that may guarantee the universalization, according to strategy 2.4, it must search from the first year of validation of the PEE/MS (2014-2024), creating mechanisms that will secure the permanence and learning process of basic education students. Therefore, it cannot be denied that this plan is an achievement of movements that defend and fight for na education which attends the constitutional determination of universalization as a social right.
The word universal, according to Oliveira (1999, p. 71), means “[...] population totality [...]”, in other words “[...] to all, indiscriminately [...]”, therefore, to all human beings. When it comes to universalization, multiplicity is proposed, an all quantity. Its contrary means for few, unique, private, in less quantity.
Target 2 of the PEE/MS (2014-2024)
The target 2, of PEE/MS (2014-2024), is one of the structural goals that aims, according to the document Planning the next decade - knowing the 20 goals of the national education plan (Brasil, 2014b), to guarantee the right to effective basic education, making connections with universalization, which suggests the construction of processes that aim to decrease failure and drop out rates, distortion on age-grade, and on access and offering education to all, including the ones who weren’t able to complete basic education before turning fourteen years old.
The structuring goals aim to promote the modification of a society divided in status and change the division of wealth, by comprehending the way society has been organizing itself and creating hegemonic contents, which will, over time, accentuate the wealth of few and the poverty of many (Mato Grosso do Sul, 2014).
These structuring goals mark the foundations and intentionality of the plan and indicate the path in which policies must follow to enforce it, establishing the context of state actions, as they overcome obstacles and limitations to the effectiveness of this plan. With that, according to the document Planning the next decade - knowing the 20 goals of the national education plan (Brasil, 2014b), the first movement towards the universalization of this step of basic education begins. Another movement is made by guaranteeing the access and permanence of the students through all stages of basic education.
Target 2 creates a relation between spreading and guaranteeing education provision, having the effective learning process as focus inside school facilities and, in return, demonstrated the concern towards containing the distortion of age-grade in a 10 years period. The strategy 2.4 brings as a commitment to create, from 2015, actions that promote permanence and learning process of basic education students.
Given these determinations, by thinking in universalization, three actions cannot be ignored: a) the acknowledgment and guarantee of the right to education in free and mandatory basis; b) elaboration of school access and provision, in a way to be close to the 95% net rate of schooling of students, and c) accountability towards the PNE (2014-2024) and its local plan.
In general, the state public schools of Mato Grosso do Sul (REE/MS), in urban área, in 2016, according to the Legislative Assembly of Mato Grosso do Sul (Mato Grosso do Sul, 2017), had: a) 315 schools; b) 4.171 classrooms existent and 3.885 occupied; c) 12.081 teachers; d) 267 registrations in daycares and 161 in pre-schools in infant education modality; e) 44.994 registrations in the early years and 83.307 in the final years of the elementary education; f) 74.749 registrations in regular education and 1.964 in normal/magisterium in high school; and g) 7.091 registrations in elementary school, 18.760 in high school and 1.807 in urban Projovem, all of them included in the young-adult and adult modality.
The number of registrations in different modalities of teaching published by the Mato Grosso do Sul State Education Secretary (SED/MS), referring to the year of 2016 (Mato Grosso do Sul, 2017a), allows us to visualize if there were any directed actions, especially when it comes to the net rate of schooling of 95% of the students, and if such actions contribuite to the enforcement of the Target 2, as shown in Table 1.
Table 1 Registrations in elementary education in Mato Grosso do Sul; state public schools, in urban area, in schools with elementary education (2014-2016).
| Years - Grades | 2014 | 2015 | 2016 | |
| Early grades | Registration 1st grade - students | 5.719 | 5.889 | 6.273 |
| Registration 2nd grade - students | 8.623 | 8.428 | 8.784 | |
| Registration 3rd grade - students | 9.735 | 9.040 | 9.081 | |
| Registration 4th grade - students | 11.003 | 10.063 | 9.740 | |
| Registration 5th grade - students | 12.143 | 11.618 | 11.116 | |
| Final grades | Registration 6th grade - students | 20.330 | 20.103 | 20.164 |
| Registration 7th grade - students | 20.914 | 20.523 | 21.540 | |
| Registration 8th grade - students | 18.260 | 19.548 | 19.116 | |
| Registration 9th grade - students | 17.797 | 19.094 | 22.487 | |
| Total | 124.524 | 124.306 | 128.301 | |
Source: School Census/INEP 2016 (QEdu, 2017a). Elaborated by the author.
In the data of Table 1, referring to the years of 2014 and 2015, in special, to the first years of elementary education, a growth can be observed in the registrations of the 1st grade in almost 3%, in other words, 5.719 registrations of the 1st grade, to 5.889 registrations of the 1st grade in 2015. Among other years, there was a decrease. A likely reason is the failure rates and high levels of distortion between age-grade.
In the initial years of elementary education, when compared to 2015, in 2016, there was an increase of registrations, being expressive in the 1st grade with 6,5%, in which, of 5.889 in 2015 to 6.273 in 2016, which can be a consequence of the reduction of failure rates. However, the 4th and 5th initial years of elementary education went to an opposite way, by presenting a decrease in registrations.
At the early years of elementary education, the trend on the decrease of registration rates was kept between the years of 2014 and 2015, but there was an increase in the registration on 8th and 9th grades, nearly 7% for both grades. The decrease can be attributed to the reduction of failure rates, dropouts and distortion of age-grades on this period of time.
About the final years, comparing 2015 to 2016, it was stated an increase of registrations on the 6th grade, among 0,3%, which means, 20.103 students registered in 2015 to 20.164 students in 2016. On the 7th grade, the increase was around 4,95%, 20.523 students registered in 2015 to 21.540 in 2016. On 8th grade, there was a reduction, and on 9th grade, an increase of 17,77%, going from 19.094 students registered in 2015 to 22.487 students in 2016.
The Message to the Legislative Assembly (Mato Grosso do Sul, 2016), emphasized the creation and operation of Scientific Research Laboratories installed in 2015 and 2016, financed by the state government, in the amount of R$ 43.407,00 (forty-three thousand four hundred and seven reais), with approximately 110 facilities, capable to assist 9.300 students, located in six municipalities. This initiative made possible to the students to be envolved in teaching activities towards the improvement of the quality of education.
It is important to remind that the right to education requires, for its effectiveness, structures that ensure the access, permanence and learning process, the conclusion in the right age. If the right is not implemented, the opposite will happen; the lawlessness, characterized by failure/enrolment, dropouts, lack of access and permanence in schools. The lawlessness confronts and denies human rights, amplifies social injustice, inequalities, benefiting the rights of the hegemonic class, since not all people are subject to that right.
The Table 2:
Table 2 Percentage of children from 6 to 14 years registered in elementary school - net rate of registration
| Year | Total | |
| 2012 | 97,2% | 318.214 |
| 2013 | 97,3% | 333.899 |
| 2014 | 97,2% | 353.582 |
| 2015 | 97,9% | 337.570 |
Source: IBGE/Pnad / Preparation: All For Education (PNE Observatory [OPNE], 2017a).
The data in Table 2 shows the increase of 0,7% in the number of children from 6 to 14 years registered in elementary education - net rate of registration, between the years of 2012 and 2015. It went from 97,2% in the number of children, in 2014, to 97,9%, in 2015.
Figure 1, next, demonstrated the percentage of children from 6 to 14 years registered in elementary school - net rate of registration.
From Figure 1, in 2015, the rate of growing in Mato Grosso do Sul surpassed the national rate in 0,2%, which means, in Brazil, during 2015, the rates were of 97,7%, and in Mato Grosso do Sul, of 97,9%.
The PNE Observatory (OPNE) (2017b) reports that, to guarantee school access, Target 2 of PNE (2014-2024) establishes that all children from 6 to 14 years old should be registered in elementary schools until 2024. Based on the data provided by PNAD/IBGE, the index calculated by the movement All For Education points out that, since 2009, there was
[...] growth in the net rate of registration in the level of basic education, reaching the mark of 97,7%, in 2015. In absolute numbers, approximately 26,2 millions of children in this age group were registered in elementary education, while a few more than 430 thousand didn’t attend school (OPNE, 2017b).
Still according to the PNE Observatory (2017b), the percentage of access to elementary education in 2015 consists in encouraging signs to “[...] the enforcement of the goal, once the access is very close to becoming universal. Considering the pace of growth presented from 2014 to 2015, the data indicated that, possibly, the goal will be reached in the predicted period of time” (OPNE, 2017b).
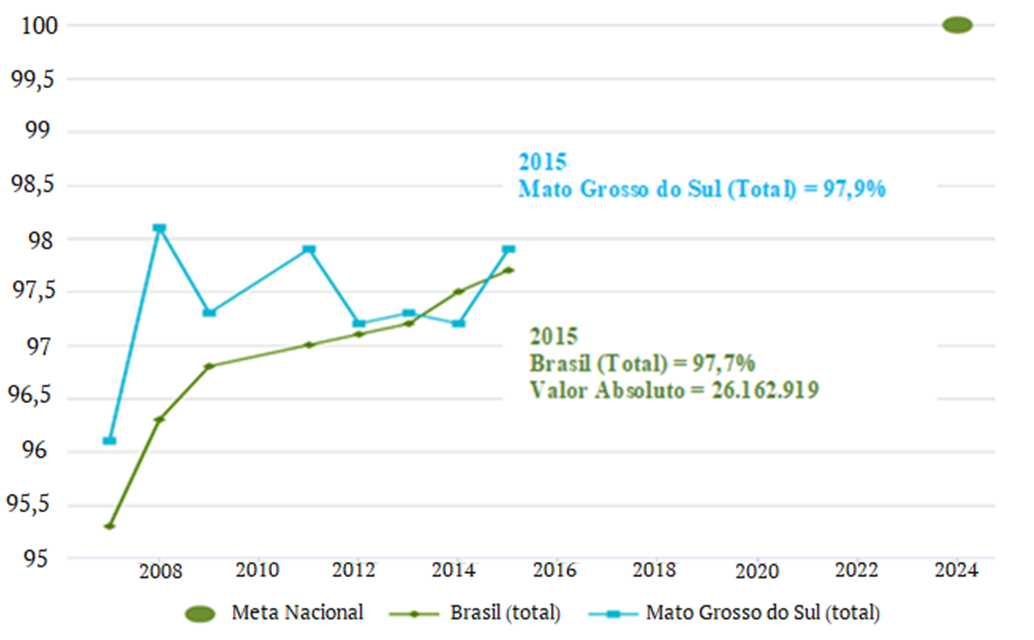
Figure 1 Percentage of children from 6 to 14 years old registered in Elementary Education - net rate of registration.
Source: IBGE/Pnad / Preparation: All For Education (OPNE, 2017a). Graphic adapted by the author.
In this scenery, to the universalization of access, the Observatory shows that the enforcement of Target 2, when referring to registration, leaves a positive impression, considering the pace of growth presented from 2014 to 2015, possibly, Target 2 will be reached in the predicted period of time.
On the second analysis of Target 2, which predicts at least 95% of the students finishing elementary education in the recommended age until the last year of validation of PEE/MS (2014-2024), the goal was to observe if the state of Mato Grosso do Sul had evolved in the rates of school permanence. The student’s permanence is related to school performance rates, which includes the quantification of failure, dropouts and approval.
In Table 3, next, the rates of school performance regarding failures is presented above 5%, showing a concerning situation within the advance of school evasion. Above 15%, it demands measures which will evaluate and intervene in the work of teachers (QEdu, 2017b).
Table 3 shows that, in 2014, the failure index of the early years of elementary education was high from the 2nd grade until the 5th grade, with the 1st grade being at practically zero. In 2015 and 2016, the failure rates were also high, but tending to decrease when compared to those other two years. In total among the early years of elementary education, there is a decrease of almost 1% per grade, which means, from 11,9% in 2014, to 10,8% in 2015, and to 9,6% in 2016. If this tendency remains, it may get to 1% in the last year of the PEE/MS, in 2024.
Table 3 Performance rates - failure/elementary education.
| Years | Grades | Failure | |||||
| 2014 | 2015 | 2016 | |||||
| Rate | Students* | Rate | Students* | Rate | Students* | ||
| Early Grades | 1st grade | 0,1% | 6 | 0,0% | none | 0,0% | none |
| 2nd grade | 20,4% | 1.760 | 18,4% | 1.551 | 16,5% | 1.450 | |
| 3rd grade | 15,3% | 1.490 | 14,1% | 1.275 | 11,9% | 1.081 | |
| 4th grade | 11,3% | 1.244 | 10,4% | 1.047 | 9,7% | 945 | |
| 5th grade | 9,3% | 1.130 | 8,6% | 1.000 | 7,5% | 834 | |
| Total early grades | 11,9% | 5.627 | 10,8% | 4.872 | 9,6% | 4.309 | |
| Final Grades | 6th grade | 22,2% | 4.514 | 20,1% | 4.041 | 16,5% | 3.328 |
| 7th grade | 22,5% | 4.706 | 20,9% | 4.290 | 16,4% | 3.533 | |
| 8th grade | 21,1% | 3.853 | 16,8% | 3.285 | 13,5% | 2.581 | |
| 9th grade | 20,7% | 3.684 | 15,7% | 2.998 | 11,6% | 2.609 | |
| Total final grades | 21,7% | 16.756 | 18,4% | 14.612 | 14,5% | 12.049 | |
*Approximate number of students who didn’t present the needed requirements of school achievement/frequency (Scholar Census 2016, Inep; Non-official ranking [QEdu, 2017b]). Table elaborated by the author.
Table 3 points out the failure rates in the final grades of scholarship higher than the rates of early grades of elementary education already analyzed. The increase of failure rates is related to the final grades of elementary education, especially 5th and 6th grades, with a tendency of declining. Among the total of the final grades of elementary education, the index was 21,7% in 2014, decreasing in 18,4% in 2015, to 14,5% in 2016, presenting an average reduction of 3,6% per year.
Therefore, a vertical analysis on the number of failure among all grades, especially in 2015 and 2016, comparing 2016 with 2015 and 2014, the failure rates are shown to be reduced.
The data on dropouts, expressed by Table 4, reports a decrease among early and final grades of elementary education, when analyzing the years of 2014 to 2015. From the 1st to 9th grade, it is shown that the highest levels of dropouts are related to the passing of the student from the 5th to the 6th grade, as in 2014, in which the 5th grade index was in 1,1%, while the 6th grade had 4,0%, increasing until the last grade of the final grades of elementary education, with 8,0%. Related to 2015 and 2016, there are still dropouts, but with decreasing rates.
Table 4 Performance rates - dropout/elementary education.
| Years | Rates | Dropout | |||||
| 2014 | 2015 | 2016 | |||||
| Rate | Students* | Rate | Students* | Students | Rate* | ||
| Early grades | 1st grade | 0,8% | 46 | 0,6% | 36 | 0,6% | 38 |
| 2nd grade | 0,6% | 52 | 0,5% | 43 | 0,6% | 53 | |
| 3rd grade | 0,5% | 49 | 0,6% | 55 | 0,4% | 37 | |
| 4th grade | 0,9% | 100 | 0,8% | 81 | 0,6% | 59 | |
| 5th grade | 1,1% | 134 | 0,9% | 105 | 1,2% | 134 | |
| Total early grades | 0,8% | 379 | 0,7% | 317 | 0,7% | 319 | |
| Final grades | 6th grade | 4,0% | 814 | 3,6% | 724 | 3,1% | 626 |
| 7th grade | 4,7% | 983 | 4,8% | 986 | 4,5% | 970 | |
| 8th grade | 6,2% | 1.133 | 4,6% | 900 | 3,5% | 670 | |
| 9th grade | 8,0% | 1.424 | 7,1% | 1.356 | 5,1% | 1.147 | |
| Total final grades | 5,6% | 4.353 | 5,0% | 3.964 | 4,1% | 3.411 | |
* Approximate number of students who didn’t present the needed requirements of school achievement/frequence (Scholar Census 2016, Inep; Non-official ranking Qedu, 2017b). Table elaborated by the author.
At early grades of elementary education, there’s a slight decrease of school dropout of approximately 0,1%, from 2014 to 2015. However, from 2015 to 2016, there was a stagnation. Related to the total of final grades in elementary education, the decrease in dropouts went to 0,6% from 2014 to 2015; and a decrease in 0,9% when compared to 2015 and 2016. If an average decrease of 0,75% is visualized through these years, in 2021, there would be no dropout rates for the final grades.
Following the analysis, it comes to the approval rates, as shown in Table 5.
Table 5 Performance rates - approval/elementary education.
| Years | Grades | Approval | |||||
| 2014 | 2015 | 2016 | |||||
| Rate | Students* | Rate | Students* | Rate | Students* | ||
| Early grades | 1st grade | 99,1% | 5.668 | 99,4% | 5.854 | 99,4% | 6.236 |
| 2nd grade | 79,0% | 6.813 | 81,1% | 6.836 | 82,9% | 7.282 | |
| 3rd grade | 84,2% | 8.197 | 85,3% | 7.712 | 87,7% | 7.965 | |
| 4th grade | 87,8% | 9.661 | 88,8% | 8.936 | 89,7% | 8.737 | |
| 5th grade | 89,6% | 10.881 | 90,5% | 10.515 | 91,3% | 10.149 | |
| Total early grades | 87,3% | 41.218 | 88,5% | 39.851 | 89,7% | 40.368 | |
| Final grades | 6th grade | 73,8% | 15.004 | 76,3% | 15.339 | 80,4% | 16.212 |
| 7th grade | 72,8% | 15.226 | 74,3% | 15.249 | 79,1% | 17.039 | |
| 8th grade | 72,7% | 13.276 | 78,6% | 15.365 | 83,0% | 15.867 | |
| 9th grade | 71,3% | 12.690 | 77,2% | 14.741 | 83,3% | 18.732 | |
| Total final grades | 72,7% | 56.194 | 76,6% | 60.693 | 81,4% | 67.848 | |
*Approximate number of students who didn’t present the needed requirements of school achievement/frequency (Scholar Census 2016, Inep; Non-official ranking Qedu, 2017b). Table elaborated by the author.
According to Table 5, the approval rates are more accentuated in 2014 to 2016, when there is an evident and progressive increase. On early years of elementary education, totally, there’s a regular increase of 1,2% between grades. If this projection maintains, in 2024, the percentage will be of 98,1%.
At the final grades of elementary education, the number of successful students is smaller then the early grades. When it comes to analyzing the quantity of students, there is a significant rate approval at the 9th grade. At the final grades, totally, there is an increase of 3,9% between 2014 and 2015, and 4,8% between 2015 and 2016, a 0,9% variation. If this rate is kept, there would be, in 2019, a rate of 100%. Therefore, an analysis of the present rates was performed in failure, dropout and approval elements, form 2014 to 2016, at the early and final grades of elementary education, which, when summed, gets to 100%.
The PNE Observatory (2017b) determined that the recommended age for the conclusion of elementary school is of 16 years. Therefore, Table 6, shown next, shows the percentage of young adults that concluded elementary education in Mato Grosso do Sul.
Table 6 Percentage of young adults of 16 years that concluded Elementary Education.
| Year | Total | ||
| 2012 | 52,7% | 24.468 | |
| 2013 | 69,6% | 29.118 | |
| 2014 | 64,9% | 26.550 | |
| 2015 | 65,5% | 24.298 | |
Source: IBGE/Pnad / Preparation: All For Education (OPNE, 2017b).
Table 6 shows the increase in the number of young adults who are 16 years old, and that concluded Elementary education. To enforce the target of 95% of the students finishing elementary school at the recommended age, the state of Mato Grosso do Sul would achieve 29,5% in nine years, an annual average of 3,28% from 2016 to 2024.
Figure 2, next, demonstrates the number of teens of 16 years old that finished Elementary school. According to the figure, the state of Mato Grosso do Sul is below the percentage of young people who finished Elementary school in Brazil, presenting the percentage of 65,5% in 2015, while Brazil hit 76%, a difference of 10,5%, but with a slight inclination towards the increase when observing from 2014 to 2015.
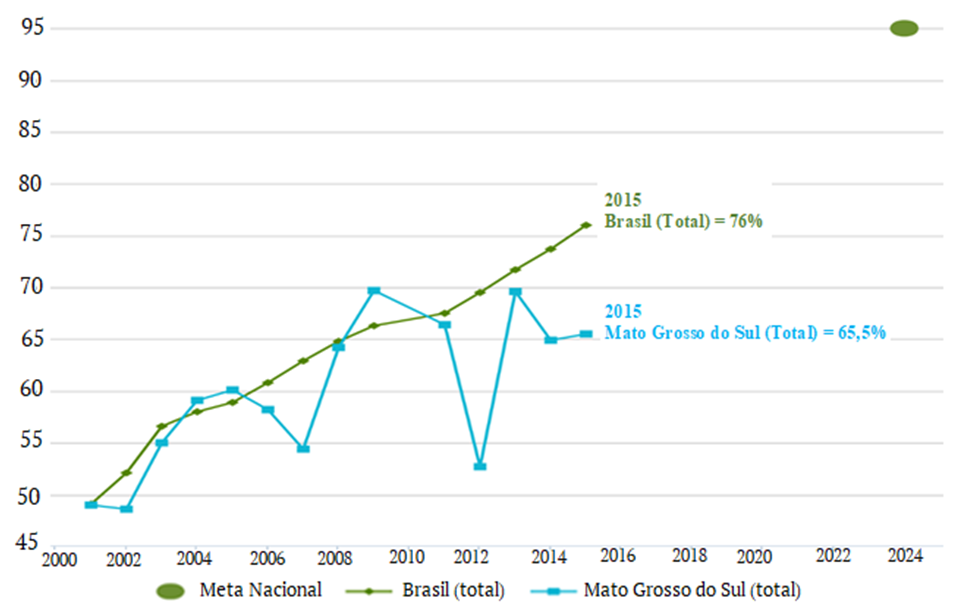
Source: IBGE/Pnad / Preparation: All For Education (OPNE, 2017b). Graphic adapted by the author.
Referring to 2015, the PNE Observatory website (2017a), explains that, to meet the guideline about students finishing elementary education at proper age, PNE (2014-2024) set Target 2, in which specifies that 95% of the students need to complete elementary education at 16 years of age, until 2024. As it is shown the index calculated by the All For Education movement, from the data provided by PNAD/IBGE, since 2001, there’s been a continuous increase when it comes to the percentage of teens whom have concluded this cycle of schooling, hitting 76% of the mark in 2015. In absolute numbers, 2,6 millions of students finished this level, however, more than 800 thousands of teens at 16 years of age couldn’t finish their studies.
Although numbers have shown a progress, the pace of growth presented may not be enough for the enforcement of the Target. From 2011 to 2015, there was a growth of 8,5 percentage points. According to the PNE Observatory (2017a), this result is not enough for Brazil to strike the mark of 95% at the predicted year. This knowledge can also be extended to the state of Mato Grosso do Sul, once the growth was below the expectations during the meantime of 2014 to 2015.
The analysis of the data referred to age-grade distortion is important to address the enforcement of Target 2. These results show the cost for the Brazilian State and for the students to those public schools that are not following the national policy expressed by the plan, once the young people fail again at the same grade, finishing their studies out of the proper age range.
As the Table 7 demonstrates, the age-grade distortion had a narrow decrease. However, it kept itself unchanged at 3rd, 4th and 5th grade. When noticing the total rate of age-grade distortion at early and final grades of the elementary school, it is stated a drop of 1% per year. It is able to conclude, in case this decrease is kept, this percentage may reach 12% total at the early grades in 2024.
According to the National Institute for Educational Research and Studies (Brasil, 2015, p. 2), one of the ways to examine the indexes of age-grade distortion is to verify if the teaching network is able to implement the right to education, in other words, if it is “[…] dissolving the barriers to the access and permanence, reducing inequalities, promoting human rights and guaranteeing proper training for work and the exercise of citizenship”.
Table 7 Age-grade distortion /elementary education.
| Years | Grades | Age-grade distortion | ||
| 2014 | 2015 | 2016 | ||
| Early grades | 1st grade | 3% | 2% | 2% |
| 2nd grade | 16% | 15% | 13% | |
| 3rd grade | 23% | 23% | 23% | |
| 4th grade | 26% | 26% | 26% | |
| 5th grade | 30% | 28% | 28% | |
| Total early grades | 22% | 21% | 20% | |
| Final grades | 6th grade | 39% | 39% | 37% |
| 7th grade | 38% | 41% | 43% | |
| 8th grade | 41% | 34% | 36% | |
| 9th grade | 43% | 40% | 38% | |
| Total final grades | 40% | 39% | 38% | |
Source: Inep, 2016. Organized by: QEdu, 2016 (QEdu, 2017a). Table drafted by the author.
Monitoring and evaluation
In March of 2017, the first report of monitoring and evaluation of the State Education Plan: goals and strategies, was drafted by the Commission of Monitoring and Evaluation of the State Education Plan, composed by ten governmental and non-governmental institutions (Mato Grosso do Sul, 2017b).
This first report presented mechanisms elaborated by the groups and subgroup of the FEE/MS Observatory and of the Technical Assistance Network team of SASE/MEC, for the monitoring of the PEE and the Municipal Education Plans, during its term until 2024.
For so, this commission created indexes, variables and operations to systematize the monitoring process, with the goal of orienting the evaluation of each goal, their strategies and transforming informations in quantitative and qualitative data. It is based on these indexes that the variable are chosen. Thereafter, with all proper data collected and stored, the monitoring is done to investigate if the purposes of the plan are being enforced (Mato Grosso do Sul, 2017b).
Table 8 demonstrates strategy 2.4 of Target 2 of PEE/MS (2014-2024), with its indexes, variables and calculations. These mechanisms made possible for the monitoring group to understand the real situation regarding the educational area in Mato Grosso do Sul, the coverage of the proposed goals and the distance from what was thought and desired.
Table 8 Monitoring Target 2, strategy 2.4.
| Goal/strategy | Indexes | Variables | Calculation |
| 2.4 - To create, from the first year of this PEE, mechanisms to ensure the permanence and the existence of a learning process for the basic education students, favoring school flow. | Existence of mechanisms that ensure the permanence and the learning process of basic education students | A = Existence of mechanisms that ensure the permanence and learning process of basic education students. | Index 2.4A = A |
Source: 1º report of Monitoring and Evaluation of the state education plan: systematization of goals and strategies (Mato Grosso do Sul, 2017b, p. 26).
The FEE/MS Observatory (OPNE, 2017a) presented the monitoring systematization, but did not developed the operational system for obtaining analytical data. As a result, although there are achievements for the guarantee of the access, the actions until now set did not obtain the proper success when it comes to the permanence of the students in the final grades of basic education.
This complicated reality enforces, as a challenge, to ensure the right to education until the end of the PEE/MS, in 2024, demonstrates that the universalization has not been implemented in the way it should, once the access is guaranteed, but not the permanence. Therefore, there is still a process of lawlessness materialization, once the education is not reachable for many. School permanence is a substantial dimension for the exercise of citizenship, and when the right to education does not follow this path, citizenship becomes a privilege for few.
From 2015 to 2016, according to the Message to the Legislative Assembly (Mato Grosso do Sul, 2016), SED/MS, concerned about dropouts and failure rates, as part of the Offer Expansion Program (2017-2018), which had as projects ‘Correction of the school flow’ and ‘Analysis of teaching conditions’, elaborated strategies to elevate the quality of teaching at state public schools. With this action, SED/MS aimed to reduce school evasion and failures, amplifying continuous training processes, full-time schools offers, and the participation of the school community in the elaboration of a political-pedagogic project for schools.
In 2018, the Message to Legislative Assembly (Mato Grosso do Sul, 2017c), is accountable of the actions which aimed to guarantee the students permanence in elementary schools, promoting school flow, which were: 40 school facilities were restructured; accessibility actions were made in 12 schools; 360 teachers and 260 administrative servant were called to fill vacancies; three more programs were created: Continuous training tor Education Professionals, Education Web and Full-time Schools. For these actions, the amount invested were of R$ 2.371.170,10 (two million, three hundred and seventy-one thousand, one hundred and seventy reais and ten cents).
The realization of universalization demands actions by the Public Authorities. It has to safeguard the equality of access to education, the permanence and conclusion conditions for all the students, and the popular participation through decision processes when it comes to public policies.
However, it is of crucial importance that every citizen have the understanding that, for the effectiveness of social rights, the society needs to charge (beyond voting) the existence of actions to secure the universalization of school services.
Final considerations
After discussing about monitoring and evaluating Target 2 and strategy 2.4 of PEE/MS (2014-2024), it can be implied that the evolution of basic education registrations on REE/MS, between the years of 2014 and 2016, had an increase in the number of students. Therefore, although in 2014 REE/MS had registered 124.524 students, in 2015, this number dropped to 124.306, showing a loss of 198 students. However, in the year of 2016, the REE/MS registered 128.301, recovering 3.995 students. Even with the improvement of results, the state of Mato Grosso do Sul couldn’t ensure the permanence of students in elementary education.
Historical barriers that complicate the basic education universalization process: - the guarantee of conclusion at proper age; - the discontinuity of policies seen in governmental terms; political priorities for education being standardized; - the contradiction between the right to education and lawlessness, which is still present in Brazilian State; - the few members of society that participate in political decisions; - overcoming educational inequalities; lack of actions that will implement this planning.
From 2015 to 2017, although the government developed actions with the goal to improve learning quality and to reduce evasion, failure and dropouts rates, there was no commitment by the state for the enforcement of PEE/MS (2014-2024), once there was no reference to the plan in none of the developed actions, even though these had contributed to the permanence and conclusion of the elementary education at proper age until its second year of application.
Although data shows a slight reduction when it comes to age/grade (access, permanence, failure and dropout), which contributed to the permanence, it also shows hardships for the enforcement of Target 2 and strategy 2.4, once the universalization of education is ensured by legal documents. However, its execution is happening slowly, since the state of Mato Grosso do Sul, as many others, is still reaffirming the idea of productivity and rationality inside the educational area, which searches to achieve maximum results with the minimum of resources. Therefore, the concept of right to education for all, instituted by the Federal Constitution of 1988 (Brasil, 1988) is related to performance rates, to fulfill infrastructure conditions and external evaluations. However, while the right is not enforced universally: access and school permanence, expansion of education for all, including for those who didn’t have access to it at proper age, or for those who didn’t finish their studies.
Therefore, the universalization is related to social justice, with the implementation of all rights, including the right to education. For that, strategies have to be planned for the construction of pedagogical processes, besides financing that will ensure the access and permanence in schools.
Referências
Bordignon, G., Queiroz, A., & Gomes, L. (2011). O planejamento educacional no Brasil. In Fórum Nacional de Educação (p. 1-67). Recuperado de http://fne.mec.gov.br/images/pdf/planejamento_educacional_brasil.pdf [ Links ]
Brasil (2014a). Lei n. 13.005, de 25 de junho de 2014. Plano Nacional de Educação 2014-2024. Recuperado de http://www.planalto.gov.br/ccivil_03/_ato2011-2014/2014/lei/l13005.htm [ Links ]
Brasil (2014b). Planejando a próxima década - conhecendo as 20 metas do plano nacional de educação. Brasília, DF: MEC/SASE. [ Links ]
Brasil. (1988). Constituição Federal da República Federativa do Brasil. Brasília, DF: Senado Federal. [ Links ]
Brasil. Instituto Nacional de Estudos e Pesquisas. (2015). Plano Nacional de Educação PNE 2014-2024; linha de Base. Recuperado de http://portal.inep.gov.br/informacao-da-publicacao/-/asset_publisher/6JYIsGMAMkW1/document/id/493812 [ Links ]
Mato Grosso do Sul, Secretaria de Estado de Educação de Mato Grosso do Sul. (2016). Mensagem à Assembleia Legislativa de Mato Grosso do Sul (Governo de Reinaldo Azambuja Silva). Recuperado de http://www.segov.ms.gov.br/wpcontent/uploads/2016/05/mensagem_a_assembleia_legislativa_2016.pdf [ Links ]
Mato Grosso do Sul. (2014). Lei n. 4.621, de 22 de dezembro de 2014. Plano Estadual de Educação (PEE-MS). Recuperado de http://www.sed.ms.gov.br/wp-content/uploads/sites/67/2015/05/pee-ms-2014.pdf [ Links ]
Mato Grosso do Sul. Comissão de Monitoramento e Avaliação do Plano Estadual de Educação do Mato Grosso do Sul [CMAPEE]. (2017b). 1º Relatório de monitoramento e avaliação do plano estadual de educação: sistematização das metas e estratégias. Campo Grande/MS. Recuperado de http://www.cee.ms.gov.br/wp-content/uploads/2018/08/I%C2%BA-RELAT%C3%93RIO-DE-MONITORAMENTO-E-AVALIA%C3%87%C3%83O-DO-PEE-MS-vers%C3%A3o-final-1.pdf [ Links ]
Mato Grosso do Sul. Secretaria de Educação de Mato Grosso do Sul. (2017a). Censo Escolar. Recuperado de http://www.sed.ms.gov.br/censo-escolar-6 [ Links ]
Mato Grosso do Sul. Secretaria de Estado de Educação Mato Grosso do Sul. (2017c). Mensagem à Assembleia Legislativa de Mato Grosso do Sul (Governo de Reinaldo Azambuja Silva). Recuperado de http://www.segov.ms.gov.br/wp-content/uploads/2017/03/mensagem_ALMS_digital_alta.pdf [ Links ]
Observatório do PNE [OPNE]. (2017a). Porcentagem de crianças de 6 a 14 anos matriculadas no Ensino Fundamental - taxa líquida de matrícula. Recuperado de http://www.observatoriodopne. org.br/metas-pne/2-ensinofundamental/ dossie-localidades [ Links ]
Observatório do PNE [OPNE]. (2017b). Porcentagem de jovens de 16 anos que concluíram o Ensino Fundamental. Recuperado de http://www.observatoriodopne.org.br/metas-pne/2-ensino-fundamental/dossie-localidades [ Links ]
Oliveira, R. P. d. (1999). O direito à educação na Constituição Federal de 1988 e seu restabelecimento pelo sistema de Justiça. Revista Brasileira de Educação, 1(11), 61-74. [ Links ]
QEdu. (2017a). Taxas de rendimento. Recuperado de http://www.qedu.org.br/estado/112-mato-grosso-do-sul/taxas-rendimento [ Links ]
QEdu. (2017b). Distorção idade-série. Recuperado de http://www.qedu.org.br/estado/112-mato-grosso-do-sul/distorcao-idadeserie?dependence=2&localization=1&stageId=initial_years&year=2014 [ Links ]
Received: October 08, 2018; Accepted: October 30, 2019
 Este é um artigo publicado em acesso aberto sob uma licença Creative Commons
