


 Inglês (pdf)
 Artigo em XML
 Enviar este artigo por email
 Permalink
Introduction
In the last decade, the advancement of digital technologies and their popularisation has contributed to a greater diversity of Data Visualization (DV) representations (table, map, infographic, among others) available (Nascimento & Ferreira, 2011). This article describes how these new representations, highlighted with digital technologies, are available supporting data analysis in Qualitative Data Analysis Software (QDAS). This experiment was possible to be made from the list of software used worldwide in an interdisciplinary way, available on Pat Research's website1.
According to our inclusion/exclusion criteria described in our methodological procedures, this research resulted in a descriptive analysis of how DV representations contribute to support the analysis of qualitative data in 7 of the 14 listed QDAS. In the software in which it was possible to identify this existence, we seek to analyse to describe: a) The most frequent representations of DV in QDAS; b) Structuring DV representations in QDAS; c) Representation of DV in the data organisation phase in QDAS; d) DV representations in the QDAS analysis phase.
We allow ourselves to understand from the perspective of researchers who work with the analysis of qualitative data. The importance of being clear about the DV processes may involve analysing qualitative data in diverse areas of knowledge and using digital technologies and their innovative potential, favouring this type of analysis.
This research has a theme, the Data Visualization (DV) representations and the use of Qualitative Data Analysis Software (QDAS). Based on the use of DV and the QDAS in digital environments, the question arises: to what extent do digital spaces' potentialities contribute to the representation of Data Visualization (DV) to be determinant in the analysis of qualitative data?
This research's objective was to describe how DV is represented in the analysis of qualitative data with the support of QDAS. To achieve this goal, we methodologically opted for a descriptive type of research when accessing the most used QDAS of the present and describing, based on our experience of use, their possible relationships with the representations of DV offered to users organisation and analysis of qualitative data. Next, in section ii), we will present the relationship between qualitative data analysis using software and the visual representations of data, followed by iii) the present work methodology, iv) The presence of Data Visualization in QDAS) conclusions.
Qualitative Data Analysis Software and data visualization representations
The software to support qualitative data analysis, QDAS, is used in a variety of research fields. Regardless area, the decision to use this type of platform to support data analysis “[…] is influenced by the type and approach of the research and also by the techniques selected by the researcher as the most suitable for analysis” (Lage, 2011, p. 47, authors' translation)2.
Among the utilities that make researchers choose to use QDAS, software of this type seeks to offer a platform that makes it possible to consider the ability to organise large and small amounts of data. A possible reduction in the time spent for analysis, coding/classification /description of sources and the availability of DV representations for use.
It is essential to consider that QDAS-type software is not intended to replace the researcher's role and work when analysing qualitative data. This platform option seeks exclusively to support the researcher to provide ways in which digital technology can collaborate with the quality of research analysis with a qualitative approach today.
We could not fail to consider that on this QDAS theme, some authors call attention to the harm that can cause improper use. Costa and Reis (2017, p. 10), when quoting Lage and Godoy (2008), for example, alert to cases in which the researcher must be aware when using these platforms in his research (Costa and Reis, 2017, p. 10): i) Coding - Possibility of losing control in the coding process, ii) Methodology - Confuse software with methodology, iii) Coding - Encouragement of complex and detailed coding structures resulting in over coding, iv) Sources - Unnecessary increase in the amount of data collected, leading to the risk of compromising in-depth analysis, v) Systems - Impossibility of communication between systems (software packages), vi) Methodology - Lead researchers to use a particular method of analysis according to the tool's characteristics.
Still, regarding the alerts for the use of QDAS, it is essential to consider that there must be criteria when choosing specific software to support data analysis in research. The software fits the research, not the research that needs to fit the software. For this, based on Costa and Reis (2017, p. 10), it is necessary to pay attention to: i) Adequacy to the type of investigation; ii) Adequacy to the research design; iii) Functionalities; iv) Usability of the software; v) Availability of software at the institution.
In addition to the criteria set out above, in this article, we understand that DV can and should also be considered an essential criterion for selecting a specific QDAS in scientific research. It has been usual to use a diversity of visual representations to communicate data in our social life. The QDAS is no different, as we will see in the analysis section of this research. That is why it is necessary to consider and make an effort to understand how the DV is offered in QDAS as an essential criterion when visualising data during qualitative analysis.
The DV, when offered in QDAS, can enable the user to see their data through different representations such as, for example, charts, tables, maps. Regarding these visual representations, Pereira (2015, p. 46-65, authors' translation) considers that the charts can be helpful, in general, “[…] when it is intended to analyse or communicate a message that is contained in the form of the data”3. Alternatively, also “[…] it works when it is intended to want to communicate a message that is contained in the internal relationships of a data set or between different sets”4, the tables “[…] it works when it is intended to analyse or communicate accurate and easy to reference information”5. Moreover, maps, a technique widely seen and used since childhood, “[…] works well when it is intended to communicate data with a location or spatial relationship”6.
It must be considered that the executions made in the QDAS that were part of our descriptive analysis concerning the practice tests are not made exclusively by the device. It is up to the researcher always having the primary responsibility of selecting, indicating, and conducting, among the data, the direction of the qualitative analysis, configuring a practical activity between a man and digital technology in search of a specific objective. Therefore, this may be a description of the experience, among others, that can be made and directed to other visions, analyses and discoveries.
DV has, in recent years, been considered an area of study that seeks to enable researchers from diverse areas of scientific knowledge. These possible options contribute to the reading and interpretation of data through the use of digital technologies7.
When stating that the DV is “[…] a means for the visual or interactive exploration of data, of any dimension and your corresponding graphic representation” Pereira (2015, p. 36, authors' translation)8 defends that the DV is ‘a means’ to visualise data. While the author's Card, Mackinlay and Shneiderman (1999, s/p) e Cairo (2008), adopt the term Information Visualization (IV), conceptualising it as “[…] the use of visual representations of abstract data computer-supported and interactive to enhance cognition” (Cairo, 2008, p. 27, authors' translation)9.
In this research, we understand that both definitions (DV and IV), indistinctly, seek to conceptualise the phenomenon of visualising data or information in representations generated through digital technology. Promote a better organisation, understanding, memorisation, and production of new knowledge. We chose to use the term DV. We will try to reflect on this understanding's applicability from the present time perspective and our practical experience in QDAS because we know that the concepts may change over the years, social or cultural phenomena.
In doing this exercise, we consider that in the last two decades, with the advent of attitudes, ways of thinking and values, increasingly related to the practices of the digital environment. Some authors understand it as a characteristic present in cyberculture (Lévy, 1999; Lemos, 2010; 2011; Santaella, 2003). Alternatively, even factors of a society that tries to define itself as postmodern (Bauman, 2000; Giddens, 1991) or hypermodern (Lipovetsky, 2004; 2016).
In this context, the search for digital technological tools, such as QDAS, aims to contribute to research-based support for qualitative data analysis. Has increased in scientific research in Brazil (Andrade, Linhares, Costa, & Almeida, 2019). These tools, the number of options and the expansion of available functionalities grow better to meet the data analysis needs of users/researchers. One of these options can be seen in the DV itself.
In this digital space, emerge possibilities offered by the QDAS for the practice of potentialities exclusive to this digital reality, which is crucial for analysing qualitative data. One of these potentialities is to perceive the DV as an essential means for exploring and interacting with the data available for analysis.
Methodology
As procedures, we use bibliographic research on the theme to describe the possible relations between the DV and the QDAS during qualitative data analysis. In a second phase, as an experimental procedure, a survey of the best QDAS available to users/researchers in the international market was carried out based on the Pat Research10 website, which listed the most popular QDAS among users until the period of our analysis11.
The available QDAS that met the Pat Research portal's criteria were listed in a ‘Top Qualitative Data Analysis Software’, totalling 14 software: NVivo, ATLAS.ti, Provalis Research Text Analytics Software, Quirkos, MAXQDA, Dedoose, Raven's Eye, Qiqqa, webQDA, HyperRESEARCH, Transana, F4analyse, Annotations, and Datagram.
To experiment with this research of the listed software, it was necessary to establish inclusion/exclusion criteria: i) be listed in Pat Research, ii) be viable to access, iii) have a free trial version, and iv) have the presence of representations of DV. After the defined criteria, we followed this stage of data collection in (Figure 1):
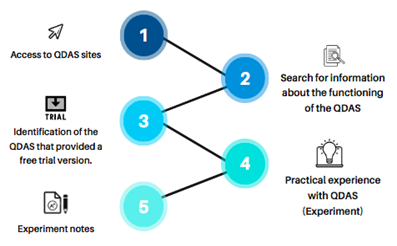
The data construction path (Figure 1) on DV in QDAS initially sought to visit each software's websites, seeking to better understand their particularities of operation. Subsequently, deepen a practical experience with all the QDAS mentioned bellow. These done through the free software versions to testing. All the highlighted software selected for this analysis are commercial solutions.
The inclusion/exclusion criteria also pointed out the software that was impossible to go through our experiments, but that were nevertheless mentioned in Pat Research's list. Of the total of 14 QDAS listed, seven (7) were not possible to carry out analyses in this research (view Table 1).
Table 1 List of QDAS featured on the Pat Research portal.
| QDAS | Reason for exclusion from analysis |
| Provalis Research Text Analytics Software | No free trial available |
| Raven’s Eye | No free trial available |
| F4analyse | It was not possible to fully explore the platform, especially in the data analysis stages. |
| Annotations | We did not identify DV representations. |
| Datagram | Is software aimed at a multidisciplinary audience and restricted only to professionals in the field of oil, energy, and public administration. |
| Qiqqa | We did not identify DV representations. |
| Transana | We did not identify DV representations. |
Source: Prepared by the authors in 2020.
The other seven (7) QDAS that we can access following our inclusion/exclusion criteria are divided into two forms of access:
Table 2 Software analysed and the type of access.
| QDAS | Type of access |
| NVivo | Installing software package |
| ATLAS.ti | Installing software package |
| Quirkos | Installing software package and accessing platform in the Internet browser |
| MAXQDA | Installing software package |
| Dedoose | Accessing platform in the Internet browser |
| webQDA | Accessing platform in the Internet browser |
| HyperRESEARCH | Installing software package |
Source: Prepared by the authors in 2020.
In both types of access to QDAS (view Table 2), it was necessary to access their electronic addresses and register with personal information (name, date of birth, sex, e-mail, password). This procedure was necessary to grant access to the free trial version.
The seven trial versions made available the software for a limited number of days for free use. Of those analysed, we found variables of 14 days, as was the case with three software (NVivo, MAXQDA, and Quirko), 15 days (webQDA), and 30 days (Dedoose). However, this is not a rule. There was software that limited the functions and allowed, until the date of this research, that the trial version is used for unlimited days, which happened in two of the analysed software (HyperRESEARCH and ATLAS.ti).
We created a data collection table to organise the results, where notes were made throughout using the QDAS in practice. This table had the following topics: i) Name of the software; ii) Forms of visual representations available; iii) Data organisation options; iv) Interactions; v) Access date; iv) Form of access; v) Website link related to the software.
The objective of the first item served to identify which QDAS were analysed. In the second, we list the types of DV available in each software. In the third one, we highlight how the data were organised on the platform. Fourth, we evaluated the interactions of existing representations. The evaluation was made with scores from 1 to 5, considered 1 for few representations interactions and 5 for much interaction. The fifth item had the function of recording the date on which the software was accessed and analysed. In the sixth, the type of access that the software offered on the date of this experiment was pointed, which may be the installed software package and software accessed by the browser; in the last item, access links to the websites of each QDAS were registered.
Below we present the results and analyses of the QDAS that were part of this research. In this research, we care about making an effort to make it clear to the reader how DV representations can collaborate in the QDAS to support qualitative data analysis. The user can use a VD available in QDAS in his research and better communicate the data using visuals, such as graphs, maps, and diagrams. This whole exercise aims to make scientific communication - mainly qualitative - more transparent and more objective in conveying to the readers.
The presence of Data Visualization in QDAS
Through the organisation of data from the practical experience of accessing QDAS and identifying possible representations of DV, we can highlight, below, if the presence of DV occurs in qualitative data analysis software, how it occurs, and what is its effective contribution on platforms of this type for users/researchers.
a) The representations of DV present in the QDAS
From a researcher perspective that sought to explore in its versions of tests the DV and its possible contributions, we found that the QDAS that can be identified and accessed in this research present a set of DV representations. In their structures that varied between table, Concept/mind maps, Representations with movements and Charts.
Regarding item “i”, both in the natural and virtual fields, it has the same purpose of being a matrix representation12. They are composed essentially of numbers. Tables are also intended to present, in the QDAS, a set of data in text format organised and distributed in columns and rows. In Figure 2, we highlight an example of a representation of a table existing in QDAS.
Source: Retrieved on March 13, 2020 from https://atlasti.com/wp-content/uploads/2019/03/fig1-1024x560.png
Figure 2 Example of a table in QDAS
The “ii” type representations used in QDAS come from the family of diagrams, consolidated as representations used to manage data, information and knowledge in practical/virtual situations. In the virtual realm, they are presented to the reader as an option for their qualitative data's mental visualisation. It is a general representation of all the data or specific analysis points with the chosen software. In Figure 3, we highlight an example of representation of conceptual/mental maps existing in QDAS.
Source: Retrieved on March 13, 2020 from https://www.maxqda.com/wp/wp-content/uploads/sites/2/MAXMaps-mq2018-qda-blog.png
Figure 3 Example of concept/mind map in QDAS
In the context of QDAS currently available, it is established that the item “iii”. Have gained ground among the options to view data on these platforms, with the primary objective to establish more excellent interactivity movements and clicks to the users/researchers than already existed (maps, charts, diagrams, among others) and were without movements. In Figure 4, we highlight an example of representation with movements existing in QDAS.
Lastly, the “iv” type representations also appear in QDAS, as a set of representations of graphs of different formats (bars, lines, diagrams, among others). In Figure 5, we highlight an example of representations of the type Charts existing in QDAS.
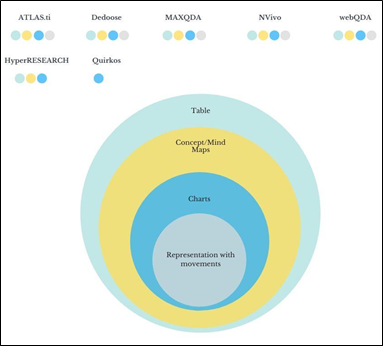
It is also possible to observe where certain representations are present from experimentation in the analysed QDAS, as shown in Figure 6.
We can point out that from the QDAS that were part of this study. As Figure 6 represents, 5 (five) of them (ATLAS.ti, Dedoose, MAXQDA, NVivo, and webQDA), of the total of 7 (seven), offered all representations of Data Visualization (DV) described earlier. Noting most of these representations have been seen as something that needs to be available to the user/researcher in most of this software. In this context, we ask: Are the representations structured similarly in all 7 QDAS surveyed?
b) Structure of DV representations in QDAS
It is not the same similarity to state that all 7 (seven) structure their representations in the same way. The difference is possible to see in the format that the platform is made available for user access. According to Souza et al. (2019), the webQDA13 and Dedoose14 are active QDAS through cloud computing, technology that, according to the Eco it Digital15 Security Portal allows the distribution of computing services and online access without the need to install/download programs or applications. How is the case of the other five listed QDAS (ATLAS.ti16, MAXQDA17, NVivo18, HyperRESEARCH19). Of this analysed software, only Quirkos20 Provides the option of access through cloud computing technology or an application installed on the computer.
The differences of QDAS in providing the exact representation of DV also extend in their execution and presentation forms (Table 3).
Table 3 Execution and presentation of DV representations in QDAS.
| Execution of DV representations | Presentation of DV representations | ||
| Automatic | Manual | All representations in a given space on the control panel | Representations are distributed throughout the control panel |
| 2 QDAS | 7 QDAS | 2 QDAS | 7 QDAS |
Source: Prepared by the authors in 2020.
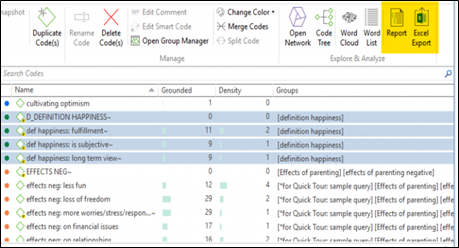
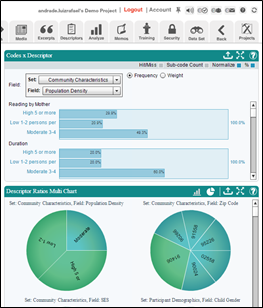
The first difference analysed from the QDAS in question was the way that these software offer representations. During the research, some provided representations that are executed automatically and others that need manual commands to be executed with the platform's data (view Table 2). Another difference is that two software (NVivo and Dedoose) allow all representation options to be accessed in a single space21 (view Figure 7):
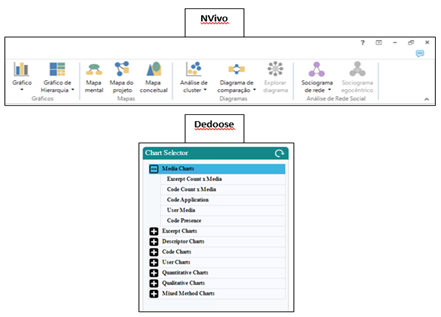
Source: Prepared by the authors in 2020
Figure 7 All representations in a given space on the control panel
In the other five QDAS analysed in this research, the representations were distributed throughout the software layout at specific times (coding and analysis), not having a single space in which all could be viewed or chosen by the user22.
c) DV representation in the data organisation phase in QDAS
This research highlights the practical experiments in QDAS, software that we had easy access to automatically generated representations from the inserted data. When a source was added to the software, we could view the data in the form of representations: Ex: word cloud with the source's most frequent words. The visualisation of the data inserted in the initial phases of the research performed in QDAS is essential because it collaborates so that the user/research can better see how their data is structured to, finally, analyse it.
The DV representations in this phase of organising data (sources) in QDAS, when available, have the objective of visually clarifying for the user/researcher the design of how their analyses will be. It is fundamentally an elementary differential for how the researcher will look at his qualitative data and start the next phase, which is the analysis.
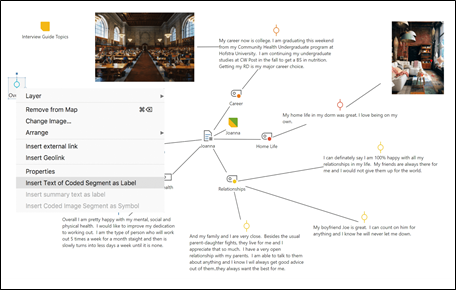
In QDAS that participated in this research, we also could test the resources of the coding/categorisation that was accessible and executed, in a similar way between the software, from a document (source) selected for analysis. With the codes created, we had the chance to explore other types of DV, such as tables and maps; important to better visualise how the codes/categories were organised from the data (source) inserted. Given the number of representations that varied between the types i) Charts, ii) Tables, and iii) Maps, we chose to highlight, in Figure 8, examples of how representations can collaborate in the visualisation of the created (1) and filled categories (2) in QDAS.
In the representation of the Conceptual Map type (view Figure 8), the categories (macro) and subcategories (micro) are organised in an order that starts from the total, macro, for the specific, micro. In representation 2 of Figure 8, it is possible to visualise an essential functionality of crossing codes/categories with data (sources). In this context, of the 7 (seven) QDAS analysed, in 5 (five) of them, it was possible to identify DV representations in the data organisation phase.
d) DV representations in the QDAS analysis phase
Although we observe that the representations of DV appear in phases that precede the analysis, we observe that the QDAS concentrates on providing options to view the qualitative data at that moment of the research. For these options to have a particular variety, representations of types table, charts, map, and even movements are alternatives. However, as we have seen during this article's analysis, QDAS has limitations different from software to software. What would not be different in the analysis phase.
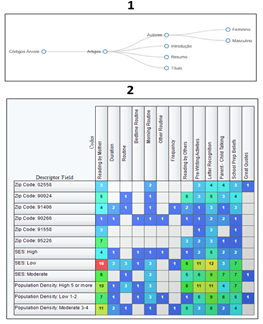
Source: Authors registration in 2020
Figure 8 Examples of representations in generated codes/categories
It was possible to highlight, based on the use of the selected QDAS for this research, that the representations of DV during the data analysis phase, in particular, call attention to some characteristics: i) Customisation - Customising Data Visualization Representations, ii) Download - Possibility to download generated representations, iii) Variety of Representations - Variety of representations to view the same or other data, iv) Interaction and Movement - Interactive representations and representations with movements.
The first of these observed DV characteristics is the option that the user/researcher has, if he prefers, to personalise the representations generated in his analyses during the use of QDAS. We highlight in Figure 9 an example of what is closest to this type of functionality.
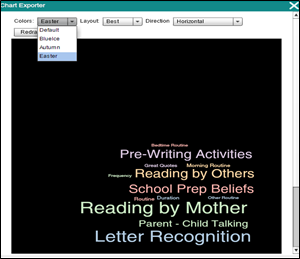
In this experiment (view Figure 9), we had access to the customization of i) set of colors, ii) type of layout, and iii) direction. Personalization is a tool considered vital if we think it can ratify the idea that in software that seeks to support qualitative research, who will configure the final result is the researcher. It is worth considering that the personalization of the user/researcher is not something available in all the offered representations. There are still few representations with this type of functionality and few options available to customize.
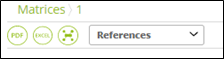
Download availability is another tool available to users/researchers of the analysed QDAS. We highlight in Figure 10 an example of what comes closest to this type of functionality:
Source: Authors registration in 2020
Figure 10. Exemple of Possibility to download generated representations
It is crucial that the option to download representations generated in QDAS be made available, as they can be used in presentations and scientific articles. There have been situations in which DV representations are transferred in a specific format for other platforms. As the formats: jpg, jpeg, pdf and xlsx.
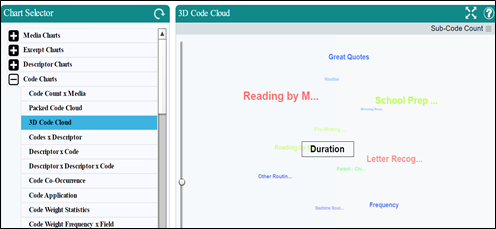
The variety of representations available was also something that attracted attention when using the QDAS:
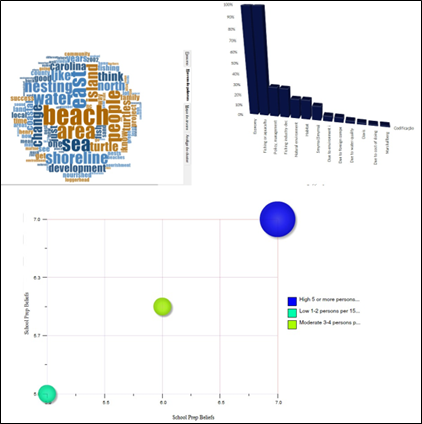
Source: Authors registration in 2020
Figure 11 Exemple of Possibility to representations of DV in QDAS
We noticed the highest DV representations available for use (view Figure 11). This more significant occurrence is also followed by a considerable variety of representations that can collaborate with the visualisation of data in QDAS when crossing categories, conducting text or code searches and word frequency. It is common for each of these moments to highlight in QDAS more than one available representation alternative.
This variation on the same analysis command is essential for the user/researcher to have different views on their software data. Since, as long as it is well used and adequate to the analysed data, the representations of DV can represent the data so that the visualisation of these generates human perception capacities, to generate interpretations, understandings of presented data and, finally, production of new knowledge (Freitas, Chubachi, Luzzardi, & Cava, 2001).
In addition to generating in human perception a better understanding of the data presented, QDAS DV representations can involve transforming qualitative data into ‘mental images’, or even authentic when viewed by humans. With a goal of, in some cases, also help in the discovery of new knowledge, being the ultimate goal of using the support of digital tools to communicate better/present a specific scientific subject, which, without a visualisation strategy, would require a more significant effort of understanding (Nascimento & Ferreira, 2011).
To continuously improve the process exposed above representations have been looking for more interactive DV strategies through the QDAS (view Figure 12) and, in some cases, with 3D movements, as we have already shown in Figure 4.
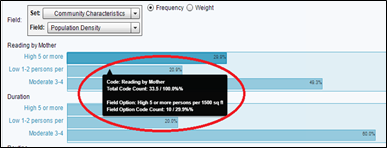
As Figure 12 exemplifies, it is possible to notice that the interaction in the representations in QDAS during the data analysis phase acts to detail the data presented there. When hovering the mouse cursor over specific representation data, new detailed data about what is presented appears. In some cases, when the mouse is clicked on the same area, the user is directed to a new tab containing the data source.
These interactions are intended to complement/detail the data represented there, create links with the sources, and collaborate with the user/researcher to discover new interpretations and knowledge. This interactive phenomenon is something that, according to Card et al. (1999), stands out from other representations for the reason of making use of the digital technological support ‘computer’. Nascimento and Ferreira (2011) will divide the emergence of interactions into representations of DV at a pre-computational moment, a stage in which representations were almost always “[…] static, without interactivity” (Nascimento and Ferreira, 2011, p. 17, authors' translation23). A second computational moment, there are possibilities for DV representations to improve interactivity with its producers and readers.
Conclusion
We consider that the opportunity to describe how DV is represented in the analysis of qualitative data with the QDAS support allows us to point out the software participating in the analysis, identifying a small quantity (seven) adequate to the established exclusion/inclusion criteria. To allow us free access to knowledge of the platform and a commitment to invest in DV as fundamental support in supporting qualitative data analysis.
Within the universe of QDAS analysed (ATLAS.ti, Dedoose, MAXQDA, NVivo, webQDA, HyperRESEARCH, and Quirkos), we describe, based on our practical experience on their platforms, that they have different types of DV representations available to the user who seeks to analyse their qualitative data. It is worth considering that the QDAS have started to insert these representations in the final analysis process and organise the data. In this way, we understand that the researcher sees his qualitative data under different representations in stages that precede the final moment of analysis. It helps the construction of knowledge be transparent and explores different perspectives when treating his data.
In addition to being available in more than one stage of qualitative research, we identified that DV representations in QDAS have sought to improve in interacting with the user. This measure is still restricted only to the provision of complementary information. It was also possible to identify that the DV, when seen in QDAS as an element that seeks to contribute to the analysis and circulation of scientific knowledge, has particular characteristics in the sense of i) customising data visualisation representations, ii) possibility of generating representations download, iii) variety of representations to visualise data, and iv) interactive and moving representations.
The characteristics of DV identified in QDAS from this research allow understanding this concept to visualise qualitative data through representations generated in various stages of the research with the support of software, which seeks to offer the researcher alternatives to present and insert data in the circulation of knowledge.
This experience of analysing DV in QDAS allows us to understand that digital technologies are fundamental to the daily production and dissemination of scientific knowledge by enabling the researcher to have access to artefacts that support him in his work of treatment, data visualisation, and analysis.
At the same time, we affirm that the QDAS still have challenges for their available DV representations. We believe that they can better contemplate the research phases on their platforms, be more interactive in features, and provide detailed information, enabling a better user performance in changing their styles and colours. Seeks to be a feature of easy, intuitive access throughout the user experience, contributing increasingly so that the researcher has this possibility of support arising from digital technologies in the discovery, construction, and circulation of new knowledge.

