


 text in
  English (pdf)
 Article in xml format
 Send this article by e-mail
 Permalink
INTRODUCTION
The study focuses on understanding what factors may influence students’ participation in teacher evaluation processes. We considered the characteristics of both individuals and their higher education programs. In the case studied, all students are invited to participate, which means that the evaluation is intended to be a census rather than a sample-based study. However, not all students participate, which potentially biases the results. Therefore, it is important to get further insights into the profiles of respondents. Also, based on these results, strategies can be developed to increase student participation.
Internationally, the field of studies in which investigations about student evaluation of teachers are conducted is known as student evaluation of teaching (SET). In this field, several scientific contributions seek to understand what determines the evaluation of teachers, i.e., what factors can explain the grade given by students. The studies consider the characteristics of teachers, programs, courses and the students who evaluate; the findings are diverse (McPHERSON; JEWELL; KIM, 2009; ANDRADE; ROCHA, 2012; JOYE; WILSON, 2015; CHOI; KIM, 2014; DURAKU, 2014; FAH; OSMAN, 2011; GRUBER et al., 2012; SPOOREN et al., 2017).
Most of these studies, however, face problems regarding the lack of diversity and heterogeneity of data, since the majority refers to small groups of students in specific programs for particular periods, which makes it impossible to perform time-series analyses (McPHERSON, 2006). The evaluation processes explored by SET studies usually take place in the classroom, through physical questionnaires about a particular teacher, based on a sample of previously selected students. Thus, the focus is usually on understanding the scores given by the selected students, since they represent the total population of students - in other words, it is assumed that the selected samples are not markedly biased.
The case we analyze has a different scenario: the questionnaires are administered online to all undergraduate students enrolled in the institution (population) with a 30-day deadline for completion. In this context, the goal of the study is to analyze the context that precedes the explanation of grades given to teachers by students, since it focuses on understanding what leads students to participate in teacher evaluation processes. In other words, the question that guides our study is: what characteristics of both students and their program are associated with student participation in teacher evaluation in higher education? Although we seek a general answer that may even help increase participation rates in evaluations conducted in higher education institutions, we are aware that the analyzed case has specific characteristics.
We start from an exploratory data analysis referring to the last semester of a cycle of six semesters of teaching evaluation. The participants were students enrolled in 163 undergraduate in-person programs in different knowledge areas at a private higher education institution. In addition to the studies that make up the SET field, this investigation is also based on the literature about survey methodologies and how the results are influenced by the quantity and quality of collected responses.
One of the main disadvantages and difficulties pointed out by the literature for online surveys is the difficulty ensuring the participation of respondents (WACHELKE et al., 2014; ANDERSON; CAIN; BIRD, 2005; FAN; YAN, 2010). Just as it is impossible to ensure participation, so too is it impossible to control the results for any selection bias. In other words, the survey method does not allow controlling for the possibility that individuals of a certain profile have a higher or lower participation rate, which may influence the results.
Therefore, it is necessary to consider strategies to increase response rates in online surveys in order to minimize biases. To that end, first, it is necessary to know the profile of respondents and, mainly, what factors can determine their participation (or lack thereof) in online surveys. In the case studied, the central hypothesis is that the characteristics students and programs may influence students’ probability of participating or not in teacher evaluation. The discussion on participation is essential to seek elements to motivate students to participate in the evaluations conducted at universities, as well as to understand the results themselves while considering the analysis of any selectivity effects among respondents. Therefore, the importance of this study is both methodological and analytical.
The analysis considered both descriptive and inferential statistics and used multilevel logistic regression in order to consider the two analysis levels (individual and program). The main results indicate that individual and program characteristics influence students’ probability to participate in teaching evaluation, with female students over 41 years of age and served by government funding programs or scholarships being more likely to participate. In addition, students enrolled in the early stages of programs, and students who dedicated a total of 26 to 30 class hours per week are also more likely to participate in the evaluation. Finally, being enrolled in full-time teacher licensure programs or programs with a lower average student age seems to increase the students’ probability to participate in the teacher evaluation.
This article has four sections besides this introduction and the final considerations. Firstly, we present the case studied by describing the teaching evaluation process as it is carried out in the institution. Then, we discuss the theoretical approaches on which the research question and the proposed analysis are based. In the third section, we present the data and methods used and, finally, in the last section, the results of our analyses.
TEACHER EVALUATION IN HIGHER EDUCATION: OUR CASE STUDY
The evaluation of teaching at this institution stems from the need to establish an instrument that provides foundations for evaluating how teachers perform their duties. It is regulated by the Guidelines on Teacher Career in order to help with teachers’ self-reflection and promote improvements in their teaching skills. In addition, teacher evaluation formalizes the perception of undergraduate students and teachers about the teaching conducted in the current semester. Finally, it is worth emphasizing that teacher evaluation provides foundations for human resources policies, program diagnoses, and teacher development.
The Internal Evaluation Committee (CPA) is the sector responsible for evaluating teaching in undergraduate classes (in-person and online), as well as other activities conducted by teachers such as program coordination and the participation in committees.1 With regard to undergraduate classes, teachers are evaluated in terms of their teaching in courses (in-person or distance learning) in the different undergraduate programs, at the institution’s different campuses/units.
The process consists of the following steps: (1) defining the criteria, instruments and research methodology;2 (2) developing instruments in the institution’s system for data collection; and (3) disclosing results to the evaluated persons and the university’s decision-making bodies (directors, department heads and program coordinators). Because it is carried out periodically, it constitutes a permanent evaluation process regarding undergraduate classes and the work of faculty bodies, as part of the program’s coordination group.
Data collection is semiannual and refers to the current semester to ensure that the students’ experience with the teacher is recent in their memory. It is intentionally census-based and takes place through questionnaires registered in the institution’s system which become available electronically for the participation of students and teachers. The questionnaires should be completed by all teachers (who carry out their self-assessment), by students (concerning the teacher’s performance for each ongoing course in the semester) and by the program’s faculty body (for each program the teacher teaches in), with regard to his/her teaching.
The questionnaires can be accessed over a web interface through user login and password, during approximately 30 days in the academic semester, beginning about 40 days before the end of the semester in order to prevent any influences of students’ final grades on the evaluation. As a way of mobilizing people to participate and therefore maximize the response rate, the evaluation process is promoted through posters at the entrance to campuses, informational emails, and messages displayed in other media internal to the institution. The evaluation data we will analyze in this study refers only to the participation of students in the evaluation of teachers’ teaching in undergraduate in-person classes.
REFLECTIONS ABOUT EVALUATION WITH STUDENTS’ PARTICIPATION
Studies on student evaluation of teaching have been an ongoing debate since the 1970s, mainly in the United States. These studies tend to focus, for the most part, on the factors determining the grades that teachers receive from their students. The studies observe (i) characteristics related to the classes to whom the courses are taught, such as number of students enrolled, school shift, number of classes per week, course level (basic, intermediate and advanced); (ii) characteristics of the students engaged in the evaluation, such as sex, race, age, program’s knowledge area; and (iii) characteristics of the teachers being evaluated, such as sex, race, age, time of experience as a teacher, education, didactic qualification, class hours dedicated to the institution (McPHERSON; JEWELL; KIM, 2009; ANDRADE; ROCHA, 2012; JOYE; WILSON, 2015; CHOI; KIM, 2014; DURAKU, 2014; FAH; OSMAN, 2011; GRUBER et al., 2012; SPOOREN et al., 2017).
It is also essential to consider the studies on questionnaire administration methods and techniques, especially online surveys. This is a widely developed area, whose topics range from the cognitive aspects associated with the construction of questionnaires (BOWLING, 2005) to tools for improving the implementation of this type of data collection (CARNEIRO; DIB, 2011; WACHELKE et al., 2014). One of the factors extensively discussed in the literature is the problem found in online surveys in general: respondents’ low participation rate.
Several authors point out that implementing surveys through online platforms has both positive and negative practical implications. Among the advantages, it is worth mentioning the significant reduction in administration costs for large samples and the possibility of reaching very specific groups, in addition to automated routines for tabulation and analysis of collected data. The main disadvantage of this type of survey, on the other hand, is that it is difficult to ensure respondents’ participation. Studies show that surveys based on online recruitment tend to have lower participation rates than traditional, face-to-face administration methods or the recruitment via traditional mail - the latter being more common in the United States (WACHELKE et al., 2014; ANDERSON; CAIN; BIRD, 2005; FAN; YAN, 2010).
Given this diagnosis, several efforts have been made to find alternatives to increase the participation of respondents in online surveys. The reason is that the advantages of administering this type of collection can bring many benefits to research in general, in addition to representing the evolution expected from the digitization of research methods and processes. In other words, the low response rate in online surveys is a problem that must be solved or minimized. Among the efforts found in the literature, most are related to the data collection process, i.e., the low response rate is attributed to respondents’ difficulty accessing questionnaires.
Here, it is worth noting, however, that there is an important difference between the surveys carried out as described by these authors and the teacher evaluation analyzed in this article. First, the platform that hosts the survey is an institutional system to which all students have access to carry out other activities and find academic information. Therefore, it is an online system in which students have easy access to the questionnaires. In addition, the recruitment procedures carried out by the institution are not exclusively online-based, as said earlier.
Moss and Hendry (2002) argue that, in order for online course evaluation surveys to be successfully used, questionnaires should not be administered frequently; they should be short, have a simple design, and should not require a password, in addition to ensuring the anonymity of responses. Moreover, the authors highlight the importance of offering incentives for participation, such as a return about the survey’s results. The authors conclude that besides greater efficiency in terms of lower administration costs, online surveys can be administered more quickly and allow a more agile calculation and distribution of results. Therefore, when correctly used both in methodological and operational terms, this technology increases teachers’ capacity to provide feedback to students and implement real improvements in programs based on the inputs they get from the surveys.
In turn, Bowling (2005) points out that the main reasons for non-participation include the respondent’s unwillingness to participate in the survey, the researcher’s lack of ability, or means to contact the respondents (monitoring activity), or some communication barrier. Thus, for the author, non-participation and, consequently, the low response rate are influenced by the way the questionnaire is administered. However, we argue here that participation can be influenced but not determined by these factors, since respondents’ motivation to participate or not in the survey depends on factors beyond the way the questionnaire is administered.
With this respect, Wachelke et al. (2014) propose implementing a respondent recruitment and monitoring system they call Online Collection with Face-to-Face Recruitment (CORP, in Portuguese). Following this procedure, they believe it is possible to increase respondents’ participation through face-to-face participant recruitment followed by collection via an online platform, with periodic reminders and contacts with respondents; at the end, respondents should get an online return with a participation certificate or the results of the survey.
Concerning student engagement, Nair, Adams and Mertova (2008) consider that the low level of student involvement in surveys evaluating the quality of higher education is due to the lack of incentives for participation. According to these authors, solutions must include creating a communication channel with students in order to highlight the importance and relevance of teacher evaluation for the institution and, consequently, for themselves. Institutional assessments are considered important to develop and improve teaching, as well as determine the management of teaching growth, among other factors.
Fan and Yan (2010) conducted a systematic review of the literature on surveys carried out on the internet and showed that the average response rate to this type of research is less than 11%. This means that for every 100 potential respondents, only 11 actually participate online. In addition, the authors argue that response rates can be affected by several factors of different natures. Once again, we emphasize that the context of the survey we analyze here is different: rather than a survey with wide online recruitment, the evaluation is conducted online by specifically targeting the group of students who can access the system where they can participate in the survey. Chart 1 presents a summary of the previous factors/studies.
The literature review carried out by the authors can help us delimit our study’s research question and the central hypothesis. Before that, it is worth pointing out that, despite being systematically treated separately for analytic purposes, all the listed factors are interrelated. Concerning our research, we are interested in the factors whose nature is in the decision to participate in the survey, specifically regarding respondents’ characteristics.
CHART 1 Summary of factors that affect response rate in online surveys
| NATURE | FACTORS |
|---|---|
| Development | Questionnaire content |
| Questionnaire presentation | |
| Administration | Sampling method |
| Ways of contacting and delivering questionnaires to respondents | |
| Survey invitation format | |
| Use of previous notices and reminders | |
| Participation incentive system | |
| Decision to participate | Social desirability3 |
| Respondents’ characteristics | |
| Data collection | Software used |
| Data security |
Source: Adapted from Fan and Yan (2010).
It is noteworthy that respondents’ characteristics have been treated in the literature through different approaches: (i) by comparing response rates for a single survey across different populations; (ii) by studying how sociodemographic characteristics may affect response rates; and (iii) by measuring when and how personality traits may affect the decision to participate (FAN; YAN, 2010). In the present study, we focus on understanding the individual characteristics of students and the programs’ characteristics that may influence students’ probability of participating in teacher evaluation. Thus, the central hypothesis is that both individual (e.g., gender and age) and collective (e.g., program type) characteristics affect students’ probability of participating in teacher evaluation.
DATA AND METHODS
The following analyzes use data from the teacher evaluation questionnaires administered by the Internal Evaluation Committee (CPA) to students in undergraduate in-person programs, as well as information on the same students from the university’s academic information system. These data allowed identifying a set of variables, as shown in Chart 2, which correspond to two measurement levels: the characteristics of students and the characteristics of the programs they were enrolled in.4
CHART 2 Variables and measurement
| VARIABLE | DESCRIPTION | MEASUREMENT | |
|---|---|---|---|
| Response | Participation | Indicates whether the student participated in the evaluation or not | Non-participant = 0 Participant = 1 |
| Explanatory: Level 1 - Student | Sex | Indicates student sex, whether female or male | Female = 0 Male = 1 |
| Age group | Classifies student age according to established age groups | 16 to 18 years = 1 19 to 22 years = 2 23 to 25 years = 3 26 to 30 years = 4 31 to 40 years = 5 Over 40 years = 6 |
|
| Prouni or Fies | Indicates whether the student is served by a government scholarship or funding program at the time of enrollment | No = 0 Yes = 1 |
|
| Hours dedicated per week | Indicates the number of hours the student dedicates to the program per week | up to 15 hours = 1 16 to 20 hours = 2 21 to 25 hours = 3 26 to 30 hours = 4 Over 30 hours = 5 |
|
| Stage in the program | Indicates how much of the program’s time-length has been completed in the semester | up to 25% = 1 26 to 50% = 2 51 to 75% = 3 76 to 100% = 4 Over 100% = 5 |
|
| Explanatory: Level 2 - Program | Type | Indicates the type of program the student is enrolled in | Bachelor’s = 0 Teacher licensure = 1 Technologist = 3 Others (open programs and students enrolled in separate courses) = 4 |
| Shift | Indicates whether the student is enrolled in a full-time program | No = 0 Yes = 1 |
|
| Average age | Student average age in the program | Average age of students enrolled in the program | |
| Average dedication | Average hours dedicated to the program by students | Average hours dedicated by students enrolled in the program | |
| Proportion of women | Proportion of female students enrolled in the program | Relative frequency of women enrolled in the program | |
| Proportion of Prouni or Fies | Proportion of students who entered the program via Prouni or Fies | Relative frequency of entrants via Prouni or Fies |
Source: Avaliação docente.
The first stage of analysis is descriptive, with the exploration of participation rates for all semesters that made up the cycle of teacher evaluations. Then, we analyze how the characteristics of students and their programs are associated with participation, through simple cross-referencing and association tests.5 The first analysis focuses on the characteristics of the individuals encompassed in the study, in addition to providing evidence of general trends in the behavior of the variables that will be part of the explanatory model. This model corresponds precisely to the second stage of the analysis: we chose to use data modeling in order to achieve greater levels of control and identify the degree to which the characteristics of students and their programs are associated with participation in teacher evaluation.
The dependent variable is categorical, with two categories represented by zero (non-participation in the evaluation) or one (participation), therefore we used a logistic regression model. This type of analysis aims to identify explanations for the variation in student participation in the evaluation of teachers. However, because we are dealing with variables situated at two measurement levels, the hierarchical (or multilevel) logistic model was used, which allowed measuring associations both at the individual (student) and aggregate (program) levels. This type of model allows specifying each hierarchy level and then merging them into a single model, thus incorporating random effects at each level. In fact, such random effects are “random errors that represent the differences between the units at each level regarding the variable of interest in the study, even after controlling for other variables” (NATIS, 2001, p. 4). We can thus achieve greater control of variations through modeling by recognizing the different levels of the hierarchy. In other words, by specifying that the individuals in the analyzed group are aggregated by another level (i.e., the educational system that groups them by program), we are increasing our level of control over variations and any omitted variables that can influence the dependent variable precisely because of the second level’s characteristics.
By analyzing data for the six semesters of teacher evaluation, which are presented in Table 1, we found that there are no significant variations in the characteristics of students across the semesters. Therefore, the analyses below will only refer to the last semester, i.e., to the evaluation carried out in the second semester of 2018. Most students are female (52.7%), aged 19 to 22 years (48.7%), and not served by public scholarship or funding programs to attend college (80.50%). Most dedicate 21 to 25 hours (30.6%) or 26 to 30 hours a week to the program (22.2%). In addition, 37.5% of students in the second semester of 2018 had completed up to 25% of the total program hours, meaning that they were in the initial stages of their undergraduate programs.
TABLE 1 Frequency of students’ characteristics according to the semester of evaluation
| STUDENTS’ CHARACTERISTICS | 2016 | 2017 | 2018 | ||||||||||
|---|---|---|---|---|---|---|---|---|---|---|---|---|---|
| 1ST SEMESTER | 2ND SEMESTER | 1ST SEMESTER | 2ND SEMESTER | 1ST SEMESTER | 2ND SEMESTER | ||||||||
| N | % | N | % | N | % | N | % | N | % | N | % | ||
| Participation | Non-participant | 22,156 | 50.7 | 27,447 | 63.4 | 23,762 | 55.6 | 25,750 | 59.7 | 25,148 | 59.0 | 27,349 | 65.3 |
| Participant | 21,539 | 49.3 | 15,845 | 36.6 | 18,941 | 44.4 | 17,349 | 40.3 | 17,462 | 41.0 | 14,553 | 34.7 | |
| Sex | Female | 23,269 | 53.3 | 23,122 | 53.4 | 22,667 | 53.1 | 22,873 | 53.1 | 22,463 | 52.7 | 22,083 | 52.7 |
| Male | 20,426 | 46.7 | 20,170 | 46.6 | 20,036 | 46.9 | 20,226 | 46.9 | 20,147 | 47.3 | 19,820 | 47.3 | |
| Age group | 16 to 18 years | 3,717 | 8.5 | 3,033 | 7.0 | 3,286 | 7.7 | 2,595 | 6.0 | 3,381 | 7.9 | 2,749 | 6.6 |
| 19 to 22 years | 20,344 | 46.6 | 20,848 | 48.2 | 20,309 | 47.6 | 20,779 | 48.3 | 20,172 | 47.4 | 20,391 | 48.7 | |
| 23 to 25 years | 9,052 | 20.7 | 8,879 | 20.5 | 8,824 | 20.7 | 9,101 | 21.1 | 8,810 | 20.7 | 8,712 | 20.8 | |
| 26 to 30 years | 5,501 | 12.6 | 5,429 | 12.6 | 5,304 | 12.4 | 5,427 | 12.6 | 5,188 | 12.2 | 5,025 | 12.0 | |
| 31 to 40 years | 3,667 | 8.4 | 3,643 | 8.4 | 3,539 | 8.3 | 3,655 | 8.5 | 3,507 | 8.2 | 3,469 | 8.3 | |
| Over 40 years | 1,381 | 3.2 | 1,418 | 3.3 | 1,417 | 3.3 | 1,492 | 3.5 | 1,531 | 3.6 | 1,513 | 3.6 | |
| Prouni or Fies | No | 36,745 | 84.1 | 35,416 | 81.8 | 35,228 | 82.5 | 34,467 | 80.0 | 34,507 | 81.0 | 33,744 | 80.5 |
| Yes | 6,950 | 15.9 | 7,876 | 18.2 | 7,475 | 17.5 | 8,632 | 20.0 | 8,103 | 19.0 | 8,159 | 19.5 | |
| Hours dedicated to the program per week | Up to 15 hours | 5,082 | 11.6 | 5,232 | 12.1 | 5,068 | 11.9 | 5,621 | 13.0 | 5,575 | 13.1 | 5,922 | 14.1 |
| 16 to 20 hours | 7,321 | 16.8 | 7,521 | 17.4 | 7,437 | 17.4 | 7,575 | 17.6 | 7,744 | 18.2 | 8,304 | 19.8 | |
| 21 to 25 hours | 13,778 | 31.5 | 12,815 | 29.6 | 13,610 | 31.9 | 13,240 | 30.7 | 13,640 | 32.0 | 12,823 | 30.6 | |
| 26 to 30 hours | 11,203 | 25.6 | 11,299 | 26.1 | 10,874 | 25.5 | 10,797 | 25.1 | 10,308 | 24.2 | 9,309 | 22.2 | |
| Over 30 hours | 6,269 | 14.3 | 6,383 | 14.7 | 5,679 | 13.3 | 5,838 | 13.5 | 5,311 | 12.5 | 5,508 | 13.1 | |
| Stage in the program | up to 25% | 17,032 | 39.0 | 15,837 | 36.6 | 16,134 | 37.8 | 16,156 | 37.5 | 16,520 | 38.8 | 15,700 | 37.5 |
| 26 to 50% | 11,162 | 25.5 | 11,427 | 26.4 | 10,788 | 25.3 | 10,853 | 25.2 | 10,372 | 24.3 | 10,627 | 25.4 | |
| 51 to 75% | 8,372 | 19.2 | 8,772 | 20.3 | 8,788 | 20.6 | 8,699 | 20.2 | 8,555 | 20.1 | 8,169 | 19.5 | |
| 76 to 100% | 6,439 | 14.7 | 6,717 | 15.5 | 6,495 | 15.2 | 7,004 | 16.3 | 6,774 | 15.9 | 7,097 | 16.9 | |
| Over 100% | 690 | 1.6 | 539 | 1.2 | 498 | 1.2 | 387 | 0.9 | 389 | 0.9 | 310 | 0.7 | |
Source: Avaliação docente, 2016-2018.
RESULTS AND DISCUSSION
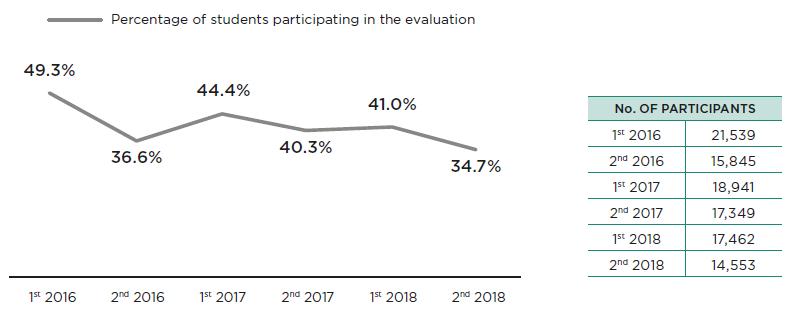
High engagement levels and high response rates in online surveys are a challenge as identified by the literature (BOWLING, 2005; CARNEIRO; DIB, 2011; WACHELKE et al., 2014; ANDERSON; CAIN; BIRD, 2005; FAN; YAN, 2010; MOSS; HENDRY, 2002). In our case study the scenario is not significantly different: although the response rate is higher than that obtained by many online questionnaires, it still has a potential for growth.
Source: Avaliação docente, 2016-2018.
GRAPH 1 Student participation rate in teacher evaluation, 2016 to 2018
Graph 1 shows the distribution of students’ participation rates in the teacher evaluation in such a way that only students whose responses covered all 16 questions about teachers are considered as participants.6 Here, it is worth mentioning an important caveat: these response rates are much higher than those considered expected in online survey surveys - 11% - according to Fan and Yan (2010). We believe the reason for this is that, unlike surveys conducted through online platforms and made available for anyone to access and participate, this survey focuses on the population of interest as respondents, i.e., on students in undergraduate in-person programs at a private higher education institution. Moreover, the university adopts several online and in-person publicizing strategies.
Table 2 shows the descriptive analyses considering the participation or non-participation of students for the second semester of 2018. With regard to individual characteristics, we can see that female students tend to participate in a greater proportion than male students. The youngest, aged between 16 to 22 years, are the students who participate most, in addition to those over 40 years old. This result shows us that the relationship between age and participation in the evaluation is not linear since the groups that proportionally participate most are at the extremes of the age distribution.
TABLE 2 Students’ characteristics according to participation in the evaluation
| STUDENTS’ CHARACTERISTICS | NON-PARTICIPANT | PARTICIPANT | CHI-SQUARE | |||
|---|---|---|---|---|---|---|
| N | % | N | % | |||
| Sex | Female | 13,509 | 61.2 | 8,573 | 38.8 | 344.19*** g.l. = 1 |
| Male | 13,840 | 69.8 | 5,980 | 30.2 | ||
| Age group | 16 to 18 years | 1,564 | 56.9 | 1,185 | 43.1 | 235.25*** g.l. = 5 |
| 19 to 22 years | 12,957 | 63.5 | 7,434 | 36.5 | ||
| 23 to 25 years | 6,079 | 69.8 | 2,632 | 30.2 | ||
| 26 to 30 years | 3,466 | 69.0 | 1,559 | 31.0 | ||
| 31 to 40 years | 2,320 | 66.9 | 1,149 | 33.1 | ||
| Over 40 years | 944 | 62.4 | 569 | 37.6 | ||
| Prouni or Fies | No | 23,024 | 68.2 | 10,719 | 31.8 | 671.80*** g.l. = 1 |
| Yes | 4,325 | 53.0 | 3,834 | 47.0 | ||
| Hours dedicated per week | Up to 15 hours | 4,619 | 78.0 | 1,302 | 22.0 | 625.15*** g.l. = 5 |
| 16 to 20 hours | 5,543 | 66.8 | 2,761 | 33.2 | ||
| 21 to 25 hours | 7,738 | 60.3 | 5,085 | 39.7 | ||
| 26 to 30 hours | 5,749 | 61.8 | 3,560 | 38.2 | ||
| Over 30 hours | 3,676 | 66.7 | 1,832 | 33.3 | ||
| Stage in the program | Up to 25% | 9,712 | 61.9 | 5,987 | 38.1 | 210.47*** g.l. = 4 |
| 26 to 50% | 6,940 | 65.3 | 3.687 | 34.7 | ||
| 51 to 75% | 5,415 | 66.3 | 2,754 | 33.7 | ||
| 76 to 100% | 5,039 | 71.0 | 2,058 | 29.0 | ||
| Over 100% | 243 | 78.4 | 67 | 21.6 | ||
Source: Avaliação docente, 2nd semester, 2018.
A similar relationship is found regarding the dedication in weekly hours: students who participate in the evaluation tend to the dedication more time to the program (over 20 hours per week); however, students who dedicate over 30 hours a week tend to participate less, which may stem from less time available to conduct the evaluation. The same does not occur regarding students’ stage in the program: the students who participate most in the evaluation are those in the early stages of their programs. That is, the more advanced in the program, the fewer students participate in teacher evaluation. This may be due to the greater number of tasks these students have to deal with, such as internships, work, or a matter of motivation in the sense of tangible results that they can expect from participating. In other words, since the changes that come about through evaluation processes tend to be incremental and progressive, students approaching the end of the program may tend to believe they will not benefit from such changes and, therefore, will not participate in the evaluation.
TABLE 3 Program characteristics according to participation in the evaluation
| PROGRAM CHARACTERISTICS | NON-PARTICIPANT | PARTICIPANT | CHI-SQUARE | |||
|---|---|---|---|---|---|---|
| N | % | N | % | |||
| Type | Bachelor’s | 26,220 | 65.8 | 13,628 | 34.2 | 161.16*** g.l. = 3 |
| Teacher licensure | 814 | 52.0 | 750 | 48.0 | ||
| Technologist | 205 | 56.6 | 157 | 43.4 | ||
| Other | 110 | 85.9 | 18 | 14.1 | ||
| Shift | Part-time | 25,213 | 65.5 | 13,299 | 34.5 | 8.31** g.l. = 1 |
| Full-time | 2,136 | 63.0 | 1,254 | 37.0 | ||
| NON-PARTICIPANT | PARTICIPANT | T-TESTa | ||||
| MEAN | STANDARD DEVIATION | MEAN | STANDARD DEVIATION | |||
| Average age | 25.53 | 3.48 | 25.36 | 3.29 | 4.799*** g.l. = 41,900 | |
| Average weekly hours | 22.8 | 2.41 | 23.1 | 2.2 | -12.630*** g.l. = 41,900 | |
| % of women | 50.34 | 19.56 | 52.38 | 20.7 | -9.959*** g.l. = 41,900 | |
| % of Prouni/Fies students | 14.83 | 12.55 | 16.9 | 14.29 | -15.277*** g.l. = 41,900 | |
Source: Avaliação docente, 2nd semester, 2018.
Significance: *** p<0.01, ** p<0.05, * p<0.1.
a Equal variances assumed with a significant F for all cases.
Concerning how students support their studies, i.e., whether or not the student is served by a government scholarship or funding program, we found that the percentage of those who participate in the evaluation is higher among students served by such programs. This can be interpreted as a proxy for students’ socioeconomic conditions, which reveals greater participation in the evaluation among lower-income students. In addition, being served by such funding and scholarships may lead these students to increase their institutional commitment and prioritize participating in the evaluation.
In turn, when we focus on the characteristics of the programs students are enrolled in, there is greater participation among those taking a teacher licensure program or programs classified as technological. We may attribute this to an interest in evaluating teachers by individuals who are studying to pursue teaching careers. As for the shift, we found greater participation among students enrolled in full-time programs, which can be attributed to greater exposure to news about the evaluation, given the dissemination strategies mentioned earlier.
Finally, by analyzing the averages for the continuous variables according to students’ participation or non-participation, we found that students participating in the evaluation are enrolled in programs that are, on average, formed by young people, with higher average weekly class hours and higher percentages of women and students served by government programs (Prouni and Fies).
Tests of association between the variables were performed for all these analyses, and all results are statistically significant, i.e., the results of the chi-square and t-tests indicate that there is an association between student and program characteristics and student participation or non-participation in the evaluation. Therefore, based on this data analysis, we now proceed to a multivariate analysis using a hierarchical logistic model whose results are presented below.
Table 3 shows the multilevel logistic regression models where the dependent variable is the participation or non-participation in the teacher evaluation, and the independent variables are the characteristics of both the students and the programs they are enrolled in. The initial step for this analysis consisted of building a multilevel model only with the students’ characteristics, but also grouping students by program. Thus, the result of Model 1 indicates that there is a significant difference between the groups, considering the constant, which means that grouping the students by program is relevant to explain participation as a second level of analysis. Therefore, we proceeded to build the second model by introducing the variables with the programs’ characteristics, and we found that there is practically no change in the results regarding the students’ characteristics between the two models. Considering this, it is worth mentioning an important caveat: we performed various analyses that are not presented, even controlling for the effects by semester of evaluation, but there was no relevant difference between the results. Therefore, the analysis was carried out considering only the last semester of evaluation, as shown in the following model, whose results are expressed in odds ratio.
TABLE 4 Multilevel logistic regression for participation in the teacher evaluation
| LEVEL 2 | ||
|---|---|---|
| Female | Reference | Reference |
| Male | 0.684*** (0.0163) | 0.683*** (0.0163) |
| 16 to 18 years | Reference | Reference |
| 19 to 22 years | 0.878*** (0.0406) | 0.877*** (0.0406) |
| 23 to 25 years | 0.813*** (0.0427) | 0.810*** (0.0426) |
| 26 to 30 years | 0.971 (0.0553) | 0.968 (0.0551) |
| 31 to 40 years | 1.227*** (0.0747) | 1.224*** (0.0745) |
| 41 years or older | 1.465*** (0.109) | 1.466*** (0.109) |
| Admission without Prouni/Fies | Reference | Reference |
| Prouni or Fies | 1.663*** (0.0457) | 1.658*** (0.0456) |
| up to 15 weekly hours | Reference | Reference |
| 16 to 20 weekly hours | 1.734*** (0.0725) | 1.730*** (0.0724) |
| 21 to 25 weekly hours | 2.163*** (0.0886) | 2.149*** (0.0881) |
| 26 to 30 weekly hours | 2.095*** (0.0922) | 2.132*** (0.0941) |
| 31 or more weekly hours | 1.812*** (0.0873) | 1.833*** (0.0884) |
| up to 25% | Reference | Reference |
| 26 to 50% | 0.892*** (0.0350) | 0.888*** (0.0348) |
| 51 to 75% | 0.813*** (0.0380) | 0.808*** (0.0378) |
| 76 to 100% | 0.698*** (0.0354) | 0.694*** (0.0352) |
| Over 100% | 0.653*** (0.100) | 0.646*** (0.0991) |
| NÍVEL 1 | ||
| Bachelor’s | - | Reference |
| Licensure | - | 2.156*** (0.641) |
| Technologist | - | 2.307* (1.066) |
| Other | - | 1.035 (0.986) |
| Part time | - | Reference |
| Full time | - | 0.622*** (0.0525) |
| Age average | - | 0.901*** (0.0230) |
| Weekly hours average | - | 1.041 (0.0385) |
| % of women | - | 0.565 (0.254) |
| % of Prouni/Fies students | - | 0.881 (0.535) |
| Constant | 0.273*** (0.0296) | 2.429 (2.915) |
| Observations | 41,821 | 41,821 |
| Number of groups | 163 | 163 |
| Chi-square | 1,201.58 g.l. = 15 | 1,265.48 g.l. = 23 |
Source: Avaliação docente, 2nd semester, 2018.
Standard error in parentheses. Significance: *** p<0.01, ** p<0.05, * p<0.1.
By analyzing Model 2, we can see that all observed characteristics for Level 1 (student characteristics) have significant odds ratios (P <0.01), except for the 26-30 age group variable. Considering the sex variable, we found that being a female student increases the likelihood by 46.2% (0.683)7 in relation to male students. With regard to the age group, we found that students aged 40 or older are the ones who participate most. In this group, chances of participating are 46.6% (1,466) higher than in the 16-18 age group (the model’s reference age group). Being served by a Prouni/Fies scholarship increases by 65.8% (1,658) the chances of participation. With regard to hours dedicated to the program, the greatest likelihood is found in the 21-25 weekly hours group: in this group, the chances are 114.9% (2,149) higher than in the group who dedicates up to 15 hours per week. In relation to the percentage of program completion, we found that students in the program’s early stages are more likely to participate: a student who completed up to 25% of the program is 54.6% (0.646) more likely to participate than a student who is close to complete the program (over 100%). Therefore, we found that a female student aged 40 years or older, served by a Prouni/Fies scholarship, dedicating 21 to 25 hours a week to the program, and in the early stages of the program is most likely to participate in the teacher evaluation.
Considering all the characteristics observed for Level 2 (referring to programs), we found that teacher licensure programs contribute most to student participation, students enrolled in these programs are 115.6% (2.156) more likely to participate than students enrolled in bachelor programs. We also found that program shift (i.e., part-time or full-time) can affect student participation: the chances of participation for full-time students are 60.8% (0.622) higher than for students in part-time programs. The program’s average age also proved significant in terms of student participation, with an increase of 11.00% (0.901) in the chances of participation as students’ average age decreases by one unit, i.e., each one-year decrease. Although the other variables were also studied, they proved not significant at Level 2.
FINAL CONSIDERATIONS
The study focused on respondents’ individual characteristics and their undergraduate programs’ characteristics in order to understand participation in online surveys. Specifically, we sought to understand what characteristics can influence the probability of students’ participation in teacher evaluation in higher education. Therefore, our goal was to identify the students’ profiles that are more or less likely to participate in the evaluation.
Our results indicate that both individual’s and course’s characteristics are relevant to understand the probability of taking part in the teaching evaluation process. Female students, students over 40 years of age, and the ones served by government funding or scholarship programs are more likely to participate. Likewise, students in the early stages of their programs and who dedicate 26 to 30 hours per week to the program are also more likely to participate. Finally, students enrolled in teacher licensure programs, full-time programs, or programs with lower average age also have a greater likelihood of participating in the evaluation.
Based on these results, we found that, in addition to factors related to survey development, administration, and data collection through online surveys, it is important to explore the factors that impact respondents’ decision to participate. Therefore, it is worth noting that the fact that women participate more than men, and people over 40 years of age participate more than the youth, indicates that these characteristics affect the decision to participate in teacher evaluation in higher education. The reason is that the factors related to (i) survey development (content considered and questionnaires’ format), (ii) survey administration (definition of surveys’ respondents public, how they will be contacted or invited, and response rate monitoring) and (iii) data collection are aimed at including the entire student body in the evaluation’s process; therefore, we conclude that the factors related to the decision to participate or not in the evaluation matter.
However, it is necessary to emphasize the need to invest in a system of incentives for participation in order to increase the probability of participation also by other groups of students. In accordance with Nair, Adams and Mertova (2008), we argue for the need to reinforce the existing and new effective forms of communication with the students in order to highlight the importance of the teaching evaluation for the institution and, consequently, for the students themselves.
Finally, the study contributed to the discussion of teaching evaluation in higher education by building on this literature, in addition to providing evidence that it is important to consider the characteristics of different measurement levels. Therefore, in order to understand the dynamics of students’ participation in teacher evaluation in higher education, it is necessary to look into students’ and courses’ characteristics. Therefore, it may be assumed that evaluation results, i.e., teachers’ measured performance, should be analyzed from the same perspective - this point constitutes our research agenda.

