


Servicios Personalizados
Revista

Articulo
 texto en
  Inglés (pdf)
 Articulo en XML
 Enviar articulo por email
Compartir

 Permalink
Cadernos de Pesquisa
versión impresa ISSN 0100-1574versión On-line ISSN 1980-5314
Cad. Pesqui. vol.51 São Paulo 2021 Epub 19-Nov-2021
https://doi.org/10.1590/198053147351
HIGHER EDUCATION, PROFESSIONS, WORK
RECENT EVOLUTION OF MINORITIES’ ATTENDANCE AND PROFILE AT UNIVERSIDADE FEDERAL DE MINAS GERAIS

IUniversidade Federal de Minas Gerais (UFMG), Belo Horizonte (MG), Brazil; agolgher@cedeplar.ufmg.br
In order to decrease attendance inequalities at the tertiary level in Brazil, affirmative action policies were implemented, including the bonus and quotas policies at Universidade Federal de Minas Gerais (UFMG). Besides, the Programa de Apoio a Planos de Reestruturação e Expansão das Universidades (Reuni) and the use of Exame Nacional do Ensino Médio/Sistema de Seleção Unificado (Enem/SiSU) in the selection process may have affected the proportion of minorities in public higher education institutions in Brazil. The paper’s main objective is to verify the evolution of the student body diversity at UFMG between 2006 and 2015, addressing the effects of these changes. The Reuni, bonus and quota policies seemed to be effective in decreasing inequalities of different sorts at UFMG, while Enem/SiSU promoted an increased in attendance’s inequality. Moreover, the determinants of the propensity of belonging to low-income households, being Black/Pardo or from private or state secondary schools were assessed.
Key words: AFFIRMATIVE ACTION; REUNI; ENEM; QUOTA
Foram implementadas políticas de ação afirmativa, incluindo políticas de bônus e cotas na Universidade Federal de Minas Gerais (UFMG), com o intuito de diminuir desigualdades no acesso ao ensino superior. Além disso, o Programa de Apoio a Planos de Reestruturação e Expansão das Universidades (Reuni) e o uso do Exame Nacional do Ensino Médio/Sistema de Seleção Unificado (Enem/SiSU) no processo seletivo podem ter afetado a proporção de estudantes pertencentes às minorias frequentando instituições públicas de ensino superior no Brasil. O principal objetivo deste trabalho é verificar a evolução da diversidade do corpo discente da UFMG no período de 2006 a 2015, abordando os efeitos dessas mudanças. As políticas do Reuni, bônus e cotas parecem ser eficazes na redução das desigualdades de diferentes tipos na UFMG, enquanto o Enem/SiSU parece ter promovido um aumento na desigualdade. Além disso, foram avaliados os determinantes da propensão de pertencer a domicílios de baixa renda, de ser negro ou de ter frequentado escolas de nível médio particulares ou estaduais.
Palavras-Chave: AÇÃO AFIRMATIVA; REUNI; ENEM; COTAS
Se han aplicado políticas de acción afirmativa, incluidas las políticas de bonificaciones y cuotas en la Universidad de Federal de Minas Gerais (UFMG), con el fin de reducir las desigualdades en el acceso a la educación superior. Además de eso, el Programa de Apoio a Planos de Reestruturação e Expansão das Universidades (Reuni) y el uso de Exame Nacional do Ensino Médio/Sistema de Seleção Unificado (Enem/SiSU) en el proceso de selección puede haber afectado la proporción de minorías que asisten a instituciones públicas de educación superior en Brasil. El objetivo principal de este trabajo es verificar la evolución de la diversidad del alumnado en la UFMG entre 2006 y 2015, abordando los efectos de esos cambios. Las políticas de Reuni, las bonificaciones y cuotas parecen ser eficaces para reducir las desigualdades de diferentes tipos en la UFMG, mientras que el Enem/SiSU parece haber promovido un aumento de la desigualdad. Además, se evaluaron los determinantes de la propensión a pertenecer a hogares de bajos ingresos, a ser negros o a haber asistido a escuelas secundarias privadas o estatales.
Palabras-clave: ACCIÓN AFIRMATIVA; REUNI; ENEM; CUOTAS
Des politiques de discrimination positive ont été mises en œuvre à l’Universidade Federal du Minas Gerais (UFMG), notamments les bonus et les quotas, afin de réduire les inégalités d’accès à l’enseignement supérieur. En outre, le Programa de Apoio a Planos de Reestruturação e Expansão das Universidades (Reuni) et l’utilisation de l’Exame Nacional do Ensino Médio/Sistema de Seleção Unificado (Enem/SiSU) dans le processus de sélection peuvent avoir contribué à augmenter la proportion de minorités dans les établissements publics d’enseignement supérieur au Brésil. L’objectif principal de ce travail est de vérifier l’évolution de la diversité du corps étudiant à l’UFMG entre 2006 et 2015, en abordant les effets de ces changements. Les politiques du Reuni, des bonus et des quotas semblent être efficaces pour réduire les inégalités de différents ordres à l’UFMG, alors que l’Enem/SiSU semble avoir favorisé une augmentation des inégalités. Par ailleurs ont été évalués les déterminants liés à l’appartenance à des ménages à faible revenu, au fait d’être noir ou d’avoir fréquenté des écoles secondaires privées ou publiques.
Key words: ACTION POSITIVE; REUNI; ENEM; QUOTAS
There was an increase in the number of students attending higher education institutions in Brazil in the last decades (Caseiro, 2016; McCowan & Bertolin, 2020; Schwartzman, 2014). However, participation in tertiary education in Brazil continues to vary remarkably among different population groups (Artes & Ricoldi, 2015; Pedrosa et al., 2007; McCowan & Bertolin, 2020).
In order to decrease inequalities at public institutions, affirmative action policies were implemented, such as bonus and quota policies. More specifically in the Federal University of Minas Gerais (UFMG), it was implemented a bonus policy between the years of 2009 and 2012 (Aranha, 2009). In 2012 it was approved the national federal law of quotas and this policy replaced the bonus policy in UFMG (Telles & Paixão, 2013).
Besides, other policies recently implemented may have affected minorities attendance at public institutions of higher education in Brazil, such as the recent increase in the number of slots at public institutions due to the Support Program for Federal University Restructuring and Expansion Plans (In Portuguese: Programa de Apoio a Planos de Reestruturação e Expansão das Universidades Federais, Reuni), and the introduction of the National Exam of the Secondary Level (Enem) and the Unified Selection System (SiSU) (Francis & Tannuri-Pianto, 2012a, 2012b; Lima & Machado, 2016; McCowan & Bertolin, 2020; Nogueira et al., 2017; Silveira et al., 2015; Telles & Paixão, 2013).
The main objective of this paper is to verify the evolution of the student body diversity at UFMG between 2006 and 2015, addressing the effects of these changes in this institution’s selection process. The paper uses official records of UFMG with data for those who were selected and registered at this institution between these years. The paper’s empirical analyses address the associations of these policies with the attendance of students from low-income households, of White students, of Blacks/Pardos (The term is in general used representing Brown. Also used as Brazilians of mixed ethnic ancestries) students, and of students who attended private or public secondary schools. Moreover, the determinants of the propensity of belonging to low-income households, being Black/Pardo or from private or state secondary schools were assessed and temporal analyses of these determinants were performed.
The paper was divided into five sections besides this introduction. Next section details the main policies implemented in the selection process at UFMG between 2006 and 2015. Third section describes a literature review on the effects of such or similar changes on the students diversity. The methodology is presented in the fourth section, and the empirical results are described in the fifth. Last section concludes the paper.
Literature review
There was an increase in the number of students attending higher education institutions in Brazil in the last decades (Caseiro, 2016; McCowan & Bertolin, 2020; Schwartzman, 2014). However, participation in tertiary education in Brazil continues to vary remarkably among different population groups (Artes & Ricoldi, 2015; Pedrosa et al., 2007; McCowan & Bertolin, 2020). For instance, the percentage of Brazilians aged 18 to 24 attending universities and colleges varied from 0.83% in the first income quintile to 43.7% in the last. 20.4% of Whites/Asians attended higher education institutions, while for Blacks/Pardos/Indigenous this number was only 5.3% (Pedrosa et al., 2007). In spite of these inequalities, McCowan and Bertolin (2020) argued that there were some improvements for minorities in the accessibility to higher education institutions in Brazil, in part due to affirmative action policies recently implemented in public institutions of higher education, and also because of loan and grant policies for private universities and colleges, such as the Student Financing Fund (In Portuguese: Fundo de Financiamento Estudantil, FIES) and the University for All (In Portuguese: Programa Universidade para Todos, Prouni) (McCowan & Bertolin, 2020; Francis & Tannuri-Pianto, 2012a, 2012b; Pedrosa et al., 2007; Telles & Paixão, 2013).
Different authors empirically addressed these points. Artes and Ricoldi (2015) analyzed the recent evolution in the student’s profiles using Census data from 2000 and 2010. They observed that the proportion of Whites attending higher education institutions in Brazil was much larger than the proportion of Blacks and Pardos, but that differences had shrunk in the period. Similarly, Caseiro (2016) analyzed the influence of race inequality on chances of ending secondary education and beginning tertiary education in 2004 and 2014. The author observed that the propensity of Whites to attend higher education intuitions was larger than for non-Whites, but that differences between races decreased, and McCowan and Bertolin (2020) verified similar trends.
Likewise, Ribeiro et al. (2015) analyzed transitions in the educational system. They concluded that Blacks and Pardos had lower probabilities to make transitions in general, including from the secondary to the higher educational level, even after controlling for socioeconomic variables. In addition, results for Blacks were even worse than for Pardos. However, similarly to the previously mentioned authors, Ribeiro et al. (2015) also observed a general decrease in the effects of race in the probabilities of transition.
In a similar vein, Marteleto (2012) studied educational disadvantages in Brazil from 1982 to 2007. She observed that inequalities associated with the dichotomy White versus non-White persisted, but declined. Moreover, differences between Blacks and Pardos became non-significant at the end of the analyzed period. She proposed two explanations for these results, structural changes and shifts in racial classification, and found evidence for both. Concerning the first, socioeconomic gaps between Blacks and other groups in the population decreased. Regarding the second, there was a “darkening” with education, as more educated individuals showed a greater propensity to self-declare Black as skin color.
Moreover, the proportion of non-Whites tends to be smaller in more prestigious courses (Artes & Ricoldi, 2015; Ferreira, 2020). Similarly, Carvalhaes and Ribeiro (2019) and McCowan and Bertolin (2020) observed that disadvantaged students were mostly directed to lower quality for-profit institutions and to less prestigious courses.
There are other factors besides race that also impact higher education institutions attendance, such as household income, parents’ educational attainment and household arrangements, all also correlated with race (Caseiro, 2016; Silva & Hasenbalg, 2002). Silva and Hasenbalg (2002) observed that Whites, individuals living in higher income households, with household heads with higher levels of formal education, and in smaller households tended to progress more effectively in the Brazilian educational system. Household income also impacts on the propensities of transition, as students from richer family show greater propensities to make the transitions in the different levels of the educational system. Nonetheless, it was also observed a decrease in the effects of income in the probabilities of transition for the elementary and secondary levels (Caseiro, 2016; Marteleto, 2012; Ribeiro et al., 2015).
These mentioned authors described some of the factors associated with the differences in higher education institutions attendance. However, the focuses here are the consequences of changes in the students’ selection process, including affirmative action policies. Concerning these points, Epple et al. (2008) analyzed the effects of a ban of an affirmative action based on race in the US and concluded that there would be a substantial impact on the racial composition of colleges, decreasing the proportion of Blacks and of racial diversity. In a similar vein, Long (2004) analyzed changes in application behavior of minorities and non-minorities due to a ban of race-based affirmative action in Texas and in California. He observed that both groups significantly changed their behavior and the gap between the number of SAT score reports sent by non-minority and minority students widened, possibly due to a decrease in the expectation of minorities of being accepted (Dickson, 2006). Bertrand et al. (2010) examined an affirmative action program directed to individuals from a lower-caste in India. They observed that the displaced upper-caste applicants were richer than the displacing lower-caste applicants. Nonetheless, this affirmative action excluded other more disadvantaged groups, as the lower-caste admitted were those from stronger socioeconomic backgrounds among the caste.
Similarly, many authors analyzed the associations of different affirmative action policies in Brazil with the profile of the students poll at public institutions of higher education. Piotto and Nogueira (2016) studied data for a bonus policy that was created in 2006 in Universidade de São Paulo (USP). The results of this affirmative action indicated that the proportion of students from public schools and from low-income families attending the university increased; however, this same tendency was not observed for individuals whose father had low educational attainment. This indicated that the policy helped individuals to overcome some of the difficulties imposed by low SES, but was ineffective to the father’s poor cultural background. Francis and Tannuri-Pianto (2012a, 2012b) examined the quota policy in Universidade de Brasília (UnB), implemented in 2004, and observed that the proportion of black and dark-skinned students increased, and that displaced applicants were from higher SES level. Ferreira (2020) observed that affirmative action policies were effective in increasing the proportion of non-whites in most universities in Brazil.
In particular for UFMG, Carnevali and Amaral (2016) analyzed whether the bonus policy in UFMG had changed the student body between 2011 and 2014 and verified relative stable numbers, a initially non-expected consequence of the policy. In a similar vein, Aranha et al. (2012) analyzed the effects of the implementation of the bonus policy and the effects of the Reuni policy. Before both policies, the proportion of students from public schools who applied to UFMG was decreasing. After this policy, the tendency was of stabilization, with a proportion close to 45%. Hence, as emphasized by Peixoto and Braga (2012), the implementation of the bonus policy did not alter the demand for tertiary education among minorities as expected. The number of applications from public schools fell between 2002 and 2007 and was approximately stable between 2007 and 2011. Concerning the approved in the university entrance exam, before the policy they were around 25% of the total, a number much smaller than those who applied to a tertiary education slot, close to 50%. After the implementation of the bonus policy, close to 47% of those selected in the university came from a secondary public school, a similar number than the proportion who applied.
These studies described race and socioeconomic trends for higher education institutions attendance. These trends have as their determinants a myriad of racial and socioeconomic factors that are directly affected by the specific policies implemented in the selection process. Next section details the main changes that occurred in UFMG’s selection process.
Main policies implemented in the selection process at UFMG between 2006 and 2015
There were major changes in UFMG’s selection process between 2006 and 2015, as briefly mentioned in the introduction. They are further detailed in this section and are summarized in Chart 1.
In order to decrease attendance inequalities between population groups and increase the proportion of Blacks/Pardos/Indigenous students and those from low-income households in public universities, many institutions in Brazil implemented affirmative action policies in the last decades. The Universidade Estadual do Rio de Janeiro (UERJ) was the first to implement such policies in 2002 and then similar policies spread to a large number of higher education institutions all over Brazil (Telles & Paixão, 2013).
More specifically at UFMG, it was implemented a bonus policy between the years of 2009 and 2012 (Aranha, 2009). This policy increased 10% the grades obtained in the entrance exam for individuals who had attended public schools in the last seven years of elementary and secondary education. In addition, an extra 5% bonus was given to those who considered themselves Blacks/Pardos/Indigenous. This policy with minor changes was valid until the entrance exam of 2012. In 2012 it was approved the national federal law of quotas that was implemented in federal higher education institutions (Telles & Paixão, 2013). Beginning at the entrance exam of 2013, at least 12.5% of the students in each course had to have done all their secondary schooling in a public institution. This number increased to 25%, 37.5% and 50% respectively in the years of 2014, 2015 and 2016. Since 2016 this is the implemented affirmative action policy in federal higher education institutions in Brazil.
Besides these affirmative action policies, other policies may also have affected the proportion of minorities in public institutions of higher education in Brazil, such as the Reuni, which promoted a remarkable increase in the number of slots in public federal universities in Brazil between 2008 and 2012. In particular at UFMG, the increase was from 4.6 thousands to 6.6 thousands slots annually (Aranha et al., 2012; Lima & Machado, 2016).
There was a third major change in the selection process of public institutions of higher education in Brazil that was the introduction of Enem/SiSU as the main procedure in the students’ selection process. In particular at UFMG, there were two main changes in the exams that were applied to applicant’s since 2008. Until 2010 there was an UFMG’s exam in two stages. From 2011 to 2013, four exams of the Enem (mathematics, language, science and humanities) were used as the first stage, while the second stage continued to be an UFMG’s own exam with the incorporation of the composition from ENEN. Since 2014 the five exams of Enem and the Unified Selection System (SiSU) began to be used in UFMG as the main toll for student’s selection (Lima & Machado, 2016; Nogueira et al., 2017; Silveira et al., 2015). All these changes may also have affected the proportion of minorities attending UFMG.
The paper analyses data of UFMG’s applicants between 2006 and 2015. Thus, most changes had already occurred in the end of the analyzed period. Notice, however, that the periods in which the policies were implemented are quite short and different between them. The bonus policy was the implemented affirmative action policy for only four years. The quota policy is the current affirmative action policy, nonetheless, the database used in this paper is from 2006 to 2015. The quota policy was still being implemented in this last year. Reuni was a policy that increased the number of slots at UFMG between 2009 and 2010. Before this policy the number of slots was smaller and, since then, UFMG has a larger number of slots. The main current method of students’ selection is the ENEN/SiSU. In our database it was present in the last three years, while UFMG´s exam in two stages, and the Enem in the first stage and a UFMG’s exam in the second stage are respectively present in five and three years in the analyzed period.
These differences are partially taken into account while discussing the empirical results because data is for each year, but pooled for all the period. Nonetheless, policies’ effects may be different depending on the time since its implementation. I do not tackle this limitation in the paper. Moreover, these policies interact with each other. For instance, the effect of a bonus policy may vary due to the Reuni policy. I acknowledge this aspect, however, the empirical analysis did not include interactions, in part due to problems of colinearity.
CHART 1 POLICIES OF STUDENTS’ SELECTION AT UFMG BETWEEN 2006 AND 2015
| Year | Affirmative action policy | Number of slots | Exam for selection |
|---|---|---|---|
| 2006 | No major policy | Approximately constant | UFMG’s exam in two stages |
| 2007 | |||
| 2008 | |||
| 2009 | Bonus policy: 10%/15% | Increased remarkably | |
| 2010 | |||
| 2011 | Approximately constant | Enem in the first stage and UFMG’s exam in the second | |
| 2012 | |||
| 2013 | Quota policy: 12.5% | ||
| 2014 | Quota policy: 25% | Enem/SiSU as the main method | |
| 2015 | Quota policy: 37.5% | ||
| 2016 | Quota policy: 50% |
Source: Survey data.
Based on Chart 1, there are different possibilities of comparative analysis. The main characteristics of the selection process did not change between 2006 and 2008. Between 2008 and 2009, two main changes occurred in the selection process at UFMG: the implementation of the bonus policy and the increase in the number of slots. Between 2009 and 2010, the number of slots increased further. The Enem replaced the UFMG´s own exam as first stage of the selection process in 2011. Between 2012 and 2013, the affirmative action policy changed from bonus to quota policy. The quota policy increased in coverage between 2013 and 2016. The second stage of the selection process was suppressed between 2013 and 2014.
All these changes presented in box 1 enables different comparisons regarding the diversity of the student body: 1) Which were the effects of the implementation of the bonus policy? 2) Which were the impacts due to the use of the Enem as the first stage exam of the selection process? 3) Which were the effects of the increase in the number of slots? 4) Which were the effects of the change of the bonus policy for the quota one? 5) Which were the impacts of the increase in coverage of the quota policy? 6) Which were the effects of the suppression of the second stage of the selection process? All these points are empirically addressed.
Methodology
Databases
The paper uses as databases official records of UFMG that were developed by the Permanent Commission of the Vestibular (Copeve) and by the Department of Academic Registry (DRCA). The databases were kindly made available for research purposes, and the anonymity of the students was preserved.
The database contains data for those who were selected and registered at UFMG in 2006 and 2015. The database contains a few demographic and geographic variables and the student’s information regarding affirmative action policies.
This database has administrative objectives as its main purpose. In order to make it a proper database for the empirical analysis performed here, most variables were modified, many others were created, and the data for each year was grouped in one database.
The final number of observations is 59281, however, these observations are not evenly distributed among the income categories or school types: 42.6% were low-income, 57.4% were non-low income, 56.5% are from private secondary schools, 28.1% are from state secondary schools, 10.9% are from federal secondary schools and only 4.5% are from municipal schools. The students are approximately even distributed among the sexes. Categories with few observations may cause some result concerns. In order to address this point, Table 1 shows the number of observations for each category of income and of school type classified by sex and skin color. The number of observations is quite high for nearly all classifications. The exceptions are individuals that did not declare their skin color and that studied in municipal schools at the secondary level.
TABLE 1 NUMBER OF OBSERVATIONS FOR SPECIFIC CLASSES
| Skin color | Sex | |||
|---|---|---|---|---|
| Female | Male | |||
| Household income | Low-income | White | 5,234 | 3,838 |
| Non-white | 8,106 | 6,109 | ||
| Did not declare | 1,019 | 837 | ||
| Non-low-income | White | 9,836 | 10,491 | |
| Non-white | 4,588 | 5,374 | ||
| Did not declare | 1,707 | 1,917 | ||
| School types | Private school | White | 10,853 | 10,168 |
| Non-white | 4,462 | 4,159 | ||
| Did not declare | 1,850 | 1,807 | ||
| State school | White | 2,833 | 2,291 | |
| Non-white | 6,017 | 4,513 | ||
| Did not declare | 485 | 456 | ||
| Federal school | White | 967 | 1,457 | |
| Non-white | 1,292 | 2,019 | ||
| Did not declare | 298 | 396 | ||
| Municipal school | White | 417 | 382 | |
| Non-white | 907 | 763 | ||
| Did not declare | 87 | 85 | ||
Source: Survey data.
Empirical strategy and variables
The empirical strategy is divided in two type of analysis. The first is a descriptive analysis of the main trends for the proportion of students at UFMG of different groups of the student body. The second is based on logistic models.
First, the paper describes the trend for low-income students. Students from low-income households are those who lived in households with a total income lower than two Brazilian minimum wages (BMW). A dummy was created with this information: (1 - Low-income, 0 - Non-low-income). Notice, however, that the real value of the BMW increased between 2006 and 2015. Thus, everything constant, it is expected an increase in the proportion of low-income students simply due to this real value change. This fact is taken into account in some analysis, which includes the real value of the BMW as a continuous variable.
After this, the paper describes the proportion of Whites and Blacks/Pardos. The database has information about ethnic group/skin color in five categories: White, Pardo, Black, Asian and Indigenous. These last two groups are not numerous at UFMG. As this variable is self-declared, there is a sixth possibility of answer for those who did not want to declare, which is a quite numerous category. A categorical variable was created with this information: (0 - Whites, 1 - Blacks/Pardos, 2 - Did not declare).
Then, trends for types of school administration are shown. Secondary schools in Brazil are classified into private and public. There are many differences between private and public secondary schools. For instance, Cavalcanti et al. (2010) found that the performance of students from public schools was smaller than those of student from private institutions, even after controlling for a set of controls. Among the public secondary schools, there are three types of administration: state, federal and municipal. Academic performance of students from federal secondary schools tend to be similar to those of students from private schools, and much higher than those of students from state or municipal schools (Golgher, 2010). These differences in academic performance directly impact in the possibilities of becoming a student at higher education institutions, such as UFMG. A categorical variable was created with this information: (0 - Municipal, 1 - Private, 2 - Federal, 3 - State).
The descriptive study is complemented by logistic models for two types of analyses. The first one uses data from all years pooled with the objective to observe general associations between the policies that were described in the previous section and the variables cited above. The dependent variables are dummies derived from the variables cited above.
The explanatory variables in the first group of models are the following: whether in the year there were UFMG’s exams in both stages (1 - Yes, 0 - No); whether the year was before, during or after the Reuni policy (1 - After, ½ - During, 0 - Before), whether there was a Bonus policy (1 - Yes, 0 - No), whether there was a Quota policy (1 - Yes, 0 - No), whether the course was a SiSU one (1 - Yes, 0 - No), whether the student was selected for the second semester of the year (1 - Yes, 0 - No), and a continuous variable for BMW real value.
The second type of analysis aims to observe temporal changes regarding individual features for specific type of households. The data is specific for the years 2006, 2011 and 2015, which were analyzed separately. The dependent variables is whether the student was: a low-income (1 - Yes, 0 - No), Black/Pardo (1 - Yes, 0 - No), from a private secondary school (1 - Yes, 0 - No), or from a state secondary school (1 - Yes, 0 - No). The students from federal or municipal secondary schools were much less numerous and are not analyzed.
Concerning the individual explanatory variables, the models included dummies for: sex (1 - Male, 0 - Female), civil status (1 - Single, 0 - Other), whether the secondary school was at evening (1 - Yes, 0 - No), whether the student had attended a preparation course to do the higher education institution exams, none as pré-vestibular (1 - Yes, 0 - No), whether the student had already an undergraduate degree (1 - Yes, 0 - No), whether the student had the following assets in the household (Domestic servant, television, fridge, computer, car: 1 - Yes, 0 - No). The models also included categorical variables: skin color (the same as above); whether the student previously knew how to read foreign languages (0 - None, 1 - Spanish, 2 - Another language, 3 - More than one foreign language); whether the student had worked while studying at the secondary level (0 - No, 1 - Up to 20 hours weekly, 2 - More than 20 hours weekly); number of individuals in the household (0 - One, 1 - Two or three, 2 - Four or five, 3 - Six or more), father and mother schooling attainment (0 - Less than elementary, 1 - Elementary, 2 - Secondary, 3 - Tertiary, 4 - The student did not know his/her father/mother schooling level); the type of secondary school that the student had attended (0 - Municipal, 1 - Private, 2 - Federal, 3 - State).
All the analysis were done with Stata 12.
Results
Descriptive statistics
This section presents the trends for the proportion of students by semester for students from low-income households, Whites, Blacks/Pardos, students from private, state or federal secondary schools. The objective is to give an overview of the trends and to relate them with the main policy changes described in Chart 1.
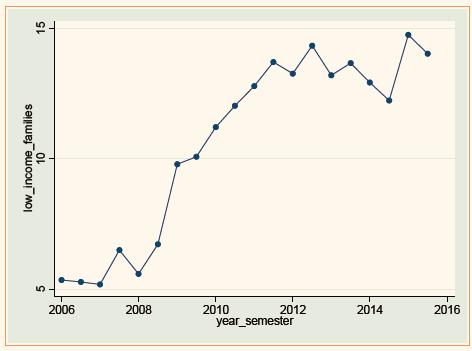
Graph 1 shows the trend for the proportion of students from low-income households. The tendency is clear. Until 2008 the values were close to 6%, increased remarkably between 2008 and 2012, and remained stable between 2012 and 2015. As shown in Chart 1, two policies were implemented in 2009, the Reuni policy and the bonus policy. Both may have had an impact on this trend. The implementation of the quota policy in 2013 did not seem to have changed the trend, as the bonus policy already existed.
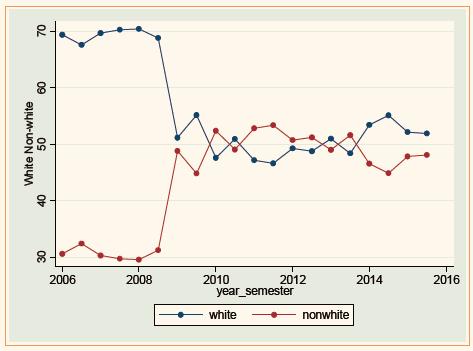
Graph 2 compares the proportions of Whites and of Non-whites (Notice that both categories sum 100%. Those who did not declare were excluded here). Before the Reuni and Bonus policies, the proportions of Whites were close to 70%. After these policies, until the implementation of Enem/SiSU, values were approximately 50%, and after the implementation of this last policy, the number was close to 52%.
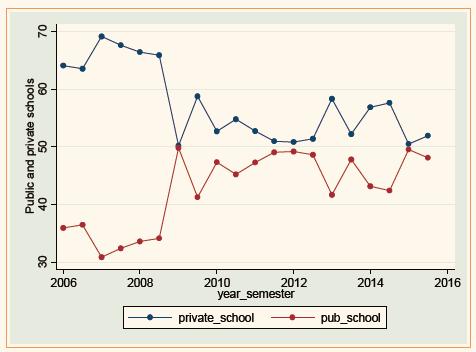
Graph 3 compares the proportions of students from public and from private secondary schools. Before the Reuni and Bonus policies, the proportions of students from private schools were around 65% and, after these policies, the values oscillated around 55%. The drop in the proportion of students from private schools in 2009 was accompanied by an increase in the proportion of students from public schools in the same year, when the bonus e Reuni policies were implemented.
Source: Authors’ elaboration.
GRAPH 3 PROPORTION OF STUDENTS FROM PUBLIC AND PRIVATE SECONDARY SCHOOLS BY SEMESTER AT UFMG
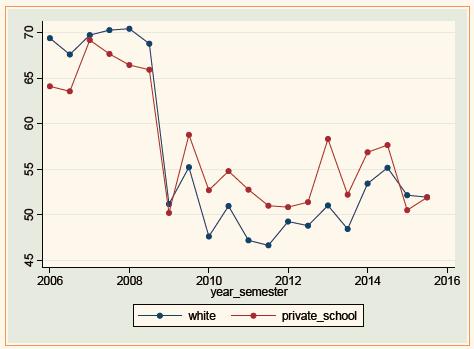
Graph 4 shows the trends for the proportion of Whites and the proportion of students from private secondary schools. Tendencies are very similar, with a remarkable decrease in 2009, and reasonable stable numbers before and after this year. The variation for Whites was even larger than for private school, from 70% to 50% around this year. However, notice that there was an apparently slight increase in the proportion of Whites between 2011 and 2015, possibly due to the change from the bonus policy to the quota policy, which was in its process of implementation, or due to the implementation of the Enem/SiSU as the main method of students’ selection.
Source: Authors’ elaboration.
GRAPH 4 PROPORTION OF WHITES AND STUDENTS FROM PRIVATE SCHOOLS BY SEMESTER AT UFMG
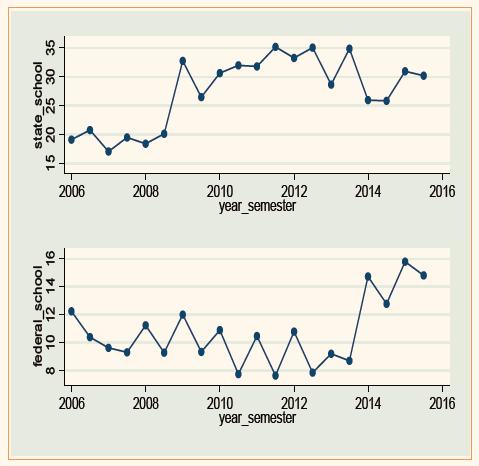
Graph 5 shows the proportions of students from state and federal secondary schools. The number of students from municipal secondary schools is small and the results are not shown. For the proportion of students from federal schools, the tendency is not similar to the one for students from public schools, shown in Graph 3, or form state schools, shown in Graph 5. Trends for public schools and for state schools are quite close, in part because students from state schools made the majority of students from public schools since 2009. For students from federal secondary schools, there was a slight decrease between 2006 and 2013 and a remarkable increase in 2014. This was the year of the implementation of the SiSU with the quota system. Besides, it can be noticed that there is a tendency that the proportions for students from federal secondary schools are greater in the first semester of the year, suggesting the higher level of performance of these students when compared to others, as already mentioned.
Logistic regressions
Table 2 shows the results of the logistic models for the first group of models. The main objective is to verify associations between the different policies and the propensity of belonging to a particular group. Notice that only two controls were incorporated to the models, which are the real value of the BMW in model 1 and a dummy for second semester in all models. The relationship between socio and demographic variables and outcomes are addressed in the second group of models. Notice that the dependent variables in the models 1 to 6 are respectively dummies for low-income students, Blacks/Pardos, Whites, students from federal secondary schools, students from state secondary schools and students from municipal secondary schools (Students from private schools cannot be analyzed with similar models due to collinearity with affirmative action policies and results area not shown).
The coefficients for UFMG’s own exam in two stages for low-income students, for Blacks/Pardos, and for state and municipal schools were all negative, while for Whites it was positive and for federal schools was non-significant. That is, when this type of selection was used in the beginning of the analyzed period, it favored Whites and did not favor the other groups. Students from federal secondary schools do not resemble students form other public schools, as already discussed. These results suggest at least two points. One is a possible time trend in favor of non-whites, low-income and student from state or municipal schools (models with time trends showed some empirical problems and are not shown). That is, there was an homogenization between the different groups in the population, what is expected by the increase in schooling levels of students with disadvantaged background. Another point is that the UFMG’s exam intrinsic characteristics may favor Whites and students from private schools.
The Reuni variable was expected to favor minorities, and the results showed that it indeed favored Blacks/Pardos and did not favor Whites. However, the other models showed negative and significant coefficients. After controlling for the other variables of the models, the Reuni policy seems not to favor low-income students or students from public schools, but Non-whites from private schools. One tentative explanation is that these students would not be selected by UFMG when there were less slots and began to be selected after the Reuni.
The coefficients for affirmative action policies all indicated the expected sign, positive for low-income, Blacks/Pardos and students from public schools and negative for Whites. The magnitude of the quota coefficients when compared with the coefficient of the bonus policy in each model was always larger than for bonus, suggesting a larger impact. Notice that the bonus policy is an effective affirmative actin policy but does not guarantee a minimum number of students from disadvantaged background in a specific course. As a consequence, minorities tended to be underrepresented in more competitive courses at UFMG (Golgher et al., 2015).
The dummy for Enem/SiSU had positive coefficients for students from federal secondary schools, and negative for low-income students, Blacks/Pardos, and for students from state and municipal schools. That is, the use of this procedure for students’ selection increased the proportion of students originated in federal secondary schools, and decreased from other public schools. The government predicted three positive results from using this procedure (Nogueira et al., 2017). One was to be the increase in students’ spatial mobility, as the same exam could be used in all states and at most public universities in Brazil so that students of secondary schools in one state could apply for tertiary education in another state with little cost. Nonetheless, Nogueira et al. (2017) and Silveira et al. (2015) concluded that these expectations were not fulfilled. In particular, the effect on spatial mobility was observed only partially and perversely, as students from higher SES states, which tend to have better secondary schools, in particular the federal ones, occupied more slots in institutions of lower SES regions.
The control for second semester showed that students who were selected for the second semester had a greater propensity of being from low-income households, Blacks/Pardos, and from state or municipal secondary schools and, conversely, had a smaller propensity of being from federal secondary schools. These results are directly linked to the smaller performance of low-income students, Blacks/Pardos and students from state or municipal secondary schools in the Enem exam (Golgher, 2010).
Finally, the control for real value of the BMW showed a positive coefficient, as expected.
TABLE 2 LOGISTIC MODELS - GROUP ONE OF STUDY
| Model 1 | Model 2 | Model 3 | Model 4 | Model 5 | Model 6 | |
|---|---|---|---|---|---|---|
| Explanatory variables | Dependent variable (Dummies for) | |||||
| Low-income | Blacks/Pardos | Whites | Federal | State | Municipal | |
| UFMG 2 stages | -0.262*** (0.0326) |
-0.308*** (0.0303) |
0.223*** (0.0292) |
-2.43e-05 (0.0474) |
-0.591*** (0.0359) |
-0.157** (0.0626) |
| Reuni | -0.186*** (0.0508) |
0.136*** (0.0346) |
-0.108*** (0.0326) |
-0.548*** (0.055) |
-0.518*** (0.042) |
-0.536*** (0.079) |
| Bonus | 0.128*** (0.00214) |
0.154*** (0.00225) |
-0.138*** (0.00235) |
0.0701*** (0.00276) |
0.191*** (0.00225) |
0.111*** (0.00353) |
| Model 1 | Model 2 | Model 3 | Model 4 | Model 5 | Model 6 | |
| Explanatory variables | Dependent variable (Dummies for) | |||||
| Low-income | Blacks/Pardos | Whites | Federal | State | Municipal | |
| Quota | 0.300*** (0.0128) |
0.364*** (0.0129) |
-0.324*** (0.0134) |
0.646*** (0.0148) |
0.668*** (0.0139) |
0.337*** (0.0275) |
| SiSU | -0.183*** (0.0273) |
-0.0654** (0.0258) |
-0.0389 (0.0250) |
0.270*** (0.0421) |
-0.190*** (0.0312) |
-0.319*** (0.0744) |
| Second semester | 0.129*** (0.0177) |
0.0754*** (0.0182) |
0.0216 (0.0175) |
-0.192*** (0.0280) |
0.148*** (0.0209) |
0.167*** (0.0405) |
| Real value for MS | 0.00203*** (0.000241) |
- | - | - | - | - |
| Constant | -2.260*** (0.19) |
-0.798*** (0.0453) |
0.246*** (0.0431) |
-1.896*** (0.0692) |
-1.115*** (0.053) |
-3.251*** (0.0993) |
| Observations | 59,090 | 59,109 | ||||
Standard errors in parentheses *** p<0.01, ** p<0.05, * p<0.1 Source: Survey data.
Tables 3 and 4 show the results for time trends of the factors that determine the propensity of belonging to specific groups in the student body. There are two main objectives here: to verify these determinants; and to observe whether there were modifications in the determinants between 2006 and 2015.
The first three columns in table 3 analyze low-income students respectively in the years of 2006, 2011 and 2015. General trends for the three years are observed for factors that modified the propensity of the students of being in a low-income household. Students who had not attended a pré-vestibular, students who did not know how to read in a language other than Spanish, those who had father and/or mother with low levels of education, those who did not have a domestic servant, a computer and/or a car in the household, and those who had studied in public schools showed a greater propensity of belonging to a low-income household. Not surprisingly, all these factors are directly linked to SES levels.
Other variables also showed general trends. Being a man decreased the propensity of being a low-income student, suggesting that low-income women are overrepresented in the low-income strata at UFMG. Many low-income men might be trapped in low-wage jobs, jeopardizing their possibility of investments on human capital. This may indicate that specific policies focusing low-income males during and after secondary schooling could be designed to facilitate the acquisition of higher schooling levels.
Notice that working in a full-time job during secondary school decreased the propensity of living in a low-income household, possibly because the student could contribute to the household´s overall income. Students who already had an undergraduate diploma showed a lower propensity of being low-income students. These students are pursuing another undergraduate diploma, and they tend to be better absorbed by the labor market, as they already have a higher education degree. Students who lived in large households also had a lower propensity of being in low-income households, mostly because more individuals tend to sum a greater total household income, as more individuals are in the labor market. Civil status showed significant results for specific years. Singles showed a greater propensity of being in the low-income group in 2011 and in 2015, but not in 2006, suggesting that young individuals in low-income households became more prone to became a student at the second half of the analyzed period. All the other variables showed non-significant coefficients or did not show a trend.
A similar analysis is performed for Black/Pardo students in the other three columns in table 3. Some factors with general trends increased the propensity of being a Black/Pardo student. These are: those who did not know how to read foreign language other than Spanish, those living in households with more people, those who had a father and/or a mother with lower education attainment, those who did not have a domestic servant in the household and those from public secondary schools. These results are expected as all these factors are associated with lower SES levels. No other general trend was noticed. However, some partial trends are observed that increased the propensity of being Black/Pardo: studding in evening classes in the secondary school in 2006 and 2011; studying in pré-vestibular in 2011 and 2015; claiming to know how to read in Spanish in 2015; not having a car in the household in 2005. All these results point to the same direction: the SES and opportunities of Blacks/Pardos relatively increased in the period when compared to Whites.
TABLE 3 LOGISTIC MODELS WITH TEMPORAL TRENDS 1
| Model 7 | Model 8 | ||||||
|---|---|---|---|---|---|---|---|
| Explanatory variables | Dependent variables (dummy for) | ||||||
| Low-income | Blacks/Pardos | ||||||
| 2006 | 2011 | 2015 | 2006 | 2011 | 2015 | ||
| Male | -0.311*** (0.0886) |
-0.384*** (0.0668) |
-0.296*** (0.0672) |
0.0382 (0.0703) |
0.0171 (0.0573) |
0.0652 (0.0562) |
|
| Single | 0.0895 (0.234) |
0.516*** (0.155) |
0.461*** (0.149) |
0.270 (0.193) |
0.443*** (0.128) |
0.179 (0.124) |
|
| Skin color | White | Reference | |||||
| Blacks/Pardos | 0.0390 (0.0972) |
0.321*** (0.0723) |
0.108 (0.0732) |
- | - | - | |
| Did not declare | 0.00105 (0.150) |
-0.0197 (0.126) |
0.0341 (0.123) |
- | - | - | |
| Evening sec. school | 0.0632 (0.17) |
0.345** (0.137) |
0.0409 (0.15) |
0.372*** (0.138) |
0.268** (0.111) |
-0.0595 (0.117) |
|
| Undergraduate degree | -0.938*** (0.274) |
-0.715*** (0.14) |
-0.687*** (0.118) |
-0.134 (0.199) |
-0.0859 (0.122) |
-0.213** (0.0976) |
|
| Pré-vestibular | -0.192* (0.1) |
-0.113* (0.0684) |
-0.220*** (0.0673) |
0.0424 (0.0778) |
0.132** (0.0578) |
0.112** (0.0565) |
|
| Read foreign language | No | Reference | |||||
| Spanish | -0.163 (0.14) |
-0.389*** (0.113) |
-0.0687 (0.142) |
-0.114 (0.118) |
0.124 (0.0945) |
0.320*** (0.118) |
|
| Other language | -0.590*** (0.127) |
-0.701*** (0.0994) |
-0.346*** (0.1) |
-0.206* (0.107) |
-0.351*** (0.0834) |
-0.272*** (0.0820) |
|
| More than one | -0.542*** (0.16) |
-0.786*** (0.113) |
-0.602*** (0.114) |
-0.146 (0.13) |
-0.487*** (0.0961) |
-0.352*** (0.0947) |
|
| Worked | Did not work | Reference | |||||
| Up to 20 hours | -0.0340 (0.253) |
0.0410 (0.142) |
0.0848 (0.144) |
0.357* (0.193) |
0.0710 (0.12) |
0.0801 (0.121) |
|
| More than 20 hours | -0.294** (0.129) |
-0.253*** (0.0964) |
-0.448*** (0.0963) |
0.0536 (0.107) |
0.0597 (0.0818) |
0.0995 (0.0794) |
|
| Model 7 | Model 8 | ||||||
| Explanatory variables | Dependent variables (dummy for) | ||||||
| Low-income | Blacks/Pardos | ||||||
| 2006 | 2011 | 2015 | 2006 | 2011 | 2015 | ||
| Indi. in the household | One | Reference | |||||
| Two or Three | -0.491 (0.299) |
-0.165 (0.216) |
-0.533*** (0.201) |
-0.331 (0.245) |
0.286 (0.18) |
0.323** (0.154) |
|
| Four or five | -0.945*** (0.295) |
-0.665*** (0.214) |
-1.278*** (0.202) |
-0.129 (0.241) |
0.341* (0.178) |
0.349** (0.155) |
|
| Six or more | -1.431*** (0.322) |
-1.162*** (0.242) |
-1.808*** (0.249) |
-0.133 (0.259) |
0.609*** (0.203) |
0.409** (0.197) |
|
| Father schooling | Less than elementary | Reference | |||||
| Elementary | -0.206 (0.152) |
-0.0580 (0.132) |
-0.271** (0.135) |
-0.0864 (0.134) |
-0.157 (0.111) |
-0.0226 (0.111) |
|
| Secondary | -0.701*** (0.131) |
-0.425*** (0.109) |
-0.552*** (0.117) |
0.0943 (0.115) |
-0.172* (0.0941) |
-0.336*** (0.0961) |
|
| Tertiary | -1.416*** (0.149) |
-1.232*** (0.119) |
-1.473*** (0.125) |
-0.387*** (0.126) |
-0.552*** (0.103) |
-0.657*** (0.103) |
|
| Unknown | 0.429 (0.35) |
0.155 (0.21) |
0.125 (0.197) |
-0.148 (0.285) |
0.120 (0.162) |
-0.132 (0.143) |
|
| Mother schooling | Less than elementary | Reference | |||||
| Elementary | 0.173 (0.168) |
-0.315** (0.143) |
0.231 (0.154) |
-0.261* (0.143) |
-0.0668 (0.119) |
-0.108 (0.124) |
|
| Secondary | 0.0438 (0.144) |
-0.328*** (0.122) |
0.0718 (0.127) |
-0.309** (0.122) |
-0.257** (0.101) |
-0.103 (0.103) |
|
| Tertiary | -0.489*** (0.159) |
-0.658*** (0.129) |
-0.638*** (0.132) |
-0.436*** (0.135) |
-0.371*** (0.109) |
-0.425*** (0.11) |
|
| Unknown | 0.122 (0.693) |
0.0767 (0.344) |
-0.367 (0.37) |
-0.575 (0.675) |
-0.744*** (0.274) |
-0.269 (0.302) |
|
| Domestic servant | -0.960*** (0.131) |
-1.267*** (0.0985) |
-1.692*** (0.143) |
-0.182** (0.0894) |
-0.404*** (0.0773) |
-0.427*** (0.0912) |
|
| TV | 0.232 (0.476) |
0.0895 (0.387) |
-0.828*** (0.295) |
0.549 (0.407) |
0.542* (0.308) |
0.160 (0.222) |
|
| Fridge | 0.508 (0.502) |
-0.856*** (0.302) |
0.0110 (0.313) |
-0.319 (0.387) |
0.0948 (0.234) |
-0.434* (0.251) |
|
| Computer | -0.925*** (0.11) |
-0.681*** (0.13) |
-0.673*** (0.219) |
0.0520 (0.0981) |
-0.147 (0.0994) |
-0.162 (0.154) |
|
| Car | -0.990*** (0.0977) |
-1.207*** (0.0831) |
-1.443*** (0.0888) |
-0.291*** (0.0868) |
-0.0693 (0.0703) |
-0.110 (0.0709) |
|
| Type of school | Municipal | Reference | |||||
| Private | -1.002*** (0.181) |
-0.791*** (0.157) |
-0.665*** (0.196) |
-0.446*** (0.159) |
-1.287*** (0.137) |
-1.243*** (0.171) |
|
| Federal | 0.0391 (0.199) |
-0.577*** (0.175) |
-0.304 (0.202) |
-0.0724 (0.175) |
-0.126 (0.155) |
-0.666 (0.177) |
|
| State | 0.117 (0.182) |
0.0695 (0.154) |
0.293 (0.193) |
0.00664 (0.158) |
-0.222* (0.134) |
-0.280* (0.168) |
|
| Constant | 2.860*** (0.743) |
4.668*** (0.544) |
5.217*** (0.542) |
-0.262 (0.6) |
0.217 (0.422) |
1.252*** (0.403) |
|
| Observations | 4,511 | 6,555 | 6,539 | 4,543 | 6,555 | 6,539 | |
Standard errors in parentheses *** p<0.01, ** p<0.05, * p<0.1 Source: Survey data.
Table 4 is similar to Table 3, but analyzed students who attended private or state secondary schools. The first three columns show the results for students from private schools. Some variables increased the propensity of being a student from a private school, presented general trends, and are associated with higher SES levels: not being Black/Pardo, knowledge of foreign languages, not having worked full-time during secondary school, higher schooling levels of father and/or mother, and the presence of domestic servant or car in the household. Notice that mother schooling is apparently more important here than in the models for low-income students, suggesting the greater importance of men as breadwinner and of women to allocate resources to education. Other general trends were also observed. Individuals who attended pré-vestibular showed a lower propensity of studying in private schools, suggesting that the choice of studying in a public school and pursuing further preparation with extra pré-vestibular courses is a reality for many students. Notice that this educational path enables the student to use affirmative action policies and also to be reasonable prepared for the entrance exams. Those who studied in evening classes showed a lower propensity of having attended a private school, as classes in these schools are mostly during the day. Some partial trends are noticed as well. The existence of a computer in the household showed a positive coefficient only for 2006, indicating that this asset in the household became non-significant in varying the propensity of studying in private schools afterwards. That is, a democratization of the asset, spreading to public school students in the 2010s. On the other hand, very poor household, represented here by the lack of a fridge, showed a negative coefficient in 2015, indicating that these households could not afford private education, even after controlling for the other variables in the model. The coefficients for male were mostly negative and significant. This result indicates that being female increased the propensity of studying in private schools, suggesting higher investments of the household in girl’s education.
The last three columns of table 4 analyze the results for state schools. Students from federal and municipal schools are much less numerous and are not analyzed here. Contrary to the observed for students from private schools, some factors increased the propensity of being a student from a state secondary school, showed general trends, and are associated with lower SES levels. These are being Black/Pardo, no knowledge of foreign languages, having worked full-time while at secondary school, lower schooling levels of father and/or mother, and the lack of domestic servant or car in the household. Other general trends are also a mirror contrary image of the results for private schools. Individuals who attended pré-vestibular showed a higher propensity of studying in state schools, indicating again that pursuing further preparation in extra pré-vestibular courses is a reality for these students. Besides, individuals who attend evening classes showed greater propensity of being from a state school, as these schools have more classes in the evening than other type of schools. For the partial trends, the existence of a computer showed a negative coefficient only for 2006, indicating that those who had this asset in the household in this year would go to private schools with greater propensity, but afterwards computers became non-significant in varying the propensity of studying in public schools. The existence of a fridge showed a negative coefficient in 2006, suggesting a trade-off for very poor households between having this asset in the household or going to school, but not afterwards.
TABLE 4 LOGISTIC MODELS WITH TEMPORAL TRENDS 2
| Model 9 | Model 10 | ||||||
|---|---|---|---|---|---|---|---|
| Explanatory variables | Dependent variables (dummy for) | ||||||
| Private school | State school | ||||||
| 2006 | 2011 | 2015 | 2006 | 2011 | 2015 | ||
| Male | -0.181** | -0.0716 | -0.297*** | -0.143 | -0.337*** | -0.025 | |
| (0.078) | (0.067) | (0.064) | (0.094) | (0.068) | (0.068) | ||
| Single | 0.417* | 0.0921 | 0.139 | 0.246 | 0.193 | 0.045 | |
| (0.229) | (0.167) | (0.155) | (0.236) | (0.139) | (0.144) | ||
| Skin color | White | Reference | |||||
| Blacks/Pardos | -0.452*** (0.0859) |
-1.135*** (0.0693) |
-1.124*** (0.0662) |
0.290*** (0.10) |
0.633*** (0.0717) |
0.483*** (0.0719) |
|
| Did not declare | -0.129 (0.131) |
-0.142 (0.127) |
-0.402*** (0.114) |
-0.0247 (0.162) |
0.0253 (0.143) |
-0.00543 (0.137) |
|
| Evening sec. school | -1.244*** (0.202) |
-1.057*** (0.159) |
-1.224*** (0.185) |
1.154*** (0.158) |
0.725*** (0.112) |
1.396*** (0.142) |
|
| Undergraduate degree | 0.403* (0.217) |
0.223 (0.145) |
0.0369 (0.114) |
-0.153 (0.282) |
0.108 (0.136) |
0.127 (0.113) |
|
| Pré-vestibular | -0.419*** (0.0881) |
-0.221*** (0.0688) |
-0.259*** (0.0642) |
0.813*** (0.116) |
0.347*** (0.0692) |
0.336*** (0.0694) |
|
| Read foreign langu. | No | Reference | |||||
| Spanish | 0.697*** (0.135) |
1.024*** (0.112) |
0.633*** (0.138) |
-0.227* (0.132) |
-0.604*** (0.0958) |
-0.489*** (0.124) |
|
| Other language | 0.789*** (0.119) |
0.784*** (0.0993) |
0.701*** (0.0992) |
-0.713*** (0.124) |
-0.862*** (0.0867) |
-0.959*** (0.0878) |
|
| More than one | 1.266*** (0.146) |
1.386*** (0.113) |
1.418*** (0.111) |
-1.306*** (0.187) |
-1.549*** (0.115) |
-1.556*** (0.111) |
|
| Worked | Did not work | Reference | |||||
| Up to 20 hours | -0.147 (0.215) |
-0.402*** (0.137) |
-0.218 (0.136) |
-0.033 (0.274) |
0.118 (0.135) |
-0.183 (0.151) |
|
| More than 20 hours | -0.856*** (0.123) |
-0.876*** (0.0991) |
-0.493*** (0.0936) |
0.186 (0.126) |
0.360*** (0.0862) |
0.243*** (0.0896) |
|
| Indi. in the household | One | Reference | |||||
| Two or three | -0.0294 (0.286) |
-0.384* (0.216) |
0.124 (0.178) |
0.304 (0.329) |
-0.0228 (0.207) |
-0.421** (0.173) |
|
| Four or five | -0.318 (0.282) |
-0.646*** (0.215) |
-0.0173 (0.179) |
0.418 (0.323) |
0.0673 (0.205) |
-0.261 (0.174) |
|
| Six or more | -0.692** (0.303) |
-0.892*** (0.243) |
-0.049 (0.229) |
0.706** (0.345) |
0.347 (0.23) |
0.0237 (0.226) |
|
| Father schooling | Less than elementary | Reference | |||||
| Elementary | 0.0718 (0.148) |
0.356*** (0.133) |
0.197 (0.134) |
-0.231 (0.149) |
-0.197* (0.113) |
-0.221* (0.117) |
|
| Secondary | 0.254** (0.125) |
0.613*** (0.111) |
0.363*** (0.115) |
-0.457*** (0.131) |
-0.385*** (0.0957) |
-0.470*** (0.101) |
|
| Tertiary | 0.801*** (0.134) |
1.247*** (0.119) |
1.123*** (0.119) |
-1.054*** (0.16) |
-1.162*** (0.117) |
-1.460*** (0.118) |
|
| Unknown | -0.00957 (0.324) |
0.419** (0.19) |
0.208 (0.176) |
0.0862 (0.327) |
-0.13 (0.165) |
-0.255* (0.153) |
|
| Model 9 | Model 10 | ||||||
| Explanatory variables | Dependent variables (dummy for) | ||||||
| Private school | State school | ||||||
| 2006 | 2011 | 2015 | 2006 | 2011 | 2015 | ||
| Mother schooling | Less than elementary | Reference | |||||
| Elementary | 0.375** (0.165) |
-0.0162 (0.148) |
0.464*** (0.160) |
-0.123 (0.157) |
0.186 (0.119) |
-0.16 (0.132) |
|
| Secondary | 0.770*** (0.139) |
0.519*** (0.122) |
0.717*** (0.134) |
-0.671*** (0.136) |
-0.314*** (0.101) |
-0.465*** (0.109) |
|
| Tertiary | 1.130*** (0.149) |
1.004*** (0.127) |
1.060*** (0.137) |
-1.078*** (0.162) |
-0.858*** (0.114) |
-0.980*** (0.119) |
|
| Unknown | 1.166* (0.691) |
0.301 (0.314) |
0.311 (0.375) |
-0.0729 (0.751) |
-0.185 (0.288) |
-0.0605 (0.33) |
|
| Domestic servant | 1.041*** (0.101) |
1.057*** (0.0959) |
1.270*** (0.113) |
-1.070*** (0.159) |
-1.128*** (0.127) |
-1.736*** (0.202) |
|
| TV | -0.47 (0.455) |
-0.804** (0.383) |
0.316 (0.261) |
-0.186 (0.459) |
0.716** (0.358) |
-0.0482 (0.253) |
|
| Fridge | 0.539 (0.471) |
0.0959 (0.273) |
-0.652** (0.273) |
-1.371*** (0.482) |
-0.166 (0.257) |
0.264 (0.289) |
|
| Computer | 0.513*** (0.106) |
0.052 (0.121) |
-0.192 (0.182) |
-0.684*** (0.109) |
-0.0213 (0.106) |
-0.0504 (0.172) |
|
| Car | 0.258*** (0.0947) |
0.751*** (0.0808) |
0.795*** (0.0817) |
-0.365*** (0.105) |
-0.633*** (0.0734) |
-0.712*** (0.0769) |
|
| Constant | -1.641** (0.688) |
-0.645 (0.482) |
-1.545*** (0.434) |
1.272* (0.710) |
0.104 (0.447) |
1.382*** (0.429) |
|
| Observations | 4,543 | 6,555 | 6,539 | 4,543 | 6,555 | 6,539 | |
Standard errors in parentheses *** p<0.01, ** p<0.05, * p<0.1 Source: Survey data.
Some conclusions can be drawn when all the four groups of models are described conjointly by variable. The coefficients for male were negative in the models for low-income and for private schools. That is, being a female increased the propensity of being from a low-income household and of studying in private secondary schools. These features suggest greater investments in and of girls concerning formal education, and points for specific policies focusing young male students from low-income households while or afterwards secondary school. Coefficients for pré-vestibular were negative for low-income and private schools and positive for state schools. These results indicate that non-low-income students from state secondary schools have a greater propensity of pursuing further preparation to do the selection process of UFMG, doing pré-vestibular, while being able to benefit from affirmative action policies. Those who studied in private schools had an already better background, and the low-income students could not afford these courses. This fact points for specific policies of expansion of free or low-cost pré-vestibular courses, although some free or very low costs course given by voluntary teachers already exist nowadays. The results for foreign language knowledge show a large gap between those who attended private secondary schools, in comparison to low-income students, Black/Pardo students and those who attended state secondary schools. This gap may be better addressed in higher education institutions, which in general have more resources for this than public secondary schools. Notice that the Enem had at the time this paper was written only 5 among 180 questions that were related to foreign language, hence this knowledge may not be so decisive in the selection process. The coefficients for working full-time while attending secondary school were negative for low-income, positive for students from state secondary schools and negative for students from private secondary schools. These results suggest that well-off secondary students do not work because they do not need to, as expected, but that the lack of employment for the not-so-well-off individuals increased their propensity of belonging to a low-income household.
Conclusion
Brazil is a highly unequal country and tertiary education attendance varies remarkably among different population groups. Many institutions in Brazil implemented affirmative action policies in the last decades and the quotas policy was implemented in federal public institutions of higher education in 2012 in order to decrease attendance inequalities (Aranha, 2009; Telles & Paixão, 2013). Besides, other policies may have affected the proportion of minorities in higher education institutions in Brazil, such as Reuni and the introduction of Enem/SiSU in the students’ selection process (Lima & Machado, 2016; Nogueira et al., 2017; Silveira et al., 2015).
This paper verified the evolution of the diversity of the student body at UFMG between 2006 and 2015, addressing the effects of these main changes in this institution’s selection process. The proportion of students from low-income households increased remarkably between 2008 and 2013. The Reuni, bonus and quota policies seemed to be effective in promoting this variation, however, changing from bonus to quota may not have being decisive for this result. The proportions of Whites and of students from private secondary schools showed similar trends with a remarkable decrease in 2009. Bonus and quota polices seemed effective to explain these results. However, contrary to these trends, the implementation of Enem/SiSU in 2014 apparently promoted an increased in Whites attendance. The drop in the proportion of students from private secondary schools in 2009 was accompanied by an increase in the proportion of students from state secondary schools, but the dynamics for students from federal secondary school differed. For the proportion of students from federal schools, there was a remarkable increase in 2014, the year of the implementation of the Enem/SiSU, a procedure for students´ selection that may have increased inequalities in attendance at UFMG.
Moreover, the determinants of the propensity of belonging to low-income households, being Black/Pardo, or from private or state secondary schools were assessed. Not surprisingly, SES levels were among these determinants. However, some other conclusions could be drawn. Being a female increased the propensity of being from a low-income household and of studying in private secondary schools. These features points for specific policies focusing young male students from low-income households while or after secondary school. Non-low-income students from state secondary schools had a greater propensity of pursuing further preparation to do the selection process of UFMG, while those who studied in private schools or low-income students had a lower propensity. These results suggest that specific policies of expansion of free or low-cost pré-vestibular courses should be promoted. The results for foreign language knowledge showed a large gap between those who attended private secondary schools in comparison to other groups of students, gap that should be shrank in higher education institutions. Thus, the empirical findings of this paper pointed to specificities that could be employed while designing policies facing some of the problems of higher education institutions attendance by minorities in Brazil.
REFERENCES
Aranha, A. (2009). Bônus sociorracial na UFMG: Vitória da inclusão e da democracia (Boletim n. 1639). Universidade Federal de Minas Gerais. [ Links ]
Aranha, A., Pena, C., & Ribeiro, S. (2012). Programas de inclusão na UFMG: O efeito do bônus e do Reuni nos quatro primeiros anos de vigência - Um estudo sobre acesso e permanência. Educação em Revista, 28(4), 317-345. https://doi.org/10.1590/S0102-46982012000400013 [ Links ]
Artes, A., & Ricoldi, A. (2015). Acesso de negros no ensino superior: O que mudou entre 2000 e 2010. Cadernos de Pesquisa, 45(158), 858-881. http://educa.fcc.org.br/pdf/cp/v45n158/1980-5314-cp-45-158-00858.pdf [ Links ]
Bertrand, M., Hanna, R., & Mullainathan, S. (2010). Affirmative action in education: Evidence from engineering college admissions in India. Journal of Public Economics, 94(1-2), 16-29. https://doi.org/10.1016/j.jpubeco.2009.11.003 [ Links ]
Carnevali, R., & Amaral, L. (2016). Políticas de ação afirmativa e as alterações na composição discente: O caso da Universidade Federal de Minas Gerais entre 2011 e 2014. In Anais do 20 Encontro Nacional de Estudos Populacionais (pp. 1-20). Abep. [ Links ]
Carvalhaes, F., & Ribeiro, C. (2019). Estratificação horizontal da educação superior no Brasil - Desigualdades de classe, gênero e raça em um contexto de expansão educacional. Tempo Social: Revista de Sociologia da USP, 31(1), 195-233. https://doi.org/10.11606/0103-2070.ts.2019.135035 [ Links ]
Caseiro, L. (2016). Desigualdade de acesso à educação superior no Brasil e o Plano Nacional de Educação. Instituto Nacional de Estudos e Pesquisas Educacionais Anísio Teixeira. [ Links ]
Cavalcanti, T., Guimaraes, J., & Sampaio, B. (2010). Barriers to skill acquisition in Brazil: Public and private school students performance in a public university entrance exam. The Quarterly Review of Economics and Finance, 50(4), 395-407. https://doi.org/10.1016/j.qref.2010.08.001 [ Links ]
Dickson, L. (2006). Does ending affirmative action in college admissions lower the percent of minority students applying to college? Economics of Education Review, 25(1), 109-119. https://doi.10.1016/j.econedurev.2004.11.005 [ Links ]
Epple, D., Romano, R., & Sieg, H. (2008). Diversity and affirmative action in higher education. Journal of Public Economic Theory 10(4), 475-501. https://doi.org/10.1111/j.1467-9779.2008.00373.x [ Links ]
Ferreira, N. (2020). Desigualdade racial e educação: Uma análise estatística das políticas afirmativas no ensino superior. Educação em Revista, 36, e227734. https://doi.org/10.1590/0102-4698227734 [ Links ]
Francis, A., & Tannuri-Pianto, M. (2012a). The redistributive equity of affirmative action: Exploring the role of race, socioeconomic status, and gender in college admissions. Economics of Education Review, 31, 45-55. https://doi.org/10.1016/j.econedurev.2011.08.005 [ Links ]
Francis, A., & Tannuri-Pianto, M. (2012b). Using Brazil’s racial continuum to examine the short-term effects of affirmative action in higher education. Journal of Human Resources, 47(3), 754-784. [ Links ]
Golgher, A. (2010). Diálogos com o ensino médio 6: O estudante de ensino médio no Brasil analisado a partir de dados do Inep (Texto para Discussão, n. 396). Cedeplar/UFMG. [ Links ]
Golgher, A., Amaral, E., & Neves, A. (2015). Desempenho acadêmico dos estudantes da UFMG: Uma análise da política de bônus sociorracial. Ciências Sociais em Perspectiva, 14(26), 120-145. https://e-revista.unioeste.br/index.php/ccsaemperspectiva/article/view/9521 [ Links ]
Lima, E., & Machado, L. (2016). Reuni e expansão universitária na UFMG de 2008 a 2012. Educação e Realidade, 41(2), 383-406. https://doi.org/10.1590/2175-623654765 [ Links ]
Long, M. (2004). College applications and the effect of affirmative action. Journal of Econometrics, 121(1-2), 319-324. https://doi.org/10.1016/j.jeconom.2003.10.001 [ Links ]
Marteleto, L. (2012). Educational inequality by race in Brazil, 1982-2007: Structural changes and shifts in racial classification. Demography, 49(1), 337-358. https://doi.org/10.1007/s13524-011-0084-6 [ Links ]
McCowan, T., & Bertolin, J. (2020). Inequalities in higher education access and completion in Brazil (Working Paper, n. 2020-3). United Nations Research Institute for Social Development (UNRISD). [ Links ]
Nogueira, C., Nonato, B., Ribeiro, G., & Flontino, S. (2017). Promessas e limites: O Sisu e sua implementação na Universidade Federal de Minas Gerais. Educação em Revista, 33, Artigo e161036. https://doi.org/10.1590/0102-4698161036 [ Links ]
Pedrosa, R., Dachs, J., Maia, R., & Andrade, C. (2007). Academic performance, students’ background and affirmative action at a Brazilian university. Higher Education Management and Policy, 19(3), 1-20. https://doi.org/10.1787/hemp-v19-art18-en [ Links ]
Peixoto, M., & Braga, M. (2012). Ações afirmativas no ensino superior e o programa de bônus para ingresso nos cursos de graduação da Universidade Federal de Minas Gerais. Revista Brasileira de Estudos Pedagógicos, 93(233), 166-188. https://doi.org/10.24109/2176-6681.rbep.93i233.465 [ Links ]
Piotto, D., & Nogueira, M. (2016). Incluindo quem? Um exame de indicadores socioeconômicos do Programa de Inclusão Social da USP. Educação e Pesquisa, 42(3), 625-649. https://doi.org/10.1590/S1517-9702201609134896 [ Links ]
Ribeiro, C., Ceneviva, R. & Brito, M. (2015). Estratificação educacional entre jovens no Brasil: 1960 a 2010. In M. Arretche (Ed.), Trajetórias das desigualdades: Como o Brasil mudou nos últimos cinquenta anos (pp. 79-108). Editora Unesp. [ Links ]
Schwartzman, S. (2014). A educação superior e os desafios do século XXI: Uma introdução. In S. Schwartzman (Ed.), A educação superior e os desafios do século XXI (pp. 15-44). Editora da Unicamp. [ Links ]
Silva, N., & Hasenbalg, C. (2002). Recursos familiares e transições educacionais. Cadernos de Saúde Pública, 18(suppl), 67-76. https://doi.org/10.1590/S0102-311X2002000700008 [ Links ]
Silveira, F., Barbosa, M., & Silva, R. (2015). Exame Nacional do Ensino Médio (Enem): Uma análise crítica. Revista Brasileira de Ensino de Física, 37(1). https://doi.org/10.1590/S1806-11173710001 [ Links ]
Telles, E., & Paixão, M. (2013). Affirmative action in Brazil. LASAFORUM, 14(2), 10-12. [ Links ]
Received: May 05, 2020; Accepted: February 08, 2021
 Este é um artigo publicado em acesso aberto sob uma licença Creative Commons
