


Serviços Personalizados
Journal

Artigo
 texto em
  Inglês (pdf)
 Artigo em XML
 Enviar este artigo por email
Compartilhar

 Permalink
Ensino em Re-Vista
versão On-line ISSN 1983-1730
Ensino em Re-Vista vol.30 Uberlândia 2023 Epub 01-Ago-2023
https://doi.org/10.14393/er-v30a2023-9
Articles
Oral explanation in graph construction teaching1

2Master’s degree in mathematics and technological education. University of Pernambuco Recife, Pernambuco, Brazil. E-mail: ritadcgm@gmail.com.
3Postdoctoral fellow at Université Laval, Canada. University of Pernambuco Recife, Pernambuco, Brazil. E-mail: gilda.lguimaraes@gmail.com.
This article aims to analyze the oral explanation of teachers in the 1st year of primary school in graph construction, considering the conceptual domain, didactic design, oral and gestural language of the teachers, visual representations and the context of the class (in-person and remote). We observed that regardless of the environment (remote or in-person), the teachers presented non-challenging didactic proposals and gaps in conceptual mastery, observed in the oral and sign language used. Studying the enunciation of oral explanation contributed fundamentally to understanding teachers’ online and in-person teaching processes. We believe that, in addition to being a way of investigating teaching, it is important for us teachers to reflect on what and how we speak in the pursuit of learning for our students.
KEYWORDS: Oral explanation; Graph construction; Statistical education; Primary school
Este artigo tem como objetivo analisar a explicação oral de professoras do 1º ano do Ensino Fundamental em aulas de construção de gráfico, considerando o domínio conceitual, concepção didática, linguagem oral e gestual das professoras, representações visuais e o contexto da aula (presencial e remota). Observamos que, independente do ambiente (remoto ou presencial), as professoras apresentaram propostas didáticas não desafiadoras e lacunas de domínio conceitual, observadas na linguagem oral e gestual utilizada. O estudo da enunciação da explicação oral contribuiu de maneira fundamental para compreendermos os processos de ensino dos professores, tanto remoto quanto presencial. Acreditamos que, para além de ser uma maneira de investigar o ensino, é importante que nós professores reflitamos sobre o que e como falamos na busca da aprendizagem de nossos alunos.
PALAVRAS-CHAVE: Explicação Oral; Construção de gráfico; Educação Estatística; Anos iniciais
Este artículo tiene como objetivo analizar la explicación oral de los docentes de 1er año de Educación Primaria en las clases de construcción de grafos, considerando el dominio conceptual, el diseño didáctico, el lenguaje oral y gestual de los docentes, las representaciones visuales y el contexto de la clase (presencial -cara y remoto). Observamos que independientemente del entorno (remoto o presencial) los docentes presentaron propuestas didácticas no desafiantes y lagunas en el dominio conceptual, observadas en el lenguaje oral y de signos utilizado. El estudio de la enunciación de la explicación oral contribuyó de manera fundamental a comprender los procesos de enseñanza de los docentes, tanto a distancia como presencialmente. Creemos que, además de ser una forma de investigar la enseñanza, es importante para nosotros los docentes reflexionar sobre qué y cómo hablamos en la búsqueda del aprendizaje de nuestros alumnos.El resumen debe contener entre 100 y 150 palabras. La redacción debe basarse en la NBR6028 y mantener la estructura indicada en esta plantilla. El resumen debe contener la presentación del tema, los objetivos, la metodología adoptada, el análisis de los resultados finales o preliminares y la conclusión.
PALABRAS CLAVE: Explicación oral; Construcción de gráficos; Educación estadística; Primeros años
Introduction
The interaction between oral language and mathematics has been studied for some years. In general, teachers talk most of the time in class. But... what do they say? Do their speeches contribute to student learning? The teachers’ explanatory behavior plays a fundamental role in the construction of students’ learning, as pointed out by Proulx, Berdnaz, and Kieran (2006) and Berdnaz (2005).
Considering the Bakhtinian perspective that language is a social, historical and cognitive activity interactively developed by individuals in their practices, in this article we analyze the oral explanation of teachers in a 1st-grade elementary school class teaching graph construction, considering their’ conceptual mastery, didactic conception, oral and gestural language, visual representations, and in-person and remote class contexts.
The role of oral explanation in the classroom
In the classroom routine, teachers’ oral explanation becomes an instrument of great relevance, as their explanatory conduct impacts students’ learning, building, structuring, and developing their thinking.
Bakhtin (2006) states that speech is a product of the interaction of two individuals, and is socially organized within a non-verbalized context of current life, which is expanded by the action, gesture, or verbal response of other participants in the situation of enunciation. Taking the interactionist conception of language as a basis implies bringing the significant contexts of text production to the classroom, which involve different genres present in the social life of students and teachers. Therefore, we emphasize the need to understand the teacher’s speech in the classroom, considering its carriers, social functions, the context of production, its structures and linguistic characteristics, such as argumentative operators (KOCH, 2010), body movements (MARCUSCHI, 2007) and mathematical language (BERDNAZ, 2005). In this work, among the different existing oral genres (SCHNEUWLY and DOLZ, 1999), we are interested in school oral genres as a means of articulation between social practices and school objects.
Along the same lines, Proulx et al (2006) argue that the explanations given in class regulate learning and allow the development of students’ knowledge. The way teachers “speak” mathematics, the things they implicitly value when exposing, explaining, or arguing, describes how they do mathematics in class. In this sense, Burges (2012) emphasizes that developing students’ mathematical understanding depends on teachers’ listening and knowledge.
Specifically in statistics teaching, the focus of this article, the challenge is even greater because statistical thinking is uncertain and context-laden. The graph is one of the possible representations of systematized information because it synthetically shows the data profile, trends, and relationships between the variables. Thus, statistics are valuable for projects and investigations in various fields. It also plays an essential role in citizenship education, to support statements in various areas of human knowledge. Thus, teaching statistics from the first years of schooling is crucial for people’s social and scientific formation, as Guimarães and Gitirana (2013) affirm.
The National Common Curricular Base (BRASIL, 2017) states that students should be encouraged to interpret graphs and build personal registers based on collected data from the 1st grade of elementary school. Guimarães, Cavalcanti and Evangelista (2020) say that students can build and interpret pictograms and bar graphs with the unit scale from the 1st grade.
Knowledge of statistics requires contextualization with real data to allow students, through research, to understand their reality and build critical thinking. Graphing is not an intuitive mental tool. However, defining data, listing orders, assigning meanings, and classifying data is necessary (CAZORLA; CASTRO, 2009).
Based on the above, we can say that teachers’ posture during statistics teaching within a communicative situation in class is fundamental to constructing this contextualization and promoting statistical literacy. Different studies have focused on graphical representations and highlighted teachers’ fundamental role (PEÇA, 2012; GUIMARÃES; OLIVEIRA; MOTTET, 2013; CAZORLA, RAMOS; JESUS, 2015; MARTINS, CURI; NASCIMENTO, 2018).
Methodology
In this work, we analyze the classes imparted by two teachers in the 1st grade of elementary school who voluntarily participated in this research. Instructed by the researchers 15 days in advance, each teacher prepared and taught graph construction in her classes. For the analyses, we used an analytical framework divided into five major topics: didactic conception - how the teachers start their classes, the activities they propose, the types of commands they use in the propositions, how they develop the activities; the types of questions asked; whether different examples are used; whether they support or challenge students; the semiotic systems used; how they deal with students’ errors; the interactive strategies developed; how they propose the resolution of the activity and, finally, given those characteristics, the type of class they develop.
In the second topic, conceptual mastery, we observe the knowledge of the addressed content and how the teachers develop their oral explanation: whether teachers link the concepts, explain their thinking steps, combine verbal and visual resources, and contextualize the concepts (MARCUSCHI, 2007; PROULX et al., 2006).
At gesturing, the third topic, we analyze whether gestures, looks, and voice intonation contribute to developing the teachers’ oral explanation during the communicative process (MARCUSCHI, 2007).
In the fourth topic, the language used, we sought to understand how the teachers’ written and oral language contributed to the development of their explanation (MARSCUCHI, 2007; KOCH, 2010, 2011). For this, we consider the social nature of language development, analyzing the possible events that can cause discontinuities in the oral explanation (repetitions, truncations, anacolutes, metacognitive activities, and excessive use of adverbs of place).
Finally, on visual representations, we verified how the different didactic resources could contribute to constructing and developing the teachers’ oral explanation.
Results
Marta4 is 29 years old. She has a pedagogy degree, is a specialist in psychopedagogy, and has worked in municipal schools for five years. She told us that she had never participated in continuing education on statistics, despite working on activities involving statistics proposed in textbooks.
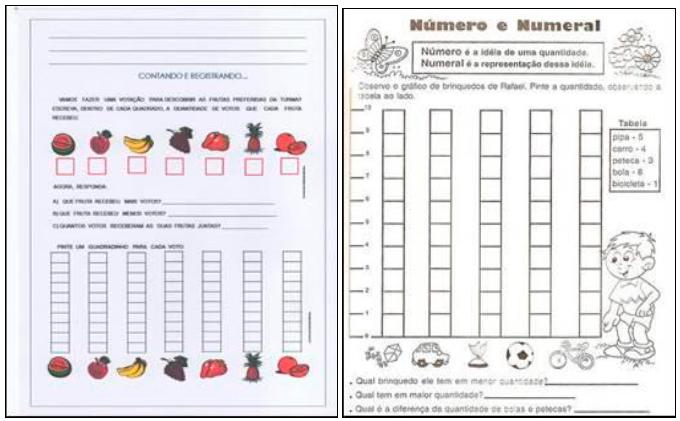
She starts her class with a conversation circle, explaining everything that will happen in class that day and emphasizing that the students will perform an enjoyable activity. She proposes two activities (Figure 1) taken from the internet that does not cover the theme of graph construction requested because the students will only be responsible for establishing a correspondence between quantity/painted cells in Activity 1 and filling in the graph in Activity 2, as it is already structured (MUNIZ; GUIMARÃES, 2021).
Marta describes the step-by-step (Extract 1) so that students reach the correct answer as she expects. Proulx et al (2006) point out that this type of explanation does not actually explain anything; it only describes the process, guiding students. Furthermore, this type of “explanation” does not allow students to construct a solution procedure; they must only copy it.
Extract 1
____________________________________________________________________________________
T: Oh, there are ten small cells there, ten. But we have eleven votes (points to the number eleven written on the board). What are you going to do? JEEZ! NOW, I DON’T KNOW. PAY ATTENTION! Pay attention! We said that there were eleven votes, but there are only...
Student 1: Ten.
T: Ten small cells. What are we going to do to equal the amount?
Students: Count (She puts her hand to her face, as if she can’t believe they answered that).
T: You will count, right. Then you will see that there, in the column...
Student 2: There are only ten.
T: There are only ten. I saw that there are only ten (she builds the pictogram with unit scale and counts). That’s it. So, now, what will I do for it to become equal to eleven? Look (draws another cell). (...)
T: - What will I do to get eleven votes? If there are only ten cells (points to the cells she drew, indicating that one cell was missing).
Student 1: Draw a cell on top, teacher.
______________________________________________________________________
We also checked for excess repetitions (Extract 2) to obtain the correct answer. Marta reminds students to choose a single fruit (since she wants each student to vote only once) but does not explain why. The repetition was also intended to call students’ attention to follow her reasoning, making students repeat her answers, focusing on the resolution, not on students’ learning and difficulties, ignoring the error and reinforcing the correct answer. This way of interacting is called by Proulx et al (2006, p. 272) an “elicitation pattern”: after proposing a task to the students, the speeches are “to guide them, directing them constantly to regular feedbacks of their performances - for what is determined and demanded as a goal to be achieved”, not promoting discussions and problematizations in the classroom.
Extract 2
_____________________________________________________________________________________
T: - There has to be 16, because each child will have to choose only one fruit, right? You have already chosen strawberry....Then...The vote. So, what did I say? YOU CAN ONLY CHOOSE ONE FRUIT! Especially because the number of votes here must equal the number of... (she points to the number 16 written on the board). This number is the amount of what?
Student: STUDENTS! (...)
T: You have already chosen. You have already voted. That’s why I said: IT’S ONLY ONE FRUIT. I’ll put it there. Someone else who didn’t vote and likes orange.
_____________________________________________________________________________________
We also checked for excess repetitions (Extract 2) in order to obtain the correct answer. Proulx et al (2006) and Rodrigues, Menezes, and Ponte (2018) state that this type of teaching is restricted to the instrumental understanding of the learning process, being considered the possibility of knowing how to do it, but not knowing why to do it.
The absence of questions to students for the development of concepts during class reveals a gap in deepening the knowledge to be discussed within Marta’s oral explanations. For the construction of the meaning of a concept, knowledge or symbolism are fundamental. However, the only semiotic element Marta used was the reproduction of the graph that helped in the conduction of her oral explanation, considering that she always referred to it during the development of reasoning.
Based on Schneuwly and Dolz (2004), Marta’s is an instructive and prescriptive class, as there is control over the activities students solve and excessive repetition of commands, without much explanation or arguments.
Regarding the interactive strategies, we found that Marta conjugates the verbs in the first person plural (we), seeking to insert the interlocutors in the action that is being developed. She tries to familiarize the current activity with previous ones, always saying that “it will be a nice activity”, showing her strong involvement with the proposed activity and the students, who are always attentive to the attempt of a communicative situation.
This way of conducting the class, saying how students should think, start the activity, and solve it, is opposed to the attitude of highlighting key elements of a concept, putting important reasoning into words, developing the ability to formulate a concept given in different ways, using current language to explain mathematical concepts, and reasoning adapted to students and, finally, reducing the distance between the technical (formal) language of mathematics, as Proulx et al. (2006) argue.
Marta only considers the correct answers given by the students in order to continue the activity. Proulx et al. (2006) analyze that this posture reflects a critical characteristic of oral explanation, which is not being open to multiple possibilities, promoting few reformulations and resumptions, scarcely directing students to discussing ideas and articulating different information and examples. Thus, the explanation becomes fragile for developing the teaching process aimed at learning.
The language Marta develops shows excessive use of expressions such as “well, let’s go, that’s it” to encourage students’ participation and ensure class progress. Anacoluts and metaenunciative language are rare. We identified the use of argumentative operators (for example, because of that, etc.), not to precede an argument, but to emphasize the action to be performed by students and promote the continuity of the activity.
Marta used adverbs of place recurrently (here, there, over there, over here) to indicate where the answers should be placed or where they should substitute statistical terms or concepts. This type of substitution is a problem for statistical verbalization, as we understand that knowledge of terminologies is a fundamental aspect in promoting students’ literacy of statistical information, as already argued by Berdnaz (2005).
Proulx et al. (2006) point out that, for the development of a good oral explanation to promote learning, the teaching process must aim at promoting students’ mathematical verbalization.
Teacher Marta mentions statistical elements such as “population control, graph, table, survey”, but does not explain the terminology to the students. She makes symbolic registers, such as fruit drawings for the voting, which complement her oral explanation due to the absence of specific vocabulary about the elements of the graph. Likewise, she uses gestures, voice intonation, and looks to reinforce her speech or to replace statistical concepts or terms.
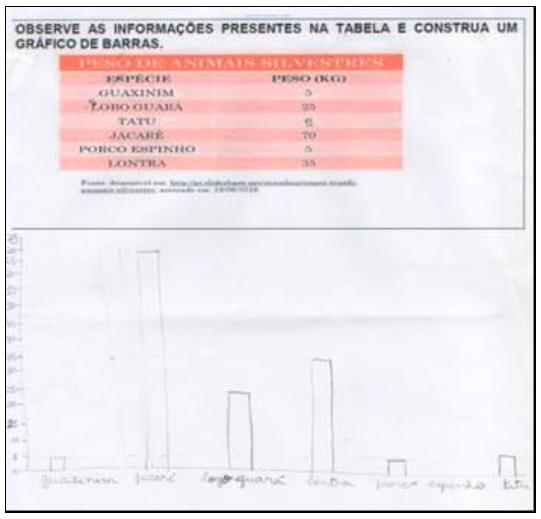
We understand that the lack of development of statistical terms may owe to a gap in the teacher’s knowledge of the topic. However, Marta presented good conceptual mastery when asked to build a graph from a table (Figure 2). She did it correctly, with a scale of 5 out of 5 and considering the minimum and maximum values, including the registration of implicit values, despite the absence of some elements, such as title, axes naming, and font.
Thus, Marta’s oral explanation is marked from the beginning by her choosing activities outside the theme, the lack of conceptual explanation with gaps in the explanation and development of concepts, the absence of examples, questionings; analogies; challenges; excess repetition markers; use of adverbs of place to replace the definition of concepts or good use of statistical language; resolution of the activities in a collective way to be reproduced by the students.
Paula is our second teacher. She is 33 years old, graduated in history, and is a specialist in Brazilian history and educational management (still in conclusion). He has 14 years of experience in different elementary school classes in several public and private schools. She works at a private school in the Metropolitan Region of Recife. However, due to the Covid-19 pandemic, both the interview and the class were held remotely. The teacher states that she has been developing statistics activities from the textbook she uses as a reference. Regarding graph construction activities, she states that “we do a lot based on this classroom (sic) with those students, sport preference, food preference (....) their favorite types of recipes.”
Paula starts her class by presenting slides (Figure 3). She reminds the students that they have already conducted a survey to find out the class’s favorite desserts and asks them to say what the function of a graph is, after which she presents another slide that contains four types of graphs: horizontal bar, vertical bar, pie, and line graph. She says that the first two are bar graphs, which appear a lot in their book and can appear in two ways, as shown in Figure 3. Later, she mentions the pie graph, shaped like a pie, and the line graph, which appears much on television to present Covid-19 data.
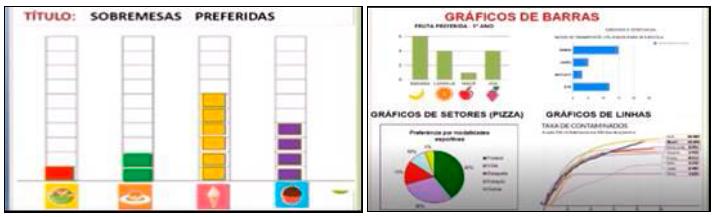
Paula uses different examples that contribute to the exposition of the concept/content she develops in class. With them, she explains the function, format or data type. In addition, she seeks to associate the exposed content with the students’ knowledge of life, as in the case of the line graph that relates to the Covid-19 rates.
Extract 3
_____________________________________________________________________________________
T: (...) Look guys, excellent! The graph brings some information. And this information is usually in the form of quantities. As the students said, very well (she mentions the names of the children who participated), that’s right, people! So, here, the teacher brought the image of various types of graphs. (Returns to the previous image), ok?! Just so you know a little bit, okay. This graph here, look. This chart here, which will appear a lot in your booklet, this chart comes up here a lot. I have a graph that will talk about the favorite fruit of the 1st-grade students. Look how cool, guys! I have a graph here called a bar graph. Because it comes in this little format here, people, in the form of a little bar. (Splits finger open with bar-sized hand). Remember the little bar that the teacher showed in the golden material?! This chart comes in that shape. Here I have the fruits (points to the horizontal axis). And here I have the quantities (points to the vertical axis) that will indicate each consumption, each favorite fruit in the first grade, okay?! Teacher, is this one also a bar chart, teacher?! Yeah (makes a nice sign with the hand). It’s a bar chart, too. But the bar here is not vertical, it’s horizontal, guys. Oh, horizontal. The bar is lying down, okay?! But it’s still a bar chart too, okay?! Oops! I have a very different chart here. Look, guys! It’s round, it has several little parts painted here, isn’t it guys?! So what? What is the name of this graph, look: “slice charts”, which is very well known with this name here, look: pie. Why does it have that name, student?! Do you know why it’s called a pie chart?!
Student: Because it is round.
T: Because it is round (she makes the cool sign). It has the shape, right, student, of a pizza. Well done! And, now, I also brought this graph here, look, the line graph. This one, I think one of you might have seen it on television. Has anyone seen this graphic shown here on television?! Has anyone seen it showing on television?! Have you?!
_____________________________________________________________________________________
In this way, we observe a diversity of markers (examples, analogies, connections) in her oral explanation. In addition, the teacher shows students different ways of presenting data in graphs. Despite this, according to Proulx et al. (2006), she limits herself to exposing the graphs and their characteristics, without further elaboration, bringing only presentations and descriptions.
Thus, she resumes the data collected in the previous class and registers them in a table (Extract 4).
Extract 4
____________________________________________________________________________________
T: (...) Pay attention! To obtain this graph here, what did we do first? (...) that’s very good, student! We did a sur... A sur... Who remembers? We did a sur...
Students: A survey (more than one said this at different times).
T: A survey! (clapping hands). Very well then (...)
T: Yes, we surveyed, we did a poll. In the book, we have that word, don’t we, guys?! Poll. I asked you what your favorite dessert was and I wrote down every vote on a... What?! I wrote it down on a what?! I wrote it down on a ta... Who remembers?! Where did I write your votes?! I wrote them down on a ta...
Student: Task
Teacher: Tableeee. That table (opens her hands in a chart sign) where teacher Paula wrote down each vote, wasn’t it?! Every vote of yours, true or not?! (Making a cool sign to the camera). Wasn’t it?
Student: Yes, it was.
T: Yes, it was. Teacher Paula first did a survey, an interview with you. She wrote down each of your votes, so that after this table, we can make a graph. So, what is a graph for?! Can anyone tell me what a chart is for?! What is a chart for ?! Why do we use a chart?! You can turn on the microphone. What is it for? What does the graph show me?
Student: To measure things.
T: To quantify? Would that be it? (Child says yes) Cool, great!!! To give me an amount about something, isn’t it?! (...) Cool! Who thinks it’s a different thing?! You can turn on the microphone and talk. What is a graph for ?! Turn on the microphone (calling the students to participate in the answers) too. I think you want to talk. Call, [student], tell me what it’s for. (...)
Student 1: To represent quantity.
T: To represent quantities. (Makes a cool sign to the camera), well done (...)! (...)
T: What is it, student?!
Student: Quantify.
T: Yes, love! Quantify, show quantity. Give some information, isn’t it, guys?! In quantity form. Very well, guys!!! (Makes a cool sign). Excellent. (...)
______________________________________________________________________
We observed that the teacher asks the students many questions so they remember information from other classes, even presenting word parts as hints for the answers. Therefore, it is not configured as a challenging situation. She questions in different ways: “So, what is a chart for? Can anyone tell me what a chart is for?! What is a chart for ?! Why do we use a graph?”. However, the students did not answer as expected, and the teacher ended up presenting her definition of a graph.
Berdnaz (2005) and Proulx et al. (2006) point out different types of questioning that can be carried out within oral explanations in mathematics, among them those that lead to predetermined answers, questioning something already experienced, such as those carried out by Paula.
We also found that Paula repeats the same command several times so that the students follow her execution of the activities. Proulx et al. (2006) point out that this characteristic in the oral explanation indicates the lack of openness to different possibilities, being a reflection of the absence of conceptual mastery, which restricts the person from developing what is expected in the situation, and the teacher’s conception of teaching, which avoids unexpected answers and the confrontation of different answers or the absence of questions that lead to problematizations or challenges to be experienced.
We identified some situations in which Paula always encourages the students’ participation, congratulating them: “That’s it, love!”, “Well done, guys!!!”, “Excellent”, “You see, you know, just be calm”, she makes the cool sign. Therefore, we understand that the teacher seeks to support her students on what is being exposed and always considers what is said by them; however, she always directs them to what she wants at that moment. In this way, we could verify that teacher Paula does not promote the emergence of ideas, which leads to the non-construction of discussions, non-presentation of arguments, non-sharing of ideas, and non-legitimizing of the exposed content.
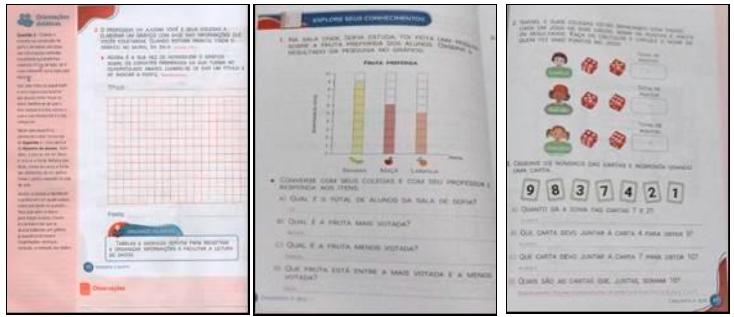
Next, Paula presents the first activity involving building a graph. The other two activities are interpreting a graph with fictitious data and adding numbers. All proposed activities are in the booklet the school adopts but has not been evaluated by the PNLD 2019 (Figure 4).
During the graph construction activity proposed in the book, we observed that Paula does the activity step by step, as shown in the following excerpt.
Extract 5
______________________________________________________________________
T: Pay attention, pay attention. In that title line, we’re going to create a title. What did we say there for this poll?! Teacher Paula did a poll about what? Can you tell me, guys?! The poll I did talks about what?
Student: Favorite Sport.
T: Yes, Flavinha! Favorite sports. Let’s write there in the title? Favorite sports? Who out there agrees to say [it]?
Student: I do. (...)
T: And now, teacher Paula, what am I going to do? We’re just going to do a representation our way. From that poll I did with you, which I wrote down in the table, we are going to turn it into a graph now. What kind of graph?! BAR GRAPH. So I come under the last little box and look... Not the last one, sorry, the first box. Look for the first box here, look, just like teacher Paula’s. Put the letter F there, put the letter F in the first cell. Look, [student], just like mine. You don’t need to draw the ball. (...)
T: It’s not at the bottom, it is like teacher Paula’s. Down there, at the bottom of the checkered part, you’re going to take the first cell and put the F, okay? In the first, under the first cell. It’s the same. Teacher Paula’s is like yours. You will only do the same for me. Put the letter F, put the letter F, okay?! Then, so as not to amend, guys, the columns, what are you going to do? You are going to leave two cells here, look, in front of the F. You leave two cells. Leave this space of twe cells, go to the third cell and insert “N”, N for swimming (natação, in Portuguese). Leave the two cells here for space, okay? Leave these two cells and put the N, N for swimming, ok?! Follow me, you can’t miss it. Do like teacher Paula is explaining, that there’s no way it can go wrong, okay?! After I insert the letter N, I leave two more cells in front of the N. Leave two cells without doing anything, just to give a little space, then I insert the letter V for volleyball, I put the letter V for volleyball, okay? ! I put the letter V for volleyball, I’m going to leave two cells here in front, just not to let everything too close to the other. I let two empty cells and insert the letter B for basketball. I finished my chart. I finished the format of my graph.
Emily: Must I put the letter where you put it?
T: Yeah, put the letter right there where teacher Paula put it. Remember to let two empty cells of space between the letters. Leave two cells of space, okay?! Has everyone inserted the letters? Yes or no? (At that moment, she makes a cool sign).
______________________________________________________________________
The teacher instructs the students on constructing the graph, not promoting discussions or reflections.
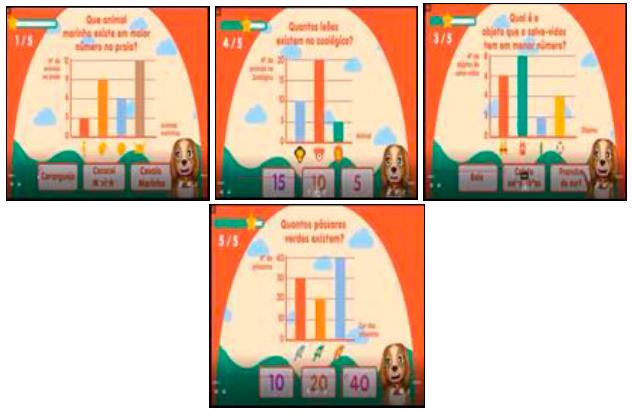
Finally, the teacher shows a video with five fictitious situations of graph interpretation, and after each situation, she pauses the video to pick a student to answer what is being asked in the image.
During this class, she uses different semiotic elements, such as a replica of the book, graphs, and videos. However, these elements are placed as a support for her exposition. Berdnaz (2005) highlights the importance of using different semiotic elements in constructing and developing mathematical concepts, which we believe are also fundamental in statistics.
Paula listens to everything the students say but considers only the correct answers and directs the incorrect ones without problematizing the error or understanding the difficulties presented. This type of attitude was also found by Proulx et al. (2006), who claim that, for the teacher to contribute to the discussions promoted in the classroom, the teacher must understand students’ strategies to make them explicit, seeking to promote discussions and reflections about them.
Thus, based on the genre grouping table created by Dowlz and Schneuwly (2004), we found that Paula’s oral explanation is strongly marked by the transmission and construction of knowledge of exposure. She makes textual presentations in different ways, using questions to recover previous information, and makes different expositions with different examples on the slides.
Considering the interactive characteristics pointed out by Marcuschi (2007), we observed that the teacher is very involved in the class due to some characteristics, such as the various attempts to contextualize the content, characterizing the teacher’s immersion in the activities. We also identified that she constantly calls the students by their names. Differently formulated questions and conversational markers show an interaction situation, characterizing the speaker’s engagement with the listener. Finally, we also verified that Paula uses many redundancies (repetitions) and exaggerations during her oral explanation, which characterizes her involvement with the subject.
Paula’s activities tend to focus on resolutions. Despite being more sensitive to listening to what the students said, she was not prone to understanding and reflecting on their difficulties. Instead, she directed the student's actions to obtain the correct answer. According to Rodrigues, Menezes, and Ponte (2018), this occurs because of the teacher’s professional characteristics.
When we resumed the interview with the teacher, we identified that she made some errors when building the graph. For example, she could not make a regular bar graph with the same width and thickness, which made it difficult to compare the data.
She also chose a unitary scale for the graph, which makes data analysis even more difficult. Neither did she show corresponding axes and names. During the protocol analysis, she identified the children’s errors and successes but could not justify or explain what led them to the error. Thus she did not point out ways students could overcome the error. Teacher Paula believes that all activities can be proposed from the 2nd grade onwards.
In this analyzed class, we noticed that the teacher presents some terms such as: research/pool, table, graph/chart, title (without explaining), and scale (relates the scale to the grid cell). However, she presents research, poll, and interview as synonyms (Extract 3). We could see the teacher’s enormous commitment to seeking different semiotic elements to contribute to students’ learning. However, we observed that her description of statistical concepts is superficial and, sometimes, mistaken.
The absence of conceptual mastery does not allow the teacher to develop an oral explanation that promotes learning, as stated by Proulx et al. (2006). Graphic elements were only described and not analyzed, discussed, or problematized.
We verified that Paula promotes resumption, definitions, and conclusions of the concept being exposed, for example, when she resumes what was done in the previous class to fill out the table. Thus, we can say that the movements of resumption and systematization are essential for an oral explanation, considering that they organize both the speaker’s thinking and that of the interlocutors, as there is a closure/conclusion of the concept that is being developed.
Despite this, we observe that these resumptions and systematizations do not occur to favor the presentation of multiple explanatory possibilities, which is also highlighted by Proulx et al. (2006) and Berdnaz (2005). Teacher Paula reinforces that students should build the graph their way, leading them to believe that building graphs means “painting cells”. Thus, the teacher did not make proposals based on the students’ stages of thought; instead, she chose strategies for them to develop.
Thus, the teacher must do more than just describe the processes for solving the task. As Proulx et al. (2006) state, teachers must adapt the students’ answers to take advantage of everything that may contribute to the discussion. Besides, they must clarify for the other students what was said by their colleagues. During the class, Paula sought to relate the concepts exposed in the examples of students’ daily lives with other activities they experienced. For example, she related the recurring bar graph in the book with the golden material used in previous classes and the pie chart with a pizza. According to Proulx et al. (2006), analogy and connection are fundamental for verbalizing concepts and essential for developing a clear and coherent statistical language.
Regarding the gestures, we analyzed that the teacher’s gesticulation complemented her explanation. In turn, the intonation and quality of her voice are presented as artifices to draw students’ attention to what is being explained.
We identified some repetition markers, such as: “well, huh, check it out, jeez, okay”, being a resource to invite students to participate in the class. Paula repeats the “ok” (tá, in Portuguese slang) several times to invite the students to participate, considering that the remote environment favors the lack of in-person student-teacher interaction. We also verified that the teacher uses verbs usually indicated to express reasoning, according to Koch (2010). However, in the context Paula uses them, they only reinforce actions the students had experienced. In this snippet, for example: “(...) Follow me, you can’t miss it. Do a teacher Paula is explaining, that there’s no way it can go wrong, okay?! After I insert the letter N, I leave two empty cells in front of the N, (...)”, the teacher says that she is explaining how to fill in the checkered grid, but in fact, she promotes a step-by-step on how that stage of the activity should be completed (Extract 5), which only reinforces how much the teacher’s oral explanation is centered on the resolution and conclusion of the activity without promoting discussions, problematizations, and controversies, essential aspects of the process that leads to learning.
We observed that the teacher performs meta-enunciative activities during class to anticipate what students will experience only as a strategy for organizing class time. We could observe it during class, when she anticipated they would use the book, for example. Thus, based on studies by Proulx et al. (2006), we do not see how Paula’s activity could contribute to the construction of challenging teaching. Instead, she presents descriptive and expository teaching, as mentioned before.
According to the argumentative operators indicated by Koch (2010), the teacher uses ‘then’ (então, in Portuguese) (with a frequency of 18 times) to support the closure of ideas during her oral explanation. However, according to the literature, argumentative operators help construct a point of view. Thus, considering the production context, the use of the operator did not serve to defend a point of view, as the literature states, but as a conclusion of something previously said. We can check this below: “Look, guys. Excellent! The graph brings information, and this information is usually in the form of quantity(...) So, here, the teacher brought the image of various types of graphs”.
Thus, we verified that there is no defense/presentation nor the use of arguments in the teacher’s oral explanation, which adds the idea of an explanation based on the description of procedures to be experienced.
We verified that “but, then” connectors enabled communication without problems, “then” was used to conclude a discussion, and the “and more/moreover” to complement the information. In this way, we understand that the teacher's connectors enabled her explanation, i.e., helped her communicate what she wanted. In oral language, there are more difficulties in reconstructing what has already been said because one cannot erase the spoken words but can reformulate them; they are fundamental in this reconstruction process, as Koch argues (2010). The use of “here, there, over there” is also consistently associated with gestures to locate information, which are used to enhance the oral explanation. However, they replace the name of a concept or information that should be utilized for student learning. Thus, we can highlight here a gap in the teacher’s conceptual mastery of content.
We also identified some statistical terms, such as chart, survey, interview/pool, table, bar chart, pie chart, line chart, title, source, data, and bar spacing. However, the definitions present many problems, as she interchanges the concepts of research/survey and poll or affirms that a graph's function is to quantify. Berdnaz (2005) highlights the importance of using terms in the communication built in the classroom, which, in our case, is statistical communication, as fundamental in understanding the content to be developed in class.
During the class, Paula uses words that students need to write down, such as a title. About teaching resources, she used a textbook, slides, videos, and a checkered grid, which allowed for a more diversified class and probably more motivating for the students. In this way, we verified that she complemented her oral explanations with the visual and didactic resources, which contributed to presenting concepts, exemplifying situations, and describing what was being presented, resulting in a work that makes possible the development of the proposed activities.
Regarding technological resources, we observed that Paula does not use them as a didactic tool but only as support. However, it is necessary to relativize the use of technologies since teachers, in the face of the COVID 19 pandemic, had to adapt their face-to-face classes to remote ones, without time to appropriate these new tools, as Santos (2020) argues.
Conclusion
Given the importance of teachers’ oral explanations for student learning, this research aimed to analyze them in an elementary school 1st-grade class on graph construction, considering the influences of the classroom context (face-to-face or remote) and the conceptual, didactic, oral, and gesture mastery.
We have concluded that, regardless of the online or in-person teaching environment, the teachers directed the development and resolution of activities without promoting questioning that would direct teaching towards a challenging process.
Moreover, the teachers presented a non-challenging didactic proposal and presented gaps in the conceptual mastery of graph construction, which can be explained by the oral and gestural language the teachers used.
We verified how much didactic and conceptual masteries play a vital role in constructing and developing teachers’ oral explanations. In this way, the need for initial and continued education processes on statistics and/or teachers’ awareness of their conceptual deficiencies is made explicit so that teaching actually enables student learning.
The study of the enunciation of the oral explanation contributed fundamentally to understanding the teachers’ remote and face-to-face teaching processes. Therefore, we believe that besides being a way of investigating teaching, we teachers must reflect on what and how we speak when pursuing our students’ learning.
REFERENCES
BEDNARZ, N. Parler lês Mathématiques. Vie Pédagogique, n. 136, 2005. [ Links ]
BURGES, T. How Does Teacher Knowledge in Statistic impact on teacher listening? Mathematics Education, Australasia, 2012. [ Links ]
CAZORLA, I.; CASTRO, F. O papel da estatística na leitura do mundo: o letramento estatístico. Publication UEPG Ciências Humanas, Linguística, Letras e Artes, Ponta Grossa, v.16, n.1, 2009. [ Links ]
CAZORLA, I.; RAMOS, K.; JESUS, R. Reflexões sobre o ensino de estatística na Educação Básica: lições que podem ser aprendidas a partir da feira de ciências e matemática da Bahia - FECIBA. Anais do VI Seminário Internacional de Pesquisa em Educação Matemática. Pirenópolis, 2015. [ Links ]
GUIMARÃES, G.; CAVALCANTI, M.; EVANGELISTA, B. Ensino e aprendizagem de escalas representadas em gráficos: alunos do ensino regular e EJA dos anos iniciais. Revista de Matemática, Ensino e Cultura, v.15, p.43 - 59, 2020. http://www.rematec.net.br/index.php/rematec/article/view/299. [ Links ]
GUIMARÃES, G. GITIRANA, V. Estatística no Ensino Fundamental: a pesquisa como eixo estruturador. In: BORBA, R.; MONTEIRO, C. (orgs.) Processo de ensino aprendizagem em educação matemática. Recife: Editora da UFPE, 2013. [ Links ]
GUIMARÃES, G.; OLIVEIRA, I.; MOTTET, M. Domínio da linguagem oral e do conceito matemático: fatores determinantes na explicação oral de professores dos anos iniciais. Anais do VII Congresso Iberoamericano de Educatión Matemática. Montivideo, 2013. [ Links ]
KOCH, I. V. A inter-ação pela linguagem. 10. ed. São Paulo: Contexto, 2010. [ Links ]
MARCUSCHI, L. A. Fala e escrita. Belo Horizonte: Autêntica, 2007. [ Links ]
MARTINS, P.B.; CURI, E.; NASCIMENTO, J. C. P. O Ensino de Estatística no 2°ano do Ensino Fundamental: uma experiência em sala de aula com a construção de gráficos e tabelas. REnCiMa, v. 9, n. 2, p. 230 - 246, 2018. [ Links ]
MUNIZ, R.; GUIMARÃES, G. De quadrado em quadrado construímos um gráfico? GUIMARÃES, G.; CARVALHO, I. (orgs.) Probabilidade e Estatística na Escola. Recife: Ed. Universidade Federal de Pernambuco, 2021. (Capítulo 7). [ Links ]
PEÇA, C. Análise e interpretação de tabelas e gráficos estatísticos utilizando dados interdisciplinares. Dia a dia Educação. Paraná: 2012. [ Links ]
PROULX, J. BEDNARZ, N. D. KIERAN, C. Caractéristique dês explications orale sen classe de mathématiques: construction d’uncadre d’analyse pour rendre compte de la pratique dês futurs enseignants et futures enseignantes de mathématiques du secondaire. Canadian Jornal of Science, p. 267-292, 2006. [ Links ]
RODRIGUES, C., MENEZES, L., PONTE, J. P. Práticas de discussão em sala de aula de matemática: o caso de dois professores. Bolema, Rio Claro, v. 32, n. 61, p. 398-418, 2018. [ Links ]
SCHNEUWLY, B.; DOLZ, J. Os gêneros orais e escritos na escola. Campinas, SP: Mercado das letras, 2004. [ Links ]
SCHNEUWLY, B. DOLZ, J. Os gêneros escolares: das práticas de linguagem aos objetos de ensino. Revista Brasileira, Rio de Janeiro, p. 5-16, 1999. [ Links ]
Received: April 01, 2022; Accepted: April 01, 2023
 Este é um artigo publicado em acesso aberto sob uma licença Creative Commons
